


Abstract
Copeptin is the C-terminal fragment of the arginine vasopressin (AVP) prohormone whose measurement is more robust than that of AVP. Similar release and clearance characteristics have been suggested promoting copeptin as a surrogate marker.
To characterize the physiology of osmotically regulated copeptin release and its half-life in direct comparison with plasma AVP.
Ninety-one healthy volunteers underwent a standardized three-phase test protocol including (1) osmotic stimulation into the hypertonic range by hypertonic-saline infusion followed by osmotic suppression via (2) oral water load and (3) subsequent glucose infusion. Plasma copeptin, AVP, serum sodium, and osmolality levels were measured in regular intervals.
In phase 1, an increase in median osmotic pressure [289 (286; 291) to 311 (309; 314) mOsm/kg H2O] caused similar release kinetics of plasma copeptin [4 (3.1; 6) to 29.3 (18.6; 48.2) pmol/L] and AVP [1 (0.7; 1.6) to 10.3 (6.8; 18.8) pg/mL]. Subsequent osmotic suppression to 298 (295; 301) mOsm/kg at the end of phase 3 revealed markedly different decay kinetics between both peptides—an estimated initial half-life of copeptin being approximately 2 times longer than that of AVP (26 vs 12 minutes).
Copeptin is released in equimolar amounts with AVP in response to osmotic stimulation, suggesting its high potential as an AVP surrogate for differentiation of osmotic disorders. Furthermore, we here describe the decay kinetics of copeptin in response to osmotic depression enabling to identify a half-life for copeptin in direct comparison with AVP.
Arginine vasopressin (AVP) is acting as the central regulator of body fluid homeostasis and is essential in the regulation of the vascular tonus and endocrine stress response. Unfortunately, measurement of mature circulating AVP is technically difficult and subject to several preanalytical errors for a number of reasons. These include, among others, a rapid clearance from the circulation, a high preanalytical instability in isolated plasma or serum, a higher than 90% binding to platelets in the circulation, resulting in an underestimation of released amounts of AVP in plasma, and usually a long turnaround time, limiting its diagnostic utility in clinical routine care (1–5). Despite ongoing improvements of the measurement methodology of AVP (6), its small molecular size considerably impairs the antibody development for accomplishment of sandwich immunoassays. As a consequence, all current competitive AVP radioimmuoassays need relatively large plasma volumes, require cumbersome protein extraction, and have incubation times of 24 hours or longer (6). In other words, they are labor intensive, expensive to run, and fail to deliver results in due course as needed for clinical and emergency care.
Copeptin, the C-terminal part of the AVP precursor peptide vasopressin-neurophysin 2-copeptin, is a glycosylated 39-amino acid-long peptide with a leucine-rich core segment (7). It is released in equimolar amounts with AVP in response to osmotic and hemodynamic stimuli during precursor processing (1, 2, 8). Due to its high ex vivo stability and simple and robust measurement, copeptin offers a promising alternative method to indirectly assess the release of the mature hormone. With the development of the first sandwich immunoluminometric assay for copeptin (1, 9), intensive research focused on functional and biological characterization of this surrogate candidate. Similar patterns of copeptin release or behavior, respectively, and mature AVP could be confirmed in various trials both in health (1, 10, 11) and disease (8, 12–15). Therefore, copeptin today is accepted as an individual yet sensitive surrogate marker of circulating AVP in specific clinical questions. Beyond its properties as an unspecific stress-related outcome marker in acute disease (15–23), the utilization of copeptin as a unique supplemental diagnostic biomarker in osmotic fluid disorders is more specific and clinically relevant. First clinical trials indicate a promising diagnostic benefit of copeptin measurements compared with current test standards both in the differentiation of AVP insufficiency disorders (12, 24, 25) as well in the differentiation of AVP-dependent and -independent hypo-osmotic disorders (8, 15, 26). The concept of replacing a bioactive peptide with a nonfunctional stable peptide is a well-known concept already applied in clinical routine, for instance, c-peptide, B-natriuretic peptide, adrenomedullin, and enothelin-1.
An important limitation, however, for the interpretation of peptide levels as a prognostic and/or diagnostic parameter is the yet unknown release and decay kinetics of copeptin in relation to osmotic pressure.
Therefore, the objective of this study was to characterize the exact in vivo release and decay kinetics of copeptin in response to osmotic stimulation by a hypertonic saline infusion followed by osmotic suppression via a standardized oral water load and glucose infusion in sex- and age-matched healthy volunteers.
Material and Methods
Study cohort
This prospective study was performed in 91 healthy volunteers (47 women) in their third to sixth decade of life. Volunteers were recruited at two tertiary hospitals in Switzerland and Germany. Inclusion criteria were age >18 years and normonatremia. Exclusion criteria involved a history or presence of polyuria/polydipsia syndrome, hyponatremia/hypernatremia, heart failure, liver cirrhosis, nephrotic syndrome or renal failure (defined as an estimated glomerular filtration rate <60 mL/min/1.73 m2), anemia, uncontrolled hypertension, chronic alcohol consumption, body mass index >28 kg/m2 and <18 kg/m2, any drug intake (except oral contraception), and other therapy-requiring diseases. The local ethical committees approved the study, and written informed consent was obtained from all patients. The study was registered on ClinicalTrials.gov (NCT02647736).
Study design
All study volunteers refrained from smoking and drinking alcoholic beverages for at least 24 hours prior to the test beginning. They were permitted to eat until midnight and drink until 6 am during the study day.
On study day, subjects underwent a standardized medical evaluation. Once eligibility was confirmed, two indwelling cannulae were placed into each antecubital vein for blood withdrawal and solute infusion, respectively. Following a 30-minute rest in a recumbent position, baseline blood was taken for laboratory evaluation of serum sodium, potassium, osmolality, creatinine, urea, plasma glucose, AVP, and copeptin concentrations.
Combined saline infusion and oral water load/glucose infusion test
Each volunteer underwent a three-phase test protocol including a 3% hypertonic saline infusion test (phase 1), an oral water load test (phase 2), and a 5% glucose infusion test (phase 3). Phase 1 was started with a 250-mL bolus infusion of hypertonic saline (3% saline, 513 mOsm/L) intravenously administered within <15 minutes and then continued with an infusion rate of 0.15 mL/kg/min until a serum sodium concentration of ≥150 mmol/L or a totaling infusion time exceeded 180 minutes. Subsequently, the infusion was stopped and subjects immediately underwent an oral water load test, including an intake of 30 mL/kg body weight of tap water within <30 minutes (phase 2) before they were administered an infusion of approximately 500 mL 5% glucose over 60 minutes until serum sodium dropped to the baseline value ±2 mmol/L (phase 3). Subjects were monitored constantly during hypertonic saline infusion for vital parameters, and serum sodium and potassium levels were controlled closed-meshed. For laboratory evaluation as specified previously, blood was taken at the beginning and end of every test phase as well as at predefined intervals during hypertonic saline infusion (every 30 minutes) and during 5% glucose infusion (at 15, 30, 40, 50, and 60 minutes).
Predefined stop criteria involved sustained and severe feeling of malaise (headache, dizziness, nausea, etc.), hyperkalemia (>5.5 mmol/L), or any subjective reason preventing the participant to finish the test protocol.
Visual analog scale
During the hypertonic saline infusion test, volunteer’s individual level of acceptability (including thirst, vertigo, headache, nausea, and malaise) was quantified via a visual analog scale (VAS) ranging from 1 (highest acceptability) to 10 (lowest acceptability) at each time point of blood withdrawal.
Laboratory measurements
Routine measurements were performed immediately in nonfrozen plasma and serum samples by automated biochemical analyses. For comparability reason of measured serum osmolality in both study centers, calculated osmolality was applied in the subsequent analysis and computed as follows: osmolality (mOsm/kg) = 2 × [Na] + [Glucose] + [Blood urea nitrogen].
Blood for copeptin analysis was sampled in EDTA tubes, immediately centrifuged at 4°C, and plasma stored at –80°C until analysis. Copeptin was measured in a single blinded batch by a chemiluminescence sandwich immunoassay (B.R.A.H.M.S CT-proAVP LIA; Thermo Scientific Biomarkers, Hennigsdorf, Germany) as previously described (1, 8, 12, 15, 24). The assay has a lower detection limit of 0.4 pmol/L, an intra-assay variability of 3.7% to 2.5% at 2.14 to 514.4 pmol/L, and an interassay variability of 22.9% to 3.6% at 0.58 to 902.9 pmol/L (1, 19). Blood for AVP measurement was sampled in chilled heparin tubes, immediately centrifuged at 4°C, and stored at –80°C until batch analysis. AVP levels were determined by radioimmunoassay in the Clinical Research Unit Laboratory (Peter Kopp) at the Feinberg School of Medicine, Northwestern University (Chicago, IL) using an established antibody and protocol as previously described (27).
Modeling approaches
All data fitting was performed with nonlinear mixed-effect modeling (28). This method characterizes individual profiles and allows (1) to estimate individual model parameters, (2) to characterize intersubject variability, (3) to estimate overall population behavior, (4) to test effects of covariates on individual behavior, and (5) to simulate additional populations.
Characterizing relationship between serum sodium or osmolality and copeptin
Estimating half-life of plasma copeptin and AVP
Statistics
All data for continuous variables are expressed as the mean [standard deviation (SD)] or as the median and interquartile range (IQR), as appropriate. Categorical variables are reported as a number and a percentage. Continuous variables were compared with the Wilcoxon signed rank test and the Student’s t test in the software package R 3.1.2. (R Core Team, Vienna, Austria) (31). A two-tailed P value <0.05 was considered statistically significant. Nonlinear mixed-effect modeling (28) was performed in Monolix 4.3.3 (Lixoft, Orsay, France) (32).
Results
Baseline characteristics
Ninety-one healthy volunteers (n = 47 females, 20 to 54 years) were included in the study. Baseline characteristics are shown in Tables 1–3 . Median baseline copeptin concentration was significantly higher in men (5.95 pmol/L) than in women (4.17 pmol/L; P < 0.05), without significant correlations between baseline copeptin and covariates including body weight, age, creatinine, or glomerular filtration rate. Median baseline AVP concentration was 1 pg/mL (0.7; 1.6) without a significant difference between females and males.
Baseline Characteristics of the 91 Healthy Study Participants
| Study Subjects (N = 91) | |||
|---|---|---|---|
| Mean (SD) | Median (IQR) | Range | |
| Clinical variables | |||
| Age (y) | 30.7 (8.6) | 27 (25; 34.5) | 20–54 |
| BMI (kg/m2) | 23.0 (2.7) | 22.72 (21.2; 24.8) | 18–28 |
| Systolic blood pressure (mm Hg) | 121.1 (12.3) | 122 (114.2; 129) | 85–145 |
| Diastolic blood pressure (mm Hg) | 74.2 (9.5) | 74.5 (67; 82) | 56–95 |
| Heart rate (bpm) | 68.3 (12.1) | 68 (60; 75) | 37–107 |
| Biochemical parameters | |||
| Copeptin (pmol/L) | 5.03 (3.8) | 4 (3.1; 6) | 0.9–21.4 |
| AVP (pg/mL) | 1.35 (0.95) | 1 (0.7; 1.6) | 0.5–6.1 |
| Serum sodium (mmol/L) | 139.6 (2.2) | 139 (138; 141) | 135–147 |
| Measured serum osmolality (mOsm/kg) | 288 (9.1) | 289 (281; 295) | 270–306 |
| Calculated serum osmolality (mOsm/kg) | 289 (4.6) | 289 (286; 291) | 280–304 |
| Urine osmolality (mOsm/kg) | 614 (318) | 686 (300; 885) | 56–1125 |
| Serum creatinin (μmol/L) | 73.4 (13.3) | 73 (64.8; 83) | 40–106 |
| GFR CKD-EPI (mL/min/1.73 m2) | 107.8 (12.8) | 109 (100; 117) | 77–131 |
| Serum urea (mmol/L) | 4.67 (1.2) | 4.51 (3.6; 5.4) | 2.7–9.7 |
Abbreviations: BMI, body mass index; GFR CKD-EPI, glomerular filtration rate Chronic Kidney Disease Epidemiology Collaboration.
Age-Specific Baseline Characteristics of the Osmotic Profile
| Age in Years | Plasma Copeptin (pmol/L) | Serum Sodium (mmol/L) | Measured Serum Osmolality (mOsm/kg H2O) | Calculated Osmolality (mOsm/kg H2O) | Plasma AVP (pg/mL) | ||||||||||
|---|---|---|---|---|---|---|---|---|---|---|---|---|---|---|---|
| Mean (SD) | Median (QR) | Range | Mean (SD) | Median (IQR) | Range | Mean (SD) | Median (IQR) | Range | Mean (SD) | Median (IQR) | Range | Mean (SD) | Median (IQR) | Range | |
| 20–29 (n = 55) | 5.1 (4.3) | 3.9 (2.65; 6.6) | 0.9–21.4 | 139 (2.3) | 139 (138; 141) | 135–146 | 287 (9.5) | 285 (279; 293) | 270–306 | 288 (4.7) | 288 (285; 291) | 280–302 | 1.4 (1.0) | 1 (0.7; 2) | 0.5–6.1 |
| 30–39 (n = 20) | 4.5 (1.6) | 4.3 (3.4; 5.5) | 1.2–7.8 | 140 (1.8) | 140 (138; 141) | 136–142 | 289 (9.0) | 292 (281; 295) | 273–305 | 289 (3.9) | 290 (287; 293) | 282–294 | 0.9 (0.44) | 0.8 (0.7; 1) | 0.5–2.3 |
| 40–49 (n = 10) | 5.3 (5.1) | 4.2 (2.8; 5.6) | 1.1–19.1 | 140 (2.0) | 140 (138; 141) | 138–144 | 291 (6.2) | 292 (288; 296) | 281–299 | 289 (4.0) | 288 (287; 290) | 285–299 | 1.4 (0.97) | 1.3 (0.8; 1.6) | 0.6–3.4 |
| 50–59 (n = 6) | 5.3 (1.9) | 5.5 (4.0; 6.9) | 1.9–7.1 | 140 (3.4) | 140 (138; 141) | 138–144 | 293 (8.3) | 295 (288; 299) | 281–303 | 291 (6.4) | 291 (288; 292) | 286–304 | 1.8 (1.1) | 1.5 (1.4; 1.6) | 0.7–3.9 |
Sex-Specific Baseline Characteristics of the Osmotic Profile
| Female (n = 47) | Male (n = 44) | P Value | |||
|---|---|---|---|---|---|
| Mean (SD) | Range | Mean (SD) | Range | ||
| Copeptin (pmol/L) | 4.17 (3.8) | 0.9–20.3 | 5.95 (3.6) | 2.1–21.4 | 0.02 |
| AVP (pg/mL) | 1.16 (0.66) | 0.5–3.4 | 1.48 (1.1) | 0.5–6.1 | 0.14 |
| Serum sodium (mmol/L) | 139.4 (2.2) | 135–147 | 139.7 (2.3) | 135–146 | 0.49 |
| Measured serum osmolality (mOsm/kg H2O) | 287.1 (8.6) | 273–305 | 289 (9.6) | 270–306 | 0.32 |
| Calculated serum osmolality (mOsm/kg H2O) | 288 (4.6) | 280–304 | 289 (4.6) | 280–302 | 0.09 |
Reported P values were computed with the Student’s t test.
Phase 1: Hypertonic saline infusion test
To reach the predefined test endpoint of serum sodium ≥150 mmol/L, a mean volume of 1494 ± 380 mL of 3% saline was infused over an average duration of 140 ± 29 minutes. At the end of phase 1, the median of the maximal individual serum sodium, calculated osmolality, plasma copeptin, and AVP concentration was computed. Median serum sodium rose to 151 (150; 152) mmol/L and calculated osmolality to 311 (309; 314) mOsm/kg H2O, causing a copeptin peak response of 29.3 (18.6; 48.2) pmol/L and an AVP peak response of 10.3 (6.8; 18.8) pg/mL (Fig. 1). No sex-specific effect could be found at copeptin peak concentrations.
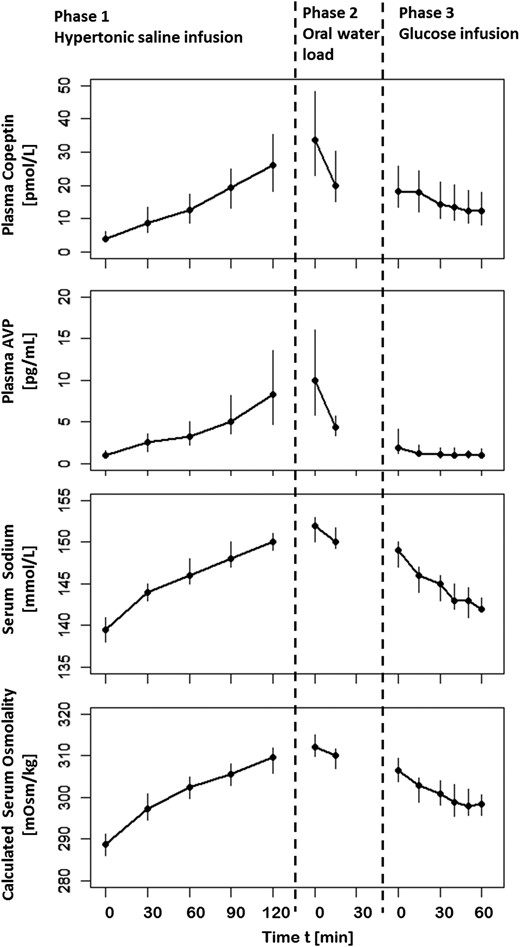
Median plasma copeptin, plasma AVP, serum sodium, and calculated serum osmolality for all subjects in response to osmotic stimulation and subsequent suppression at specific time points. The x-axis illustrates duration of hypertonic 3% saline infusion, oral water load, and 5% glucose infusion. Bars show IQRs.
The area of normality describes the physiologic relationship of plasma copeptin as a function of serum sodium and calculated osmolality and was based on 474 (sodium) or 470 (osmolality) data pairs from all 91 healthy subjects. Individual copeptin as well as sodium and calculated osmolality baselines were included [compare Eq. (2)]. Individual baseline characteristics such as body weight and age showed no significant effect on the plasma copeptin response (Supplemental Table 1). Based on the obtained results, 1000 populations were simulated. For these data points, the 5% and 95% confidence intervals were calculated with 25 (sodium-related) and 41 (osmolality-related) bins to produce the physiological area of normality in relation to serum sodium and osmolality (Fig. 2). The solid black line shows the 50% median based on the simulated data. The applied saturation function Eq. (2) allows prediction of a theoretical maximal average population copeptin concentration value of 65.2 pmol/L and 69.4 pmol/L, respectively.
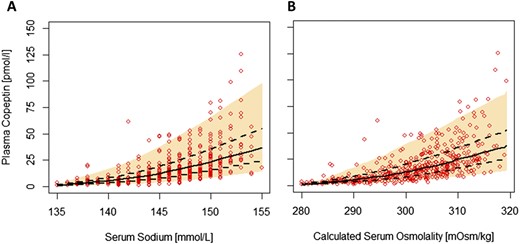
Physiological area of normality of plasma copeptin as a function of (A) serum sodium and (B) calculated serum osmolality during hypertonic saline-induced osmotic stimulation. Shaded areas are delimited by 5th and 95th percentiles of simulated populations (n = 1000). The solid black line shows the 50% median based on simulated data, and the dashed line corresponds to 25th to 75th percentiles.
For escalating copeptin baseline values (ranging from 2 to 18 pmol/L), an increase of copeptin concentration related to serum sodium or calculated serum osmolality is shown for the estimated typical population parameters (Supplemental Fig. 1). Changes of copeptin from baseline as a function of serum sodium and osmolality concentrations are listed in Supplemental Table 2.
Consistent with previous reports, overall copeptin and AVP data were highly correlated, with a Spearman’s rank correlation coefficient of rs = 0.94 (P < 0.001) (10). The relationship between copeptin and AVP is presented in Supplemental Fig. 2.
Overall, the hypertonic saline infusion was tolerated well from participating volunteers. Self-evaluation of the test comfort by VAS quantification exclusively revealed a transitory sensation of light headache [0.81 ± 1.3, 0 (0,1)] and slight nausea [0.52 ± 1.2, 0 (0,0)] at the time of reaching the test endpoint. Thirst perception was quantified from volunteers via VAS from 2.13 ± 1.84 [2 (1, 3)] at baseline to 7.09 ± 2.09 [7 (6, 8.5)] at peak serum sodium levels.
Phases 2 and 3: Oral water load and 5% glucose infusion tests
At the end of test phase 1 and directly before initiation of the oral water load test, peptide levels reached maximum concentrations, with a median copeptin and AVP of 33.8 (22.9; 48.2) pmol/L and 10 (5.8; 16) pg/mL, respectively (computed from the first available measurement at phase 2). A moderate decrease in median serum sodium to 149 (147; 150) mmol/L and calculated osmolality levels to 307 (304; 309) mOsm/kg after the oral water load test (2083 ± 401 mL) and before 5% glucose infusion resulted already in a distinctive drop in median plasma copeptin concentration to 18.1 (13.4; 25.8) pmol/L and an even more pronounced drop to a median plasma AVP of 1.9 (1.2; 4.1) pg/mL. To reach the predefined endpoint of the suppression test, a mean volume of 569 ± 154 mL of 5% glucose additionally had to be administered, resulting in a further decrease in serum sodium and calculated osmolality to median levels of 142 (141; 143) mmol/L and 298 (295; 301) mOsm/kg, respectively. This reduction in osmotic pressure caused a decrease of plasma copeptin and AVP to 11.1 (7.8; 15.4) pmol/L and 1 (0.7; 1.6) pg/mL, respectively, corresponding to a 67% and 90% decay within 93 ± 20 minutes from maximum median plasma peptide levels.
Overall population dynamics of plasma copeptin, AVP, serum sodium, and calculated osmolality over time are illustrated in Fig. 1. A percentage change comparison is shown in Fig. 3, illustrating a similar increase of AVP and copeptin in phase 1, a stronger decline of AVP compared with copeptin in phases 2 and 3, and nearly constant levels of AVP and copeptin at the end of phase 3.
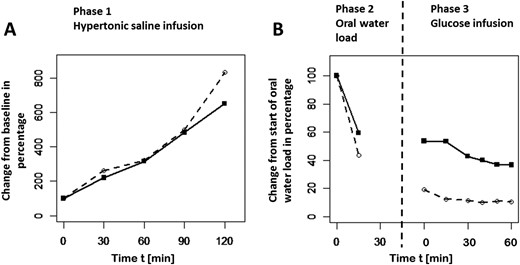
(A) Percentage change from baseline of AVP (○, dashed line) and copeptin (▪, solid line) over time is shown for hypertonic saline infusion. (B) Change from start of oral water load. Hypertonic saline infusion, oral water load, and glucose infusion were administered in a continuous sequence without time interruption in between (see study design).
An analysis with combined phase 2 (oral water load) and 3 (5% glucose infusion test) data was performed for calculating decay kinetics (half-life) of plasma copeptin and AVP. Graphical exploration suggests an initial fast segment and a consecutive slow terminal segment (Figs. 1 and 3 ). With the biexponential model Eq. (5), half-life of the initial fast segment was estimated to be 12 minutes for AVP and 26 minutes for copeptin (216% of AVP’s initial half-life). The slow terminal segment indicates a very slow decline of AVP and copeptin in phase 3, corresponding to a long half-life (estimated to be >100 minutes) (Supplemental Fig. 3). Given the limited observation period in phase 3, the terminal half-life could not be reliably estimated for both biomarkers.
Discussion
To the best of our knowledge, the present prospective study is the most comprehensive characterization of the physiology of osmotic release of copeptin under controlled osmotic manipulation and the first to give information about the decay kinetics and half-life of plasma copeptin in direct comparison with AVP. As a promoted surrogate marker for the AVP hormone in various clinical situations, this is important information for the interpretation of copeptin values also as an independent biomarker for diagnosis and outcome prediction.
To study the release kinetics of plasma copeptin, an established hypertonic saline infusion protocol was used (12, 15), which enables a robust, but controllable, increase in osmotic pressure. Notably, the test protocol was also designed as a proof of concept to form the fundament for a putative unique diagnostic test protocol for patients with questionable AVP deficiency. A robust increase in osmotic pressure toward the hyperosmotic range is obviously mandatory to reliably assess the functionality of the osmotic vasopressin system (2). Our findings indicate that a constant rate of hypertonic saline infusion is a safe, well-tolerated, and economically efficient means to reliably increase serum osmolality to diagnostically meaningful hypertonic levels (≥150 mmol/L) within less than 3 hours (mean: 140 ± 29 minutes). As expected, correlation analyses in both sexes confirmed serum osmolality and sodium levels as prime regulators of copeptin, with a significant exponential increase in peptide levels in relation to osmotic pressure followed by a linear phase, and at very high copeptin level saturation (Fig. 2). Consistent with previous findings, men showed slightly higher copeptin levels than women in the normo-osmotic range (Table 3) (33). Interestingly, however, this sex-specific difference could not be detected in the hyperosmolar range. In contrast to many other biomarkers, differences in age had no effect on copeptin release (Table 1). In general, a statistically significant difference over the age groups in ascending order could not be found for copeptin, sodium, measured and calculated osmolality, and AVP.
Including the largest sex-matched and age-distributed population, our investigation extends the existing database on the reference area describing the osmotic sensitivity of copeptin release (12, 15) up to the diagnostically critical hyperosmotic range (34).
For clinical implementation, areas of normality were calculated for serum osmolality- and sodium-related copeptin release (Fig. 2). From the applied nonlinear mixed-effect modeling approach, the estimated typical population parameters were used to visualize the increase of copeptin concentration related to serum sodium or calculated serum osmolality (Supplemental Fig. 1) for a broad range of escalating copeptin baseline values. Copeptin changes from baseline in relation to serum sodium and osmolality concentrations are listed in Supplemental Table 2. Those reference values are to be assessed as population estimates and are meaningful additions to clinical judgment. Confirming established data from the literature, our present analyses show very similar release kinetics of copeptin and AVP in response to changes in osmotic pressure (35–38) (Supplemental Fig. 2).
In contrast to its release kinetics, very little is known about the metabolism of copeptin, and its clearance from circulation has never been evaluated. Our findings reveal much higher osmolality-specific normal values for plasma copeptin than for AVP (Tables 1–3 ) (35–38). This, together with the fact that copeptin is much larger than AVP (38 vs 9 amino acids), likely also affects its clearance rate and half-life. We here present a new method of efficient suppression of osmotic pressure, allowing to assess the in vivo decay characteristics of stimulated endogenous copeptin based on an oral water load followed by an infusion of 5% glucose.
Studies on elimination kinetics of endogenous and exogenous AVP showed that AVP disappeared in an exponential manner with half-lives between 10 to 44 minutes, depending on the state of hydration, the chosen test method, species, and the specificity of immunoassays (31, 39, 40). Consistent with these reported values, analysis of combined phase 2 and 3 data indicated a biexponential kinetic behavior of AVP and copeptin. Half-lives for the initial fast decline of AVP and copeptin were estimated to be 12 and 26 minutes, respectively, suggesting a 2-times-longer half-life of copeptin in relation to AVP. The terminal half-life was unreasonably large for both AVP and copeptin due to very slow decline and a limited observation period in phase 3 (Supplemental Fig. 3). The initial fast decline of AVP and copeptin during phase 2 (oral water load) may be explained not only by osmotic dilution, but also by the fact that the act of drinking itself causes inhibition of AVP secretion (41). This may have resulted in cessation of AVP secretion far quicker than the slower absorption of ingested water into the circulation.
The different half-lives of copeptin and AVP most likely reflect the metabolic clearance rates of these peptides. Other than AVP, which is inactivated by plasma and tissue endopeptidases in the kidney and particularly in the liver (37), the catabolism of copeptin has never been evaluated. The fact that copeptin does not accumulate as a junk protein in the circulation, and that its elimination stops once removed from the circulation, argues against the role of circulating proteases. Next to protease degradation, receptor-mediated uptake and internalization of AVP could be an additional factor that may increase the clearance rate of AVP vs copeptin. Theoretically, because of its small size of 5 kDa, it could be cleared by the kidneys. In fact, recent data show that copeptin is at least partly eliminated by the kidneys (42), and that in patients with chronic kidney disease, plasma copeptin levels inversely correlate with decreasing glomerular filtration rate, suggesting a renal clearance of copeptin (43). However, because all study participants had normal renal function, this should not have influenced the elimination of copeptin from the circulation.
Limitations
The technique we used for osmotic suppression (i.e., oral water load plus 5% glucose, possibly not completely suppressing endocrine output) might lead to a conservatively long estimate of the clearance time. We assume a residual osmotic stimulus during water load, abating only with the beginning of glucose infusion. However, the chosen design attests an efficient tool, simple to implement into clinical routine, to reliably bring down high-stimulated osmolality back into the normal range. Secondly, measured serum osmolality in both tertiary study centers revealed significant differences related to serum sodium concentration, despite using the same method of depression of freezing point (Supplemental Fig. 4). Variances in reference range and absolute values of measured osmolality, depending on the laboratory performing the test, are known clinical issues (44–46). Therefore, we preferred to illustrate copeptin kinetics in relation to calculated osmolality and sodium levels as the more robust and established parameters for clinical use.
Conclusion
In conclusion, our data document similar release kinetics of plasma copeptin and AVP under very sensitive osmotic control. This observation has important clinical ramifications, indicating that controlled manipulation of osmotic pressure is a prime method to basically, simply, and reliably categorize AVP-dependent fluid disorders. Furthermore, we present here an initial half-life estimate for copeptin being approximately 2 times longer than that of AVP. The identification of a markedly differing clearance rate between both peptides after a similar secretion rate suggests a distinct metabolism and is clinically important to be considered for interpretation of these peptides in the characterization of disorders with altered fluid homeostasis.
Abbreviations:
Acknowledgments
We thank Cemile Bathelt and Nina Hutter (Clinical Trial Unit, University Hospital Basel) and Mary Beth Gaskill (Clinical Research Unit Laboratory, Northwestern University) for excellent technical assistance.
Financial Support: This work was supported by Thermo Fisher Scientific Biomarkers (Hennigsdorf, Germany).
Clinical Trial Information: ClinicalTrials.gov no. NCT02647736 (registered 6 January 2016).
Disclosure Summary: W.K.F. and M.C.-C. received speaking honoraria by Thermo Fisher Scientific. The remaining authors have nothing to disclose.
References
Author notes
These authors contributed equally to this study.
