


Abstract
Exaggerated hepatic triglyceride accumulation (i.e., hepatic steatosis) represents a strong risk factor for type 2 diabetes mellitus and cardiovascular disease. Despite the clear association of hepatic steatosis with impaired insulin signaling, the precise molecular mechanisms involved are still under debate. We combined data from several metabolomics techniques to gain a comprehensive picture of molecular alterations related to the presence of hepatic steatosis in a diabetes-free sample (N = 769) of the population-based Study of Health in Pomerania.
Liver fat content (LFC) was assessed using MRI. Metabolome measurements of plasma and urine samples were done by mass spectrometry and nuclear magnetic resonance spectroscopy. Linear regression analyses were used to detect significant associations with either LFC or markers of hepatic damage. Possible mediations through insulin resistance, hypertriglyceridemia, and inflammation were tested. A predictive molecular signature of hepatic steatosis was established using regularized logistic regression.
The LFC-associated atherogenic lipid profile, tightly connected to shifts in the phospholipid content, and a prediabetic amino acid cluster were mediated by insulin resistance. Molecular surrogates of oxidative stress and multiple associations with urine metabolites (e.g., indicating altered cortisol metabolism or phase II detoxification products) were unaffected in mediation analyses. Incorporation of urine metabolites slightly improved classification of hepatic steatosis.
Comprehensive metabolic profiling allowed us to reveal molecular patterns accompanying hepatic steatosis independent of the known hallmarks. Novel biomarkers from urine (e.g., cortisol glucuronide) are worthwhile for follow-up in patients suffering from more severe liver impairment compared with our merely healthy population-based sample.
The inflated hepatic accumulation of triglycerides (TGs), typically above 5%, represents a pathophysiological condition defined as hepatic steatosis, which can proceed to steatohepatitis and even cirrhosis. The latter is associated with an increased risk for hepatocellular carcinoma (1).
Obesity is a major contributor to the development of hepatic steatosis (2). Estimates of its prevalence vary greatly between 10% and 35% depending on the definition used (based on ultrasonography examination, liver biopsy, MRI, and/or serum markers) and ethnicity (3). Furthermore, hepatic steatosis was found in 70% of patients with type 2 diabetes mellitus (4). Despite its high correlation with obesity, hepatic steatosis is an independent predictor for insulin resistance (5) and cardiovascular risk and hence mortality (6, 7).
The pathophysiological mechanisms underlying hepatic steatosis are still incompletely understood. In general, development is thought to be caused by increased release of free fatty acids from adipose tissue as a result of nutritional overload and possibly impaired insulin sensitivity (8). As the amount of fatty acids subsequently taken up by the liver exceeds the hepatic metabolic capacities for oxidation, excess TGs are stored as lipid droplets in the hepatocyte cytoplasm.
Apart from the classic hallmarks of hepatic steatosis (i.e., hypertriglyceridemia, insulin resistance, and inflammation), a number of metabolome analyses [for review see (9)] have greatly broadened our understanding of the underlying pathology and have suggested novel biomarkers. Briefly, metabolomics approaches done primarily in a case-control setting have revealed alterations in simple (10, 11) and complex (12, 13) lipids, amino acid metabolism (14–16), and amides (17), as well as shifts in metabolites produced by microbiota (18). Exemplarily, surrogate markers of oxidative stress, namely γ-glutamyl dipeptides, have been shown to discriminate between different stages of liver disease (19). More recently, Alonso et al. (20) described three distinct molecular profiles of fatty liver disease based on the combination of an animal model and patient data. However, up to now such studies have been restricted mostly to matched case-control designs including (morbidly) obese subjects (9) and are thus of only limited generalizability. Therefore, in the current study, we analyzed the association between liver fat content (LFC) determined by MRI and metabolites present in fasting plasma as well as urine samples from 769 selected nondiabetic subjects from the population-based Study of Health in Pomerania (SHIP)-TREND. By means of statistical mediation analyses, we were able to distinguish between those molecular signatures assignable to the classic hallmarks accompanying hepatic steatosis and putative novel ones.
Methods
Study population
SHIP-TREND is a population-based study conducted in West Pomerania, a rural region in northeast Germany; detailed descriptions of the sampling procedure and the study population can be found elsewhere (21). In total, 4420 subjects chose to participate (50.1% response). All participants gave written informed consent before taking part in the study. The study was approved by the ethics committee of the University of Greifswald and conformed to the principles of the Declaration of Helsinki. SHIP data are publicly available for scientific and quality control purposes by application at www.community-medicine.de.
For a subsample of 1000 subjects, plasma as well as urine metabolome data based on mass spectrometry (MS) and nuclear magnetic resonance spectroscopy (NMR) were available. Of these, 203 patients had to be excluded because of missing exposure or confounder data. Two participants were excluded because of a reported history of liver disease, and 28 were excluded because of diagnosed diabetes. Finally, a total sample of 769 subjects was included in the analyses. Figure 1 summarizes the sample compilation and statistical analyses.
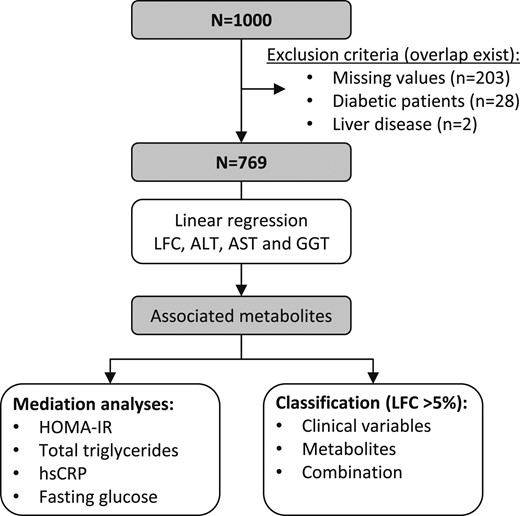
Flowchart of the procedures for the analyses. ALT, alanine aminotransferase; AST, aspartate aminotransferase; GGT, γ-glutamyl transpeptidase; HOMA-IR, homeostatic model assessment of insulin resistance; hsCRP, high-sensitivity C-reactive protein.
Participants’ characteristics and medical histories were recorded using computer-aided personal interviews. Smoking status was categorized as current, former, or never smoker. Daily alcohol consumption was calculated using beverage-specific pure ethanol volume proportions averaged across 30 days before the interview. Subjects exercising for at least 2 hours a week were classified as physically active. Waist circumference was measured midway between the lower rib margin and the iliac crest in the horizontal plane. Body mass index (BMI) was calculated as weight (kg) / height2 (m2).
Standard laboratory assays
Fasting blood samples (≥8 hours) were collected between 6:00 am and 12:00 pm from the cubital vein of subjects in the supine position and were analyzed immediately or stored at −80°C in the Integrated Research Biobank (Liconic, Liechtenstein). Serum cystatin C, lipids [total cholesterol, high-density lipoprotein (HDL), and low-density lipoprotein (LDL) cholesterol, and TGs], high-sensitivity C-reactive protein (hsCRP), albumin, and serum activities of alanine aminotransferase (ALT), aspartate aminotransferase (AST), and γ-glutamyl transpeptidase (GGT) were measured by standard methods (Dimension VISTA; Siemens Healthcare Diagnostics, Eschborn, Germany). Plasma insulin levels were measured (Centaur XP; Siemens Healthcare Diagnostics), and the homeostatic model assessment of insulin resistance (HOMA-IR) index was calculated as insulin (μU/mL) × glucose (mmol/L)/22.5 (22). We calculated the AST/ALT ratio, the NAFLD-score (23), and the FIB4-score (24) to include surrogates of liver fibrosis. Cystatin C‒based estimated glomerular filtration rate was calculated using the CKD-EPI equation (25).
MRI examinations were performed on a 1.5-Tesla MR system (Magnetom Avanto; Siemens Healthcare; software version Syngo MR B15) using a body phased-array coil. Assessment of LFC was performed using calculation of the proton density fat fraction according to chemical shift‒encoded MRI as previously described in detail (26).
Metabolome analyses
A detailed description of all applied measurement techniques is given in the Supplemental Material. Briefly, four different approaches were combined: (1) nontargeted MS-based profiling of plasma and urine samples as reported previously (27), (2) targeted MS-based profiling of plasma samples using the AbsoluteIDQ p180 Kit (BIOCRATES LifeSciences AG, Innsbruck, Austria), (3) NMR-based profiling of urine samples as reported previously (28), and (4) NMR-based profiling of plasma samples to derive lipoprotein particles.
After quality control and preprocessing (see Supplemental Material), 613 plasma (Supplemental Table 1) and 587 urine (Supplemental Table 2) metabolites were available for statistical analyses. Note that some of these could not be unambiguously assigned to a chemical identity and are referred to hereafter with the notation “X” followed by a unique number. Data on lipoprotein particles comprise 117 measures describing the gradient from very-low-density lipoprotein (VLDL) particles to HDL particles, including their TG, cholesterol, free cholesterol, and phospholipid as well as apolipoprotein (Apo) B, Apo-A1, and Apo-A2 content.
Statistical analysis
Linear regression models were performed to assess the associations of LFC as well as serum activities of ALT, AST, and GGT (independent variables) with plasma (including lipoprotein particles) and urine metabolites (dependent variables). To fulfill requirements of linear regression, ALT, AST, LFC, and metabolite levels were log-transformed. Serum activities of GGT were transformed to −1/GGT. All models were adjusted for age, sex, BMI, alcohol consumption, and physical activity. Of note, we combined men and women in the present analyses, as no strong evidence for an interaction between sex and one of the liver traits became obvious. The same analyses were done for the fibrosis scores. In a second step, a possible mediation of significant associations by HOMA-IR, serum glucose, total TGs (not for lipoproteins), and hsCRP was performed. Analyses were implemented using the R package mediate to obtain bootstrap P values (N = 2000 samples) for the mediation effect as well as CIs for the proportion mediated. We defined a significant mediation when the P value was <0.01 and at least 10% of the association was mediated through one of the four variables. Sensitivity analyses were done by excluding subjects reporting heavy drinking (n = 53; men >30 g/d and women >20 g/d). To combine the metabolome data with lipoproteins, linear regression models were run with the lipoprotein as exposure and the metabolite as outcome controlling for age, sex, and BMI. To account for multiple testing, we adjusted the P values from regression analyses by controlling the false discovery rate at 5% using the Benjamini-Hochberg procedure.
Integration of multifluid data was achieved by computation of metabolic networks using Gaussian graphical modeling. The procedure is outlined in the Supplemental Material.
A signature predictive for hepatic steatosis (LFC > 5%) using least absolute shrinkage and selection operator for variable selection was compiled. Use of a two-stage cross-validation procedure allowed us to test the robustness of selected features across random subsets of the population as well as to assess the generalizability of the results (see Supplemental Material). Briefly, a score was calculated by counting each time a feature survived the feature selection using the least absolute shrinkage and selection operator in the test set and weighted by the discriminative ability (area under the ROC curve) on the independent validation set. The score could be seen as the mean discriminative ability of the final sparse model to predict the presence of hepatic steatosis if the specific variable was included. Three types of variable setups were used to perform this classification: first, considering only clinical variables as presented in Table 1; second, only metabolites significantly associated with LFC; and third, a combination of both. Finally, three sparse logistic regression models were built to predict hepatic steatosis. The latter ones were further assessed for generalization in a Monte Carlo cross-validation procedure. Statistical analyses were done using R 3.3.2 (R Foundation for Statistical Computing, Vienna, Austria).
General Characteristics of the Study Population
| Characteristic | Whole Sample (n = 769) | Liver Fat Content <5% (n = 502) | Liver Fat Content ≥5% (n = 267) | P Value a |
|---|---|---|---|---|
| Age, y | 51 (41; 61) | 47 (38; 57) | 57 (48; 64) | <0.01 |
| Females, % | 56.0 | 62.3 | 44.2 | <0.01 |
| Smoking, % | <0.01 | |||
| Never smoker | 42.1 | 44.0 | 38.6 | |
| Former smoker | 36.4 | 31.6 | 45.3 | |
| Current smoker | 21.4 | 24.3 | 16.1 | |
| Physically active, % | 73.6 | 73.7 | 73.4 | 0.99 |
| Alcohol consumption, g/d | 4.03 (1.30; 10.36) | 3.70 (1.14; 8.65) | 4.91 (1.40; 14.69) | <0.01 |
| Waist circumference, cm | 86 (78; 96) | 82 (74; 89) | 97 (88; 105) | <0.01 |
| Body mass index, kg/m2 | 26.7 (23.9; 29.6) | 25.3 (22.9; 27.8) | 29.5 (27.2; 32.4) | <0.01 |
| Glucose, mmol/L | 5.3 (4.9; 5.7) | 5.2 (4.9; 5.5) | 5.5 (5.1; 6.0) | <0.01 |
| HOMA-IR | 2.04 (1.41; 3.20) | 1.68 (1.22; 2.33) | 3.33 (2.28; 4.90) | <0.01 |
| Insulin, mU/L | 8.6 (6.0; 12.9) | 7.2 (5.4; 10.0) | 13.5 (9.8; 18.4) | <0.01 |
| Triglycerides, mmol/L | 1.21 (0.86; 1.70) | 1.04 (0.76; 1.41) | 1.56 (1.17; 2.12) | <0.01 |
| LDL cholesterol, mmol/L | 3.36 (2.76; 3.98) | 3.24 (2.63; 3.83) | 3.60 (3.04; 4.11) | <0.01 |
| HDL cholesterol, mmol/L | 1.44 (1.22; 1.72) | 1.53 (1.30; 1.78) | 1.30 (1.11; 1.55) | <0.01 |
| Total cholesterol, mmol/L | 5.4 (4.8; 6.2) | 5.3 (4.7; 6.1) | 5.6 (4.9; 6.3) | <0.01 |
| hsCRP, mg/L | 1.13 (0.61; 2.21) | 0.94 (0.54; 1.77) | 1.55 (0.90; 2.91) | <0.01 |
| Liver fat content, % | 3.43 (2.16; 6.59) | 2.45 (1.89; 3.35) | 9.2 (6.4; 14.9) | — |
| Hepatic steatosis,b % | 34.7 | 0 | 100 | — |
| ALT, µkatal/L | 0.37 (0.27; 0.52) | 0.32 (0.25; 0.43) | 0.49 (0.37; 0.67) | <0.01 |
| AST, µkatal/L | 0.29 (0.23; 0.36) | 0.27 (0.21; 0.33) | 0.33 (0.27; 0.41) | <0.01 |
| GGT, µkatal/L | 0.48 (0.38; 0.66) | 0.43 (0.36; 0.56) | 0.62 (0.48; 0.88) | <0.01 |
| AST/ALT | 0.74 (0.59; 0.94) | 0.80 (0.64; 1.00) | 0.66 (0.53; 0.79) | <0.01 |
| NAFLD score | −2.11 (−2.86; −1.34) | −2.38 (−3.03; −1.58) | −1.62 (−2.29; −0.89) | <0.01 |
| FIB4 score | 0.81 (0.56; 1.08) | 0.76 (0.51; 1.02) | 0.90 (0.67; 1.19) | <0.01 |
| eGFRcys, mL/min/1.72 m2 | 114 (105; 122) | 117 (108; 124) | 109 (100; 118) | <0.01 |
Continuous data are expressed as median (25th percentile; 75th percentile); nominal data are given as percentages.
Abbreviation: eGFRcys, estimated glomerular filtration rate based on cystatin C measurement.
χ2 test (nominal data) or Mann-Whitney U test (interval data) was performed to test for difference by liver fat content.
Defined as liver fat content > 5%.
Results
General characteristics of the study population are displayed in Table 1. Briefly, 34.7% of the participants presented with hepatic steatosis. These participants were characterized by an adverse metabolic profile, comprising higher concentrations of glycemic parameters (e.g., fasting glucose or HOMA-IR), higher LDL cholesterol and lower HDL cholesterol concentrations, and higher hsCRP concentrations, as well as higher serum activities of liver enzymes and higher fibrosis scores (with the exception of the AST/ALT ratio).
Lipoprotein particles and mediation by HOMA-IR
An atherogenic lipoprotein particle profile was associated with LFC in linear regression analyses (Fig. 2). In detail, LFC was positively associated with total TG levels, as well as with VLDL and small LDL particles. In contrast, LFC associated inversely with large LDL particle and HDL particle measures. ALT, AST, and, GGT serum activities partially mirrored these associations but with less-pronounced association strengths. Small HDL particles were uniquely positively associated with ALT, GGT, or AST activity.
![Color-coded corrected P values [controlling the false discovery rate (FDR) at 0.05; dashed lines] from linear regression analyses using LFC, ALT, AST, and GGT as explanatory variables and lipoprotein particles as outcome. Models were adjusted for age, sex, BMI, smoking, alcohol consumption, and physical activity. Orange shadings indicate positive associations, whereas blue shadings indicate the opposite direction. Hatched boxes indicate mediation of the association by at least one of the following measures: insulin resistance (HOMA-IR), hsCRP, or serum glucose. IDL, intermediate-density lipoprotein.](https://oup.silverchair-cdn.com/oup/backfile/Content_public/Journal/jcem/103/10/10.1210_jc.2018-00999/1/m_jc.2018-00999f2.jpeg?Expires=1750187921&Signature=vfEN07gKX7bhUkRXc8NN1LuD3YJsZ9p9Xtv9jVlIpFQEWf33hbVTYYAFg6P9zJuN1toQqGlFEfzEpG0DeFLX3Jqiu3ai1TefjFjDPe2-Ge9~RZ2xGVh0~DOx7nHwcxzAY4ulsk69dXtudX~ruX84rVED3L5UThh4QvCa1uDWRfUp2sggb9X-dMD6TIAGWI2ClSQRHqAdUmE0Fv~TdDVh1yiyWzlkfCKRfpezEMu5bNezOz860oBPBB9Nb45mGRgIxMyZoMs5LYA9wwc2x3TY15y7F8GqmHVqeMHA72aSz1HSHWNXBloEuXTYN76LK5dK2Qab0ZcnxT1JoiwfYLKxxg__&Key-Pair-Id=APKAIE5G5CRDK6RD3PGA)
Color-coded corrected P values [controlling the false discovery rate (FDR) at 0.05; dashed lines] from linear regression analyses using LFC, ALT, AST, and GGT as explanatory variables and lipoprotein particles as outcome. Models were adjusted for age, sex, BMI, smoking, alcohol consumption, and physical activity. Orange shadings indicate positive associations, whereas blue shadings indicate the opposite direction. Hatched boxes indicate mediation of the association by at least one of the following measures: insulin resistance (HOMA-IR), hsCRP, or serum glucose. IDL, intermediate-density lipoprotein.
The vast majority of the associations with respect to LFC, ALT, and GGT were mediated by HOMA-IR (Fig. 2; Supplemental Table 3). The highest proportion of mediation was observed for LDL2, LDL3, and large VLDL particle measures (all >50%). The associations between LFC and large LDL particles as well as those between ALT and small-dense HDL particles were unaffected.
Small molecules and mediation by HOMA-IR and total TGs
Linear regression analyses revealed that 179 and 103 metabolites in plasma and urine, respectively, were associated with at least one of the measures of liver function (Fig. 3A; Supplemental Tables 4 and 5). LFC was the most prominent trait, with 129 and 93 significantly associated metabolites in plasma and urine, respectively.
![(A) Corrected P values [controlling the false discovery rate (FDR) at 0.05; dashed lines] from linear regression analyses using LFC (orange), ALT (purple), AST (green), or GGT (blue) as explanatory variables and plasma (upper panel) or urine metabolites (lower panel) as outcome. Results were separated by association direction: positive (β > 0) or negative (β < 0). Corresponding β estimates and FDR values are given in Supplemental Tables 1 and 2. Metabolites marked with a triangle exceeded the plotting range. (B) Box plots for the estimated proportion mediated between the exposure and metabolites by serum glucose, hsCRP, a measure of insulin resistance (HOMA-IR), and total TGs. (C) Color-coded FDR values from linear regression analyses using LFC, ALT, AST, or GGT as explanatory variables and plasma or urine metabolites as outcome, limited to nonmediated metabolites. Significant associations (FDR < 0.05) are framed black. Orange shading indicates positive associations, and blue shading indicates negative associations. Hatched boxes indicate mediation of the association by at least one of the following measures: insulin resistance (HOMA-IR), total TGs, hsCRP, or serum glucose. *Metabolites were annotated based on in silico prediction.](https://oup.silverchair-cdn.com/oup/backfile/Content_public/Journal/jcem/103/10/10.1210_jc.2018-00999/1/m_jc.2018-00999f3.jpeg?Expires=1750187921&Signature=DQIF1iGaDQqjjq2zygry6bGIRiGt2wXLdFXsW48ynvTJyBzxy7dywQXKpwZSo~rcSubf2GUviQ1uNNQ9jMEG1wfjViKGvhsJVy-FhvrVTb3gbE9x99CLyjANPadNP2lDCRmOw~xaYP~fMO~o-JP~BqTIGfpsqrq99jYsB0MIIrOSkdezz~Ck2fyN9qu5mbAJU8x94i4Zp9g2VcX~GMLMANnmTNArThHZL6mccmHBoHVc~mD6fLlP2o3FFDQPMF3-Sg34VwbUw7QWEjrSQouhCCyu6UVeKVvupC7dnhtfQDgFXvzk-4RaBN00CUik9zWw8GK0n5wD-T0o6G1MrVQN4g__&Key-Pair-Id=APKAIE5G5CRDK6RD3PGA)
(A) Corrected P values [controlling the false discovery rate (FDR) at 0.05; dashed lines] from linear regression analyses using LFC (orange), ALT (purple), AST (green), or GGT (blue) as explanatory variables and plasma (upper panel) or urine metabolites (lower panel) as outcome. Results were separated by association direction: positive (β > 0) or negative (β < 0). Corresponding β estimates and FDR values are given in Supplemental Tables 1 and 2. Metabolites marked with a triangle exceeded the plotting range. (B) Box plots for the estimated proportion mediated between the exposure and metabolites by serum glucose, hsCRP, a measure of insulin resistance (HOMA-IR), and total TGs. (C) Color-coded FDR values from linear regression analyses using LFC, ALT, AST, or GGT as explanatory variables and plasma or urine metabolites as outcome, limited to nonmediated metabolites. Significant associations (FDR < 0.05) are framed black. Orange shading indicates positive associations, and blue shading indicates negative associations. Hatched boxes indicate mediation of the association by at least one of the following measures: insulin resistance (HOMA-IR), total TGs, hsCRP, or serum glucose. *Metabolites were annotated based on in silico prediction.
Approximately half of the associations in plasma (N = 79) and about one-third of those in urine (N = 26) were at least partially mediated, thereby making total TGs and HOMA-IR the most important mediators (Fig. 3B).
With respect to plasma, total TGs accounted in part for positive associations between LFC and lipid species (e.g., lysolipids and diacyl PCs) as well as inverse associations with sphingolipids or serine. Positive associations between LFC and branched-chain amino acid (BCAA) catabolites (e.g., 3-methyl-2-oxobutyrate), alanine, or carbohydrates as well as the inverse association with sphingolipids or glycine were mediated by HOMA-IR. The inverse association between LFC and lysoPC C18:2 was mediated by HOMA-IR and hsCRP. Similar mediations became apparent with respect to ALT and GGT, whereas associations with AST were far less affected (Fig. 3; Supplemental Table 6).
The positive association between LFC/ALT and urine 3-sialyllactose was affected by all mediators to a degree of up to 53%. Similar strong mediating effects in urine were noted for the unknown X-02249 (inversely with LFC) and X-17340, tetrahydrocortisone, or alanine (positively with LFC).
After mediated associations were discarded, only plasma xanthine levels remained significantly positively associated with all traits. However, even plasma levels of adrenate, docosapentaenoate, γ-glutamylleucine, and γ-glutamylphenylalanine were positively associated with all traits but were slightly mediated (maximum, 15%) by serum glucose (LFC) or HOMA-IR (ALT).
Metabolic fingerprint of LFC
The largest number of nonmediated associations remained for LFC with a comparable amount of significantly associated metabolites in plasma (N = 58) and urine (N = 68) (Fig. 3C). In plasma, two prominent metabolite signatures were detected: (1) decreased levels of ether-PCs (hereafter referred to as PC ae CXX:Y) and (2) increased levels of BCAAs and aromatic amino acids as well as dipeptide derivatives (Fig. 2). Inverse associations with LFC were restricted to these lipid species, with the additional exceptions of 3-phenylpropionate, stachydrine, and some unknown compounds. Further positive associations with LFC were detected for the levels of proline, tryptophan, indoleacetate, urate, piperine, and 7-α-hydroxy-3-oxo-4-cholestenoate (Supplemental Table 3).
Associations with urine metabolites were almost exclusively detected for LFC (Fig. 3C). In line with the increased plasma levels mentioned previously, the urine levels of BCAA derivatives as well as lactate were also positively associated with LFC. In contrast, several glycine conjugates, such as isovalerylglycine and isobutyrylglycine as well as γ-glutamylthreonine, exhibited an inverse association (Supplemental Table 2). In addition, LFC was inversely associated with the urine levels of several xenobiotic species (e.g., 4-vinylphenol sulfate, hippurate, and cinnamoylglycine). Almost one-third of the LFC-associated metabolites in urine were of unknown identity.
Metabolite associations with serum markers of hepatic damage
Only a few plasma metabolites were associated solely with one of the liver enzymes but not with LFC. Briefly, serum AST activities were positively associated with several acylcarnitine species and monounsaturated fatty acids. ALT was uniquely positively associated with two ether-PCs (PC ae C36:0 and PC ae C38:6). Inverse associations with 2-aminoheptanoate and citrate were specific for GGT. Only a few weak metabolite associations with liver enzyme serum activities were observed in urine (Fig. 3C).
Fibrosis scores and exclusion of heavy drinkers
Similarities between the NAFLD and the FIB4 scores with LFC were restricted to inverse associations with large LDL particle measures (Supplemental Fig. 2). In general, both scores were associated with lower concentrations of almost all LDL measures. Compared with LFC, only a few metabolites in plasma (Supplemental Fig. 3) or urine (Supplemental Fig. 4) were associated with either the NAFLD or the FIB4 score, partially being residual from either ALT or AST.
The exclusion of participants who reported heavy drinking changed the strength of the associations between traits under investigation and lipoproteins or metabolites only minimally (Supplemental Figs. 5 and 6). Only associations between AST and lipoprotein measures changed markedly.
Interrelation between lipoproteins and lipid species
Supplemental Fig. 1 depicts the pairwise associations between lipoprotein measures and lipid species using linear regression analysis. Only lipoproteins and lipid species significantly associated with LFC were considered. Briefly, strong positive associations became obvious between ether-PCs and large LDL particles as well as small, dense HDL particles. The TG content of small VLDL particles (VLDL6) was positively associated with various free fatty acid species.
A metabolite signature with predictive value for hepatic steatosis
Our procedure for classifying hepatic steatosis (LFC > 5%) exclusively on the basis of metabolites performed comparably to that of clinical variables (ROC‒area under the curve, ∼0.89) (Fig. 4;Table 2). A combined feature selection approach using metabolome and clinical data led to a moderate but significant improvement in the ROC‒area under the curve (P = 0.002) from 0.89 to 0.91 (Fig. 4). These results were confirmed using a Monte Carlo cross-validation procedure (Supplemental Fig. 8). Even the net reclassification index improved significantly (0.62; 95% CI: 0.47 to 0.76; P < 0.001). Urine levels of X-20643, X-12407, and uracil as well as plasma levels of glycine were associated with decreased odds for hepatic steatosis, whereas HOMA-IR, age, waist circumference, ALT serum activities, and hsCRP levels were associated with increased odds (Table 2).
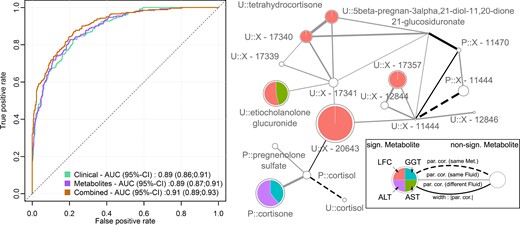
(Left panel) ROC curves and AUC with 95% CIs for the three different models to predict fatty liver disease: clinical variables, green; metabolites, purple; combination of both, orange. (Right panel) Subnetwork of the derived GGM with emphasis on the unknown urinary predictors X-20643 and X-16774. On each node, the results from linear regression analysis for LFC (orange), serum ALT (purple), AST (green), and GGT (blue) were mapped as portions of the association strength given as −log10(FDR value). Significant results in at least one trait, FDR below 5%, are highlighted by colors. Node sizes were chosen as maximum association strength of the single traits. The prefix P denotes plasma metabolites, whereas U indicates urine metabolites. Edges represent significant partial correlations (par. cor.) between metabolites. Type and color represent metabolite and fluid dependencies. Solid lines indicate significant partial correlations between distinct metabolites, whereas dashed lines indicate a connection between the same metabolite in plasma and urine. Line widths correspond to the strength of partial correlation, and colors indicate connections within one fluid (gray) or across fluids (black). AUC, area under the curve; FDR, false discovery rate; GGM, Gaussian graphical modeling; Met., metabolite; sign., significant.
Summary of Predictors Selected in at Least One-Third of the Loops in the Classification Scheme for Fatty Liver Disease
| Clinical Traits | Metabolites | Combined | |||||||||
|---|---|---|---|---|---|---|---|---|---|---|---|
| Variable | Score | OR (95% CI) | Selected | Variable | Score | OR (95% CI) | Selected | Variable | Score | OR (95% CI) | Selected |
| ALT | 0.87 | 2.79 (2.31, 3.40) | 30 | P::Glycine | 0.86 | 0.65 (0.55, 0.76) | 30 | HOMA-IR | 0.88 | 4.38 (3.48, 5.60) | 30 |
| HOMA-IR | 0.87 | 4.38 (3.48, 5.60) | 30 | U::X-20643 | 0.80 | 0.58 (0.49, 0.68) | 28 | U::X-20643 | 0.88 | 0.58 (0.49, 0.68) | 30 |
| Waist circumference | 0.84 | 4.58 (3.66, 5.83) | 29 | P::Butyrylcarnitine | 0.75 | 2.27 (1.89, 2.76) | 26 | Waist circumference | 0.85 | 4.58 (3.66, 5.83) | 29 |
| Age | 0.67 | 2.04 (1.72, 2.43) | 23 | P::Tyrosine | 0.72 | 2.69 (2.20, 3.32) | 25 | ALT | 0.76 | 2.79 (2.31, 3.40) | 26 |
| Total TGs | 0.64 | 2.90 (2.39, 3.57) | 22 | U::X-15472 | 0.66 | 2.33 (1.95, 2.81) | 23 | Age | 0.73 | 2.04 (1.72, 2.43) | 25 |
| hsCRP | 0.61 | 1.75 (1.49, 2.07) | 21 | U::Uracil | 0.66 | 0.60 (0.51, 0.71) | 23 | P::Glycine | 0.68 | 0.65 (0.55, 0.76) | 23 |
| Alcohol intake | 0.47 | 1.36 (1.17, 1.58) | 16 | U::X-16774 | 0.58 | 2.33 (1.94; 2.82) | 20 | U::X-12407 | 0.56 | 0.80 (0.68, 0.93) | 19 |
| P::LysoPC a C18:2 | 0.58 | 0.65 (0.55, 0.76) | 20 | U::Uracil | 0.56 | 0.60 (0.51, 0.71) | 19 | ||||
| P::PC ae C42:5 | 0.55 | 0.54 (0.45, 0.63) | 19 | hsCRP | 0.53 | 1.75 (1.49, 2.07) | 18 | ||||
| P::Glutamate | 0.49 | 2.54 (2.10, 3.10) | 17 | P::Butyrylcarnitine | 0.44 | 2.27 (1.89, 2.76) | 15 | ||||
| P::γ-Glutamylphenylalanine | 0.46 | 2.62 (2.17, 3.20) | 16 | P::PC aa C32:1 | 0.41 | 1.55 (1.32, 1.82) | 14 | ||||
| P::PC aa C32:1 | 0.40 | 1.55 (1.32, 1.82) | 14 | P::PC ae C42:5 | 0.35 | 0.54 (0.45, 0.63) | 12 | ||||
| P::PC aa C40:6 | 0.40 | 1.59 (1.36, 1.88) | 14 | U::X-16581 | 0.30 | 0.71 (0.61, 0.83) | 10 | ||||
| U::X-16581 | 0.38 | 0.71 (0.61, 0.83) | 13 | P::Glutamate | 0.29 | 2.54 (2.10, 3.10) | 10 | ||||
| P::X-01911 | 0.31 | 1.98 (1.67, 2.37) | 11 | ||||||||
| P::Valine | 0.31 | 2.37 (1.97, 2.88) | 11 | ||||||||
| U::X-12407 | 0.29 | 0.80 (0.68, 0.93) | 10 | ||||||||
OR (95% CI) = crude odds ratio per SD increase for hepatic steatosis with 95% CI; Score = average area under the curve in the final classification loop in case the variable was included (see Methods); Selected = number of times the variable was selected for the final classifier (maximum = 30). Metabolites depicted in bold were used to build the final classifier. P, plasma metabolite; PC, phosphatidylcholine; U, urine metabolite.
Discussion
The current study aimed to characterize early (i.e., subclinical) molecular signatures of hepatic fat accumulation in a sample from the general population. The broad panel of detected metabolites that were associated with LFC partly reflects physiological aspects of hepatic fat accumulation apart from established comorbidities (i.e., insulin resistance, hypertriglyceridemia, or inflammation). In particular, several urine metabolites were exclusively associated with LFC. The corresponding signature, which indicates among other things altered cortisol degradation, enabled moderate improvement in the classification of hepatic steatosis.
Insulin sensitivity partially mediates an atherogenic lipoprotein profile
The most obvious hallmark of hepatic steatosis is impaired TG metabolism manifested by dyslipidemia that is likely accompanied by insulin resistance and hepatic inflammation (8). Indeed, more than half of the detected associations with lipoproteins were mediated to a significant amount by HOMA-IR. Possible responsible mechanisms include increased hepatic uptake of fatty acids, either released from adipose tissue or from remnant VLDL particles, and hepatic de novo lipogenesis ultimately increasing VLDL secretion as a consequence of peripheral insulin resistance (29). Increased availability of plasma fatty acids from remnants is further supported by our cross-metabolomics analyses linking an increase in the TG content of small (i.e., remnant) VLDL particles (VLDL6) to increased levels of a broad range of plasma fatty acids (Supplemental Fig. 1). Of note, the associations between the TG content of VLDL6 or plasma levels of monounsaturated fatty acids with LFC were not mediated by HOMA-IR. The latter nicely aligns with the recent report of an insulin-independent positive correlation between plasma levels of palmitoleate and hepatic phosphorus metabolism in metabolically healthy individuals (30).
TG-rich LDL particles are either taken up by hepatocytes via LDL receptors or further hydrolyzed by hepatic lipase, yielding small, dense LDL particles (31). Our observation of an LFC-associated decrease in large LDL particles together with an increase in small, dense LDL particles argues for a prolonged dwelling time of LDL particles in the circulation, including shrinkage by hepatic lipase activity (31), making them prone to oxidation. In line with this hypothesis, hepatic steatosis was characterized by diminished LDL-receptor expression (32). Oxidized LDL particles in turn mediate the adverse, proinflammatory setting implicated in the onset of cardiovascular disease (33). It has to be noted that the proatherogenic LDL signature was mediated by HOMA-IR (Fig. 2). In contrast, the inverse association between LFC and large LDL particles (LDL1) was independent of HOMA-IR and therefore might represent an early event in the adverse relation between hepatic steatosis, insulin resistance, and cardiovascular disease. Of note, the same mechanism likely accounts for the inverse associations between LFC and ether-PCs, as both strongly associate (Supplemental Fig. 1) and PCs are integral for the monolayer surrounding lipoprotein particles. This observation emphasizes the particular value of multiplatform metabolomics approaches to contextualize findings.
Altered small, dense HDL composition as a hint toward progression to steatohepatitis
The transition from hepatic steatosis to steatohepatitis constitutes a continuum rather than a discrete event; hence, we also identified molecular signatures described in more advanced stages of liver impairment (e.g., an accumulation of PCs in the circulation) (11, 34). With respect to ALT activities but not LFC, our results partially confirmed these observations, and our multiplatform metabolomics approach once more allowed us to link these findings to lipoprotein metabolism. Briefly, we observed consistent positive associations between PCs and small, dense HDL particles (HDL3), both uniquely associated with ALT (Fig. 3). Enriched PC content of HDL particles has been shown to increase efflux of free cholesterol from scavenger receptor BI‒expressing cells (35). Because scavenger receptor BI, the HDL receptor, is highly expressed on hepatocytes, this may indicate altered reverse cholesterol transport in relation to hepatic steatosis or steatohepatitis given the unique association with elevated liver enzyme activities.
BCAA catabolites are linked by insulin sensitivity with liver fat
A frequently published link between obesity, hepatic steatosis, and impaired glucose homeostasis involves an accumulation of BCAAs and aromatic acids (36–40). Consistently, we observed a BMI-independent association with all of these amino acid species and LFC. In addition to increased proteolysis, responsible mechanisms for BCAA accumulation may include decreased catabolism in adipose tissue (41) or skeletal muscle (42) because the first step of BCAA catabolism is facilitated by branched-chain ketoacid dehydrogenase (BCKDH) in nonhepatic tissues. Accumulation of such catabolites, including 3-methyl-2-oxobutyrate, is thought to mediate the adverse effects of BCAAs (43) [e.g., suppressing pyruvate dehydrogenase activity, which catalyzes the formation of acetyl-CoA from pyruvate (44)]. Notably, a subsequent shift in pyruvate utilization toward lactate and alanine formation aligns well with our observation of positive associations between LFC and these metabolites. Further, increased activity of the BCKDH kinase, and hence diminished BCKDH activity due to hyperphosphorylation, has been shown to integrate BCAA catabolism with stimulated hepatic de novo lipogenesis as a result of phosphorylation of ATP-citrate lyase generating substrates for lipogenesis (45). Importantly, the associations with BCAA catabolites (but not primary BCAAs), lactate, and alanine were all significantly mediated by HOMA-IR (Supplemental Table 4).
In conclusion, our BMI-independent observations as well as confirmative results from previous studies (15, 46) strongly argue for hepatic (or at least ectopic) fat accumulation as a key mechanism for impaired BCAA catabolism. Although diminished BCAA metabolism seems to integrate hepatic lipogenesis, the pathophysiological event linking it to insulin resistance remains elusive; however, a solitary increase in BCAAs in plasma does not seem to be a sufficient criterion. The latter aligns with a recent study by Gaggini et al. (40), who reported less-prominent alterations in plasma BCAA concentrations among patients with hepatic steatosis without type 2 diabetes.
A signature of increased oxidative stress is a hallmark of hepatic steatosis
Surrogates of oxidative stress with respect to hepatic steatosis have been noted in several previous studies, with γ-glutamyl amino acids and glutamate [precursors of the antioxidant glutathione] being the most prominent examples (19, 40). Notably, these markers indicated progressive liver disease (i.e., fibrosis) (40). Intensified mitochondrial respiration causing accumulation of reactive oxygen species has consistently been described with liver biopsies in patients with hepatic steatosis and steatohepatitis (47). In addition to antioxidant glutathione synthesis, residual serum activity of GGT may also account for these observations, as the latter association was not attributable to any of the tested mediators. Beyond biomarker research, the application of genome-scale metabolic modeling revealed the crucial importance of the further upstream metabolites glycine and serine (48). In general, these observations align well with our findings; however, we observed in these associations a strong dependence on insulin sensitivity (i.e., these were mediated to a great extent by HOMA-IR). Interestingly, among patients with hepatic steatosis, plasma glycine concentrations strongly correlated with hepatic but not peripheral insulin resistance (40). Hence, it would be of particular interest to determine whether diminished insulin sensitivity causes (hepatic) oxidative stress or vice versa.
In contrast, the strong positive association of plasma xanthine with all liver traits not only was unaffected by HOMA-IR adjustment but also points toward an augmented defense against systemic/hepatic oxidative stress. Xanthine is an intermediate in purine degradation, ultimately resulting in the formation of urate, one of the most important antioxidants in human blood. The reaction is catalyzed by xanthine oxidase (XO), and recent cellular and mouse models (49) showed increased activity of XO in hepatic steatosis, which is supported by observational studies (50, 51). The far less-pronounced association with plasma urate compared with that of xanthine levels in the current study may be due to the oxidation of urate in a state of high oxidative stress accompanying hepatic steatosis. Subsequently, the consistently positive association with xanthine may be a surrogate for increased XO activity to provide urate as an antioxidant.
Urinary fingerprint of LFC
The significant associations between LFC and urine metabolites are of special interest for two reasons: (1) most of these urine metabolites were not associated with markers of liver injury, and (2) these associations were not mediated by total TG, HOMA-IR, fasting glucose, or hsCRP to a substantial amount. In conclusion, these relations not only represent novel pathophysiological insights but also have the potential to complement current biomarkers for hepatic steatosis. Some of the metabolites were closely related to processes already described for plasma metabolites (e.g., increased levels of BCAA catabolites or lactate as a marker for impaired glucose metabolism).
Altered phase I and phase II detoxification
Apart from this, several steroid species in urine showed an inverse association with LFC, in particular, those secreted by the adrenal cortex (e.g., dehydroepiandrosterone sulfate or etiocholanolone). Interestingly, this contrasts to some extent with the positive associations seen in plasma. Considering that most of the observed associations were related to sulfated or glucuronidated compounds, this may indicate an altered metabolism/degradation of adrenal-derived steroids. Although the relationship between glucocorticoids and hepatic steatosis has been frequently described (see the following section), data on other adrenal-derived hormones are less established. The presence of hepatic steatosis was linked with higher dehydroepiandrosterone sulfate levels among adults (52) and an altered adrenal steroid profile in urine among children (53). Diminished activity of responsible sulfotransferases in the progressively impaired liver (54) may be one plausible explanation. In general, the urine profile associated with LFC points toward a diminished detoxification capacity of the liver, not only phase II, as presented previously, but also phase I (e.g., the urinary metabolites gentisate and 5-hydroxyindoleacetate, inversely associated with LFC, represent degradation products of tyrosine and serotonin, respectively).
A molecular signature predictive for hepatic steatosis
Extensive feature selection revealed a model that allowed slightly better identification of hepatic steatosis cases compared with classical clinical measures. Notably, we designed the classification algorithm to generate a sparse set of variables comprising complementary information and hence not necessarily including all top associated metabolites/clinical features. Although this improvement may be of limited direct clinical relevance, the identified molecules may be of particular value for the discrimination of different subtypes of hepatic steatosis, as has been shown recently (20).
In addition to known risk factors such as abdominal obesity, insulin resistance, and already outlined molecular perturbations (glycine), the most consistent parameter was the unknown urinary compound X-20643, which was linked to decreased odds for hepatic steatosis. A putative annotation of the metabolite may be possible because of its direct neighboring with plasma cortisol in the derived Gaussian graphical modeling (Fig. 4) (55). On the basis of its molecular weight (∼539.4 Da), this would fit a conjugation of cortisol with glucuronic acid yielding the respective glucuronide, indicating diminished degradation of cortisol. Cortisol or more general glucocorticoid excess caused either endogenously (Cushing syndrome) or exogenously was consistently linked with the development and presence of hepatic steatosis [for review, see (56)]. Cortisol is thereby assumed to drive several hallmarks of hepatic steatosis, including increased lipogenesis and VLDL assembly (56, 57). Of note, no association between LFC and plasma cortisol levels became apparent, even with accounting for blood sampling time. In summary, altered cortisol metabolism, in particular in the liver, was a prominent independent hallmark of hepatic steatosis in the current study, and degradation intermediates of cortisol in urine may be a suitable proxy for prolonged hypercortisolism accompanying hepatic steatosis.
Strengths and limitations
The current study involved one of the most comprehensive metabolomics approaches in an epidemiological setting to address the metabolic fingerprint of liver function. The assessment of LFC using MRI thereby represents an outstanding feature. However, the absence of liver biopsies restricted the distinction of progressive liver diseases and represents a drawback of the present approach. Although hepatic steatosis was present in approximately one-third of our study population, the degree of disease was rather mild. Therefore, we could only speculate about a transfer of our findings to more severe states of liver disease. Furthermore, the cross-sectional character of the study provides only observational results and restricts functional insights on the molecular level. This fact also subsumes a possible residual confounding by obesity in linear regression analyses, even when accounting for BMI. Despite those limitations, the sample size is a clear advantage for the classification assessment because it provides by far more information about the generalizability of the achieved results than in tightly controlled experimental settings, which constitute most research conducted so far with respect to metabolomics and hepatic steatosis.
Conclusions
The present high-quality metabolomics approach among a population-based sample characterized by the absence of diabetes revealed a molecular fingerprint of hepatic steatosis characterized by complex alterations in lipid metabolism with lipoprotein particles as a key driver and augmented defense against oxidative stress, as well as adverse cortisol signaling. Impaired BCAA catabolism and accumulation of small, dense LDL particles were strongly related to diminished insulin sensitivity accompanying hepatic steatosis. From a clinical perspective, the use of urine samples to identify (or stratify) subjects with hepatic steatosis may be of particular interest, as the presented markers provide information that complements already established data.
Abbreviations:
- ALT
alanine aminotransferase
- Apo
apolipoprotein
- AST
aspartate aminotransferase
- BCAA
branched-chain amino acid
- BCKDH
branched-chain ketoacid dehydrogenase
- BMI
body mass index
- GGT
γ-glutamyl transpeptidase
- HDL
high-density lipoprotein
- HOMA-IR
homeostatic model assessment of insulin resistance
- hsCRP
high-sensitivity C-reactive protein
- LDL
low-density lipoprotein
- LFC
liver fat content
- MS
mass spectrometry
- NMR
nuclear magnetic resonance spectroscopy
- SHIP
Study of Health in Pomerania
- TG
triglyceride
- VLDL
very-low-density
- XO
xanthine oxidase
Acknowledgments
We thank Bianca Schmick from Genome Analysis Center for expert technical assistance. We thank Tim Kacprowski for thorough discussion of the classification procedure.
Financial Support: This work was funded by grants from the German Federal Ministry of Education and Research [grants 01ZZ0403, 01ZZ0103, and 01GI0883 (to H.V.) and AtheroSysMed 03IS2061B], the Ministry for Education, Research and Cultural Affairs, and the Ministry of Social Affairs of the Federal State of Mecklenburg-West Pomerania. This work is also part of the research project Greifswald Approach to Individualized Medicine (GANI_MED). The GANI_MED consortium is funded by the Federal Ministry of Education and Research and the Ministry of Cultural Affairs of the Federal State of Mecklenburg-West Pomerania (03IS2061A). Part of this study was supported by a German Center Diabetes Research (DZD e.V.) grant (to J.A.).
Disclosure Summary: The authors have nothing to disclose.
