


Abstract
Polycystic ovary syndrome (PCOS) is characterized by hyperandrogenism. In pregnancy, testosterone levels may be higher in women with PCOS compared with controls.
To compare total testosterone (TT), free testosterone (FT), and sex hormone–binding globulin (SHBG) levels in third-trimester pregnant women with PCOS and controls and to establish reference ranges for TT, FT, and SHBG in PCOS and controls.
The study was part of the prospective study, Odense Child Cohort. PCOS was diagnosed by questionnaires and/or patient records. Fasting blood samples were collected at gestational week 28 and plasma TT was measured by liquid chromatography-tandem mass spectrometry in women with PCOS (n = 145) and in women without PCOS (controls, n = 1341).
Levels of TT (mean, 2.4 vs 2.0 nmol/L) and FT (mean, 0.005 vs 0.004 nmol/L) were higher, whereas SHBG levels (mean, 447 vs 477 nmol/L) were lower in women with PCOS vs controls (all P < 0.001). Reference intervals for TT, FT, and SHBG in women with PCOS and controls were overlapping, and partitioning of reference intervals was an ambiguous decision. In multiple regression analyses, TT and FT levels were positively associated with PCOS status and BMI and inversely associated with age and parity. Offspring sex did not predict maternal TT and FT.
TT and FT levels were higher in third-trimester pregnant women with PCOS compared with controls. Separate reference interval for FT in women with PCOS should be considered.
Polycystic ovary syndrome (PCOS) is the most common endocrine disorder in reproductive-aged women, with prevalence around 10% to 15% (1). PCOS is usually diagnosed by the 2003 European Society for Human Reproduction and Embryology Rotterdam criteria (2) requiring two of the following: (1) clinical or biochemical evidence of androgen excess, (2) oligomenorrhea or amenorrhea, or (3) polycystic ovaries. Androgen excess is a key feature of PCOS and is present in ∼70% of diagnosed women (1, 2). More than 80% of women presenting with hirsutism have PCOS (3, 4). Assessment of biochemical androgen excess in women includes measurement of total testosterone (TT), sex hormone–binding globulin (SHBG), and calculation of free testosterone (FT) or free androgen index (5). Precise measurement of TT requires use of high-quality assays (5, 6). Body mass index (BMI) is inversely associated with SHBG and is positively associated with higher FT (7), whereas TT and FT levels in women with PCOS decrease with age (8, 9).
During pregnancy, important changes occur in maternal circulating concentrations of TT, FT, and SHBG (10, 11). After the ninth week of gestation, high levels of estrogen are produced by the placenta. Estrogen stimulates SHBG production and SHBG levels remain 5- to 10-fold increased throughout pregnancy (10, 12). During normal pregnancy, elevated estrogen and SHBG levels were positively associated with increased levels of TT (10–12). The balance between SHBG and TT resulted in circulating FT levels within the nonpregnant range until the third trimester (11). However, FT levels increased significantly during the third trimester (11). In pregnant women with PCOS, circulating levels of TT and FT may be higher compared with controls (13, 14). To our knowledge, only one study reported tandem mass spectrometry (MS/MS)-derived TT reference ranges in pregnant women (15). However, only TT data for the first and second trimesters were presented, and PCOS status of included women was not reported (15). We are not aware of previous papers on reference ranges for FT and SHBG in women with PCOS and controls.
In the current study, we measured third-trimester maternal TT and SHBG levels and calculated FT in pregnant women with and without PCOS and calculated reference ranges for TT, FT, and SHBG. We hypothesized that women with PCOS could have higher levels of testosterone compared with controls in their third trimester, and we tested the hypothesis that separate reference intervals (partitioning) for TT, FT, and SHBG should be recommended in women with PCOS and controls.
Population and Method
This study was part of Odense Child Cohort (OCC) (16). OCC is a joint research project in which pregnant women within the Municipality of Odense, Denmark, were recruited between 1 January 2010 and 31 December 2012. Of 6707 pregnancies, 4017 women received information about the study cohort, and 2874 pregnant women were included in OCC (Fig. 1). Women had to give additional consent to attend for fasting blood samples around gestation week 25. After excluding multiple pregnancies (n = 56), fasting blood samples on androgen status were available in 1526 of 2818 women. Seventeen women were pregnant more than once within the inclusion period (only the first pregnancy was included in dataset) and 20 women were excluded because of unknown PCOS status (Fig. 1). Three women in the control group were excluded because of high TT levels (14.6, 14.9, and 25.7 nmol/L). No cause of high TT was found by review of the analytical method or patient records. The remaining 1486 women were included in the study (145 PCOS and 1341 controls).
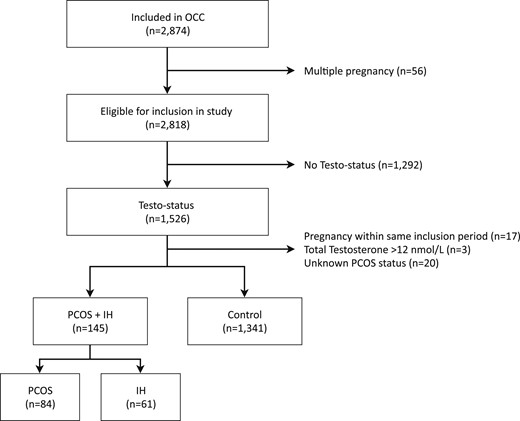
Flowchart of study population in OCC. IH, idiopathic hirsutism.
PCOS status
PCOS was defined according to the Rotterdam criteria (2). Data on PCOS diagnosis and hirsutism before pregnancy were collected from a detailed electronic questionnaire on the mothers’ health during the second trimester (17). Women were classified with PCOS if they replied yes to the question “has a doctor ever told you that you have PCOS?” or they reported both facial hair and oligomenorrhea (menstrual cycles ≥35 days). A unique ultrasound diagnosis of polycystic ovary did not qualify for a PCOS diagnosis. Women with self-reported facial hirsutism and regular menses were included (n = 61) in the PCOS cohort because ∼80% of women presenting with hirsutism have PCOS (4). Some of the women with self-reported facial hirsutism could have idiopathic hirsutism (IH); therefore, we repeated calculations after excluding these women from the patient cohort (sensitivity analysis) (18). Data on PCOS status in questionnaire nonresponders were extracted from medical records. Cohort staff was unaware of maternal PCOS diagnosis, and PCOS diagnosis did not affect follow-up during pregnancy. The control population included women with regular menstrual cycle (<35 days) before conception and no signs of androgen excess (hirsutism and/or acne).
Covariates
Age, prepregnancy BMI, parity, and smoking status were obtained from patient records using social security numbers.
Gestational diabetes (GDM)
Gestational diabetes mellitus (GDM) was defined as a 2-hour capillary glucose ≥9.0 mmol/L according to Danish guidelines for antenatal care (19). GDM diagnosed at gestation weeks 14 through 20 was obtained by chart review. Women with risk factors for GDM were offered a diagnostic oral glucose tolerance test (75 g glucose) at gestational age 28 through 30 weeks. Risk factors for GDM included BMI ≥27 kg/m2, family history of diabetes mellitus, glucosuria during pregnancy, previous GDM, or previous delivery of a macrocosmic child (19). For each woman undergoing an oral glucose tolerance test by indication, one random woman without GDM risk factors from OCC was offered an oral glucose tolerance test.
Depression
Information of a hospital diagnosis of depression was obtained by International Statistical Classification of Diseases and Related Health Problems 10th revision codes from the National Patient Register. The diagnosis of depression should occur within pregnancy to be included.
Assays
Morning, fasting maternal venous samples were taken around the 27th to 28th week of gestation, centrifuged for 10 minutes at 3000 revolutions/min, and stored at −20°C degrees. Samples were analyzed for TT using liquid chromatography-MS/MS (LC-MS/MS). Plasma samples were extracted by supported liquid extraction and the eluate was evaporated and reconstituted before analysis. The LC-MS/MS analysis was calibrated by in-house prepared calibrators and the relative SD was <10%. Quality was assured by monthly participation in the external quality control program for steroid hormones from The United Kingdom National External Quality Assessment Service (NEQAS, UK). SHBG was determined on serum samples by a Roche assay on Cobas e602 (Indianapolis, IN) with a precision of 1.8% to 4.0% (14.9 to 21.9 nmol/L). FT levels were calculated using the Vermeulen Equation (20) assuming a plasma albumin concentration of 42 g/L. Albumin concentrations are generally lower during pregnancy (21), and calculations of FT were repeated with assumption of plasma albumin 32.5 g/L.
Ethical approval
The study was performed in accordance with the Helsinki Declaration II and approved by the Regional Ethical Review Committee (Project ID S-20090130) and the Danish Data Protection Agency (j.no. 18/15692) (16). All participants received written and oral information and provided their written consent for participation (16).
Statistical analysis
Baseline characteristics were reported as mean (±SD) or percentages (n). The normality of data was evaluated using histograms and Skewness/Kurtosis test. TT and FT data were normalized by natural logarithm (ln) transformation, whereas SHBG data were normally distributed. Reference intervals for TT and FT were established using the antiln of mean ± 1.96 SD on ln-transformed data.
For each reference interval (TT, FT, and SHBG), potential partitioning according to PCOS status (PCOS and controls) was assessed using the method proposed by Lahti et al. (22). Partitioning was used to determine if separate reference intervals should be recommended in women with PCOS regarding TT, FT, and SHBG (partitioning recommended) or women with PCOS were part of the reference intervals for controls (partitioning not recommended). If the decision to partition was not clear (ambiguous), we discussed if nonpartitioning could lead to overdiagnosis of elevated testosterone levels during pregnancy. When data were normalized, the ratio between SD in women with PCOS and controls was determined (larger SD divided by smaller SD). If this ratio, R, was >1.5, partitioning was recommended. If R was ≤1.5, then the difference between upper and lower reference limits in women with PCOS and controls (Δ) was calculated, and the SD of the narrower subgroup (PCOS or controls) was used as a scale unit (Δ/SD). If Δ/SD was ≥0.75 for either upper or lower reference limits or both, partitioning was recommended; if Δ/SD was 0.25 to 0.75 for either upper or lower reference limits or both and neither was ≥0.75, partitioning was an ambiguous decision; and if Δ/SD was <0.25 for both upper and lower reference limits, partitioning was not relevant.
The fraction of women with PCOS and controls with TT, FT, and SHBG results above the upper limit in controls was calculated. Finally, linear regression models were performed with ln-transformed values of TT and FT as the dependant variable and PCOS/control status as the independent variable and age, BMI, parity, offspring sex, and smoking as covariates. The assumptions underlying multiple linear regression modeling were checked and accepted. Normality and homoscedasticity of residuals in models were inspected graphically, and multicollinearity was checked formally.
Levels of TT, FT, and SHBG could be affected by a diagnosis of GDM, applied criteria for PCOS, and a diagnosis of depression. Therefore, we performed three sensitivity analyses, where we omitted the following individuals (PCOS and controls): (1) women diagnosed with GDM, (2) women with hirsutism and no information of menstrual cycles and ultrasound (possible IH), and (3) women with a diagnosis of depression during pregnancy until testosterone assessment.
All data were analyzed using STATA/IC (version 15.1, StataCorp LP). A P value <0.05 was considered significant.
Results
Baseline characteristics of pregnant women with PCOS+IH vs controls are shown in Table 1. Women with PCOS+IH and controls were comparable regarding BMI, age, parity, offspring sex, and smoking status. More women with PCOS+IH had received fertility treatment compared with controls. TT and FT levels were higher in PCOS+IH vs controls, whereas SHBG levels were lower. Differences in TT, FT, and SHBG between PCOS+IH and controls remained important when women were divided according to offspring sex (Table 1). TT, FT, and SHBG levels were comparable in women pregnant with male and female offspring within PCOS and within controls (Table 2).
Baseline Characteristics in Women With PCOS+IH and Controls
| All (n = 1486) | PCOS+IH (n = 145) | Controls (n = 1341) | PCOS+IH vs Controls, P Value | |
|---|---|---|---|---|
| BMI, kg/m2a | 24.1 (20.3–28.7) | 24.6 (20.2–29.9) | 24.1 (20.3–28.5) | 0.18 |
| Age, y | 30 (±5) | 31 (±5) | 30 (±5) | 0.21 |
| Parity | ||||
| 0 | 58% (857) | 55% (80) | 58% (777) | 0.81 |
| 1 | 32% (477) | 34% (49) | 32% (428) | |
| >1 | 10% (152) | 11% (16) | 10% (136) | |
| Offspring sex | ||||
| Female | 47% (699) | 45% (65) | 47% (634) | 0.57 |
| Male | 53% (787) | 55% (80) | 53% (707) | |
| Hirsutism | (n = 1081) | (n = 127) | (n = 954) | |
| Yes | 9% (92) | 72% (92) | 0% (0) | <0.001 |
| No | 91% (989) | 28% (35) | 100% (954) | |
| Fertility treatment | (n = 1032) | (n = 113) | (n = 919) | |
| Yes | 14% (140) | 35% (40) | 11% (100) | <0.001 |
| No | 86% (892) | 65% (73) | 89% (819) | |
| Smoking | (n = 1484) | (n = 145) | (n = 1339) | |
| Yes | 4% (59) | 5% (7) | 4% (52) | 0.66 |
| No | 96% (1425) | 95% (138) | 96% (1287) | |
| TT, nmol/La | (n = 1486) | (n = 145) | (n = 1341) | |
| 2.0 (1.2–3.3) | 2.4 (1.4–3.9) | 2.0 (1.2–3.3) | <0.001 | |
| FT, nmol/La | (n = 1,78) | (n = 144) | (n = 1334) | |
| 0.004 (0.002–0.007) | 0.005 (0.003–0.009) | 0.004 (0.002–0.007) | <0.001 | |
| SHBG, nmol/L | (n = 1478) | (n = 144) | (n = 1334) | |
| 474 (±112) | 447 (±110) | 477 (±112) | 0.003 | |
| Pregnancy with female offspring | ||||
| TT, nmol/La | (n = 699) | (n = 65) | (n = 634) | |
| 2.0 (1.2–3.3) | 2.5 (1.5–4.0) | 2.0 (1.2–3.3) | <0.001 | |
| FT, nmol/La | (n = 694) | (n = 64) | (n = 630) | |
| 0.004 (0.002–0.007) | 0.005 (0.003–0.009) | 0.004 (0.002–0.007) | <0.001 | |
| SHBG, nmol/L | (n = 694) | (n = 64) | (n = 630) | |
| 479 (±112) | 444 (±116) | 482 (±112) | 0.005 | |
| Pregnancy with male offspring | ||||
| TT, nmol/La | (n = 787) | (n = 80) | (n = 707) | |
| 2.0 (1.2; 3.3) | 2.3 (1.3; 3.8) | 2.0 (1.2; 3.3) | 0.03 | |
| FT, nmol/La | (n = 784) | (n = 80) | (n = 704) | |
| 0.004 (0.002–0.007) | 0.005 (0.003–0.008) | 0.004 (0.002–0.007) | 0.005 | |
| SHBG, nmol/L | (n = 784) | (n = 80) | (n = 704) | |
| 470 (±111) | 450 (±107) | 472 (±112) | 0.13 | |
Data presented as percent of group (number). Age and SHBG were Gaussian distributed and presented as arithmetic mean (±SD). P value for differences between PCOS status tested using t test for continuous variables and χ2 test for categorical variables.
BMI, TT, and FT were ln-transformed, geometric mean (mean – SD; mean + SD).
Maternal Testosterone Concentrations According to Offspring Sex and PCOS Status
| PCOS+IH | Controls | |||||
|---|---|---|---|---|---|---|
| Pregnancy With Female Offspring | Pregnancy With Male Offspring | P | Pregnancy With Female Offspring | Pregnancy With Male Offspring | P | |
| TT, nmol/La | (n = 65) | (n = 80) | (n = 634) | (n = 707) | ||
| 2.5 (1.5–4.0) | 2.3 (1.3–3.8) | 0.23 | 2.0 (1.2–3.3) | 2.0 (1.2–3.3) | 0.94 | |
| FT, nmol/La | (n = 64) | (n = 80) | (n = 630) | (n = 704) | ||
| 0.005 (0.003–0.009) | 0.005 (0.003–0.008) | 0.21 | 0.004 (0.002–0.007) | 0.004 (0.002–0.007) | 0.37 | |
| SHBG, nmol/L | (n = 64) | (n = 80) | (n = 630) | (n = 704) | ||
| 444 (±116) | 450 (±107) | 0.73 | 482 (±112) | 472 (±112) | 0.10 | |
P value for differences between PCOS status tested using t test for continuous variables. SHBG was Gaussian distributed and presented as arithmetic mean (±SD).
T testosterone and F testosterone were ln-transformed and presented as geometric mean (mean – SD; mean + SD).
Table 3 shows mean (SD) and 95% reference intervals for TT, FT, and SHBG in women with PCOS+IH and controls. Table 4 shows the partitioning of reference intervals for TT, FT, and SHBG according to PCOS status. Partitioning of TT, FT, and SHBG reference intervals for PCOS+IH and controls was an ambiguous decision.
TT, FT, and SHBG in Women With PCOS+IH and Controls
| Mean (SD)a | 95% Reference Interval | |
|---|---|---|
| PCOS+IH | ||
| TT (n = 145)a | 2.35 (1.43–3.89) | 0.88–6.30 |
| FT (n = 144)a | 0.005 (0.003–0.009) | 0.002–0.015 |
| SHBG (n = 144) | 447 (±110) | 231–664 |
| Controls | ||
| TT (n = 1341)a | 1.97 (1.18–3.27) | 0.73–5.32 |
| FT (n = 1334)a | 0.004 (0.002–0.007) | 0.001–0.011 |
| SHBG (n = 1334) | 477 (±112) | 258–696 |
| All | ||
| TT (n = 1486)a | 2.00 (1.21; 3.33) | 0.74–5.44 |
| FT (n = 1478)a | 0.004 (0.002; 0.007) | 0.001–0.012 |
| SHBG (n = 1478) | 474 (±112) | 255–693 |
Unit for total testosterone, SHBG, and free testosterone: nmol/L. SHBG was Gaussian distributed and presented as arithmetic mean (±SD).
TT and FT were ln-transformed and presented as geometric mean (mean – SD; mean + SD).
Partitioning of Reference Intervals for TT, FT, and SHBG According to PCOS Status
| Data for Group Distribution | Partitioning Criteria | |||||||||
|---|---|---|---|---|---|---|---|---|---|---|
| Conc, nmol/L | ln (Conc) | |||||||||
| PCOS+IH | Controls | PCOS+IH | Controls | R | DU | DL | Δ/SD | Partitioning for 1 End | Conclusion on Partitioning | |
| TT | (n = 145) | (n = 1341) | (n = 145) | (n = 1341) | ||||||
| Upper limit | 6.30 | 5.32 | 1.841 | 1.671 | 0.17 | 0.34 | Ambiguous | Ambiguous | ||
| Lower limit | 0.88 | 0.73 | −0.128 | −0.315 | 0.19 | 0.38 | Ambiguous | |||
| Mean | 0.856 | 0.678 | ||||||||
| SD | 0.502 | 0.507 | 1.01 | |||||||
| FT | (n = 144) | (n = 1334) | (n = 144) | (n = 1334) | ||||||
| Upper limit | 0.015 | 0.011 | −4.229 | −4.474 | 0.25 | 0.47 | Ambiguous | Ambiguous | ||
| Lower limit | 0.002 | 0.001 | −6.303 | −6.539 | 0.24 | 0.45 | Ambiguous | |||
| Mean | −5.266 | −5.507 | ||||||||
| SD | 0.529 | 0.527 | 1.00 | |||||||
| SHBGa | (n = 144) | (n = 1334) | ||||||||
| Upper limit | 664 | 696 | — | — | 32 | 0.29 | Ambiguous | Ambiguous | ||
| Lower limit | 231 | 258 | — | — | 27 | 0.24 | Not relevant | |||
| Mean | 447 | 477 | — | — | ||||||
| SD | 110 | 112 | — | — | 1.01 | |||||
Data presented as 97.5% (upper limit) and 2.5% (lower limit). Recommendations according to Lahti et al., 2002: Δ/SD ≥ 0.75: partitioning recommended; Δ/SD 0.25–0.75. Ambiguous decision, Δ/SD < 0.25: partitioning not relevant.
Abbreviations: DL, difference between lower limit in PCOS and controls (ln values for TT and FT); DU, difference between upper limit in PCOS and controls (ln values for TT and FT); R, ratio of SD in women with PCOS and controls (larger SD divided by smaller SD); Δ/SD for lower limit, DL/SD of the narrower subgroup distribution; Δ/SD for upper limit: DU/SD of the narrower subgroup distribution.
SHBG was Gaussian distributed and data were not ln-transformed.
The percentage of women with PCOS+IH and controls with TT, FT, and SHBG above the upper cutoff limit for controls is shown in Table 5. A higher percentage of women with PCOS+IH than controls had FT levels above the cutoff limit (7.6 vs 3.6%, P = 0.02).
Fractions of Women With PCOS+IH and Controls With Testosterone and SHBG Levels Above the Upper Cutoff Limit for Controls
| Cutoff Limit, nmol/L | PCOS+IH %, n | Controls %, n | P | |
|---|---|---|---|---|
| TT | ≥5.32 | 4.1% (6/145) | 3.2% (43/1,341) | 0.55 |
| FT | ≥0.011 | 7.6% (11/144) | 3.6% (48/1,334) | 0.02 |
| SHBG | ≥696 | 0.7% (1/144) | 2.6% (34/1,334) | 0.16 |
| Cutoff Limit, nmol/L | PCOS+IH %, n | Controls %, n | P | |
|---|---|---|---|---|
| TT | ≥5.32 | 4.1% (6/145) | 3.2% (43/1,341) | 0.55 |
| FT | ≥0.011 | 7.6% (11/144) | 3.6% (48/1,334) | 0.02 |
| SHBG | ≥696 | 0.7% (1/144) | 2.6% (34/1,334) | 0.16 |
P value represents χ2 test, PCOS vs controls.
Linear regression analyses (Tables 6 and7) showed that PCOS status predicted TT (P < 0.001) and FT (P < 0.001); this remained significant after adjusting for maternal age, BMI, parity, offspring sex, and smoking.
Regression Models for TT During Pregnancy (n = 1486)
| Model 1 (Crude) (n = 1486) | Model 2 (n = 1486) | Model 3 (n = 1486) | Model 4 (n = 1486) | Model 5 (n = 1484) | |
|---|---|---|---|---|---|
| PCOS | 0.18 | 0.20 | 0.19 | 0.19 | 0.19 |
| (0.09–0.27) | (0.12–0.28) | (0.11–0.28) | (0.11–0.28) | (0.11–0.27) | |
| (P < 0.001) | (P < 0.001) | (P < 0.001) | (P < 0.001) | (P < 0.001) | |
| Age | — | −0.04 | −0.03 | −0.03 | −0.03 |
| (−0.04; −0.03) | (−0.04; −0.03) | (−0.04; −0.03) | (−0.04; −0.02) | ||
| (P < 0.001) | (P < 0.001) | (P < 0.001) | (P < 0.001) | ||
| BMI | — | 0.001 | 0.002 | 0.002 | 0.002 |
| (−0.004; 0.007) | (−0.003; 0.007) | (−0.003; 0.007) | (−0.003; 0.007) | ||
| (P = 0.58) | (P = 0.47) | (P = 0.47) | (P = 0.50) | ||
| Parity | — | — | −0.12 | −0.12 | −0.12 |
| (−0.15; −0.08) | (−0.15; −0.08) | (−0.15; −0.08) | |||
| (P < 0.001) | (P < 0.001) | (P < 0.001) | |||
| Offspring sex (female) | — | — | — | 0.002 | 0.004 |
| (−0.05; 0.05) | (−0.04; 0.05) | ||||
| (P = 0.94) | (P = 0.87) | ||||
| Smoking | — | — | — | — | 0.06 |
| (−0.06; 0.19) | |||||
| (P = 0.33) | |||||
| R2 | 0.01 (P < 0.001) | 0.13 (P < 0.001) | 0.15 (P < 0.001) | 0.15 (P < 0.00) | 0.15 (P < 0.00) |
Data represent β-coefficients (95% CI) and adjusted R2 values. TT was ln-transformed. Models adjusted for PCOS status (control, PCOS), age, BMI, parity, offspring sex, and smoking.
Regression Models for FT During Pregnancy (n = 1478)
| Model 1 (Crude) (n = 1478) | Model 2 (n = 1478) | Model 3 (n = 1478) | Model 4 (n = 1478) | Model 5 (n = 1476) | |
|---|---|---|---|---|---|
| PCOS | 0.24 | 0.25 | 0.25 | 0.25 | 0.24 |
| (0.15–0.33) | (0.16–0.33) | (0.16–0.33) | (0.16–0.33) | (0.16–0.33) | |
| (P < 0.001) | (P < 0.001) | (P < 0.001) | (P < 0.001) | (P < 0.001) | |
| Age | — | −0.04 | −0.03 | −0.03 | −0.03 |
| (−0.04; −0.03) | (−0.04; −0.02) | (−0.04; −0.02) | (−0.04; −0.02) | ||
| (P < 0.001) | (P < 0.001) | (P < 0.001) | (P < 0.001) | ||
| BMI | — | 0.02 | 0.02 | 0.02 | 0.02 |
| (0.01–0.02) | (0.01–0.02) | (0.01–0.02) | (0.01–0.02) | ||
| (P < 0.001) | (P < 0.001) | (P < 0.001) | (P < 0.001) | ||
| Parity | — | — | −0.10 | −0.10 | −0.10 |
| (−0.14; −0.06) | (−0.14; −0.06) | (−0.14; −0.06) | |||
| (P < 0.001) | (P < 0.001) | (P < 0.001) | |||
| Offspring sex (female) | — | — | — | −0.01 | −0.01 |
| (−0.06; 0.04) | (−0.06; 0.04) | ||||
| (P = 0.58) | (P = 0.58) | ||||
| Smoking | — | — | — | — | 0.12 |
| (−0.001; 0.26) | |||||
| (P = 0.05) | |||||
| R2 | 0.02 (P < 0.001) | 0.13 (P < 0.001) | 0.15 (P < 0.001) | 0.15 (P < 0.001) | 0.15 (P < 0.001) |
Data represent β-coefficients (95% CI) and adjusted R2 values. FT was ln-transformed. Models adjusted for PCOS status (control, PCOS), age, BMI, parity, offspring sex, and smoking.
We repeated calculations of FT assuming a lower albumin concentration of 32.5 g/L instead of 42 g/L. Changing the concentration of albumin resulted in very small changes in calculated FT levels (fourth to fifth decimal) (18). Substantial results of the study were not affected by changing the assumed concentration of albumin (data not presented).
Sensitivity analyses
GDM
Thirty-six women had a diagnosis of GDM (PCOS, n = 2; controls, n = 34). Omitting women with a diagnosis of GDM did not change important results except that partitioning of the lower limit of the reference interval for SHBG was changed from “not recommended” to “ambiguous” (data not presented).
PCOS diagnosis
Sixty-one women had a possible diagnosis of IH. Women with possible IH resembled the remaining women in the PCOS cohort (n = 84) regarding age, BMI, parity, offspring sex, and smoking, whereas fewer women with IH compared with the remaining women with PCOS had undergone fertility treatment (18). FT and TT levels were lower in women with possible IH compared with the rest of the women in the PCOS group, whereas SHBG levels were comparable. The 95% reference interval for TT was 1.03 to 6.50 nmol/L and FT 0.002 to 0.017 nmol/L in women with PCOS (n = 84).
Partitioning was repeated after excluding women with possible IH from the PCOS group. This did not change important results except that partitioning of the lower limit of the reference interval for TT was changed from “ambiguous” to “recommended.”
Depression
Seven women had a hospital diagnosis of depression during pregnancy (PCOS, 3/145 = 2.1% vs controls: 4/1341 = 0.3%, P = 0.003). Removing women with depression from the study population did not change important findings of the study (data not shown).
Discussion
In the current study, we performed reference intervals for third-trimester levels of TT and FT in a well-described cohort of women divided according to PCOS status. We found that maternal concentrations of TT and FT were higher and SHBG was lower in pregnant women with PCOS compared with controls. Reference intervals in women with PCOS and controls were overlapping, and performing separate reference intervals for the two study populations was an ambiguous decision (22). TT and FT levels were positively affected by PCOS status and BMI and inversely affected by maternal age and parity, whereas offspring sex and smoking did not affect TT and FT levels.
The present data expand the previous study by Neale et al. (15), who reported MS/MS-derived reference range for TT in 60 pregnant women during the first (TT reference range, 0.6 to 4.9 nmol/L) and second trimester (TT reference range, 0.9 to 4.9 nmol/L). In comparison, the reference range for TT in nonpregnant women determined by Neale (15) and our local laboratory was comparable at <1.7 nmol/L. Therefore, our findings of a third-trimester reference interval for TT at 0.7 to 5.3 nmol/L in controls could support a hypothesis that TT levels are elevated from first trimester and could increase further during the last trimester. This was supported by a recent prospective study by Schock et al. in 71 pregnant women with unreported PCOS status, in which TT levels showed a weak and gradual increase throughout pregnancy (12). Several mechanisms were suggested to influence TT levels in pregnancy. Levels of SHBG increased, but became stable in the last trimester (10) and could not explain increased TT during third trimester. Instead, estradiol levels increase substantially throughout the whole pregnancy (10, 12). Furthermore, Bamman et al. measured FT by equilibrium dialysis and found stable FT levels before week 28 followed by a significant increase from a mean value of 0.040 to 0.106 nmol/L after week 28 (11). The authors suggested that increasing levels of FT during the last trimester could be due to increased testosterone production by the fetus (11). The origin of possible fetal testosterone production is undetermined. TT levels in the amniotic fluid of male fetuses were significantly higher than TT levels of female fetuses, but the current study and a previous study (11) found comparable maternal TT levels irrespective of fetal sex. The present and previous studies (13, 23–25) supported that PCOS status affected levels of TT and FT levels. Furthermore, our results supported that the effect of PCOS on TT and FT levels remained substantial after correction for age, BMI, parity, and smoking. Several previous studies in pregnant women with PCOS applied immunoassays to establish TT levels (23–25). Direct immunoassays are not considered the gold standard in women (5, 6). In a recent study, Caanen et al. evaluated TT levels by LC-MS/MS around 20 weeks of gestation and by delivery in mothers with PCOS (n = 20) vs controls (n = 83) (13) and found significantly higher TT levels in PCOS vs controls at both times of gestation and also in umbilical cord blood of mothers with PCOS (13). FT and SHBG levels were not presented in the article (13) and the mechanism for higher TT levels in PCOS vs controls still needs to be determined. However, higher testosterone levels in pregnant women with PCOS compared with controls could question the complete suppression of ovarian and adrenal activity during pregnancy in PCOS (13, 26). This hypothesis was supported by the inverse association between age and testosterone levels both outside and during pregnancy (9, 26). Unfortunately, we did not have access to adrenal hormones such as dehydroepiandrostenedione sulfate in the current study. Our finding of a positive association between BMI and TT could be due to increased conversion of androgens in the adipose tissue (26). Several polymorphisms in the aromatase enzyme in the placenta could also be a predictor of maternal TT levels (26). Furthermore, previous studies supported that TT levels in pregnancy may also be stimulated by depression (26), weight gain (26, 27), and smoking (12), which could all be more prevalent in women with PCOS compared with controls (28, 29).
In the current study, we tested the hypothesis that partitioning of reference intervals for TT, FT, and SHBG in women with PCOS and controls would be recommended because of higher levels of testosterone in PCOS. We found that reference intervals for TT, FT, and SHBG in women with PCOS and controls were overlapping, and performing separate reference intervals for the two study populations was an ambiguous decision (22). We found that twice as many women with PCOS compared with controls had FT levels above the reference interval for controls. Our study therefore supports that partitioning of reference intervals for FT should be considered. The importance of measuring testosterone levels during pregnancy remains to be established. Measurement of prepregnant (i.e., low) levels of TT and SHBG in pregnancy could be due to insufficient production of estrogen during pregnancy and have been associated with high risk of abortion (11). Naver et al. reported that increased risk of preterm delivery and preeclampsia was confined to hyperandrogenic women with PCOS, indicating that hyperandrogenism might influence the risk of pregnancy complications (30). Furthermore, the impact of higher cord blood testosterone levels in children born of mothers with PCOS needs to be determined in future studies (26).
Strengths and limitations may apply to the current study. The study included 145 women with PCOS and high-quality assays were used to measure TT. In the current study design, women with PCOS were not followed more closely than controls (i.e., there was no surveillance bias). We consider this a study strength because the metabolic risk in lean women with PCOS is still debated (31). The diagnosis of PCOS was based on a combination of self-reported PCOS and PCOS diagnosis from medical records because PCOS cannot be diagnosed during pregnancy. Adding self-reported PCOS allowed us to identify cases without a hospital diagnosis; these women were diagnosed and treated by a general practitioner or private gynecologist. This resulted in a PCOS cohort of relatively lean and healthy women, but would arguably be more applicable to PCOS in the general population. However, some women in the control population could have undiagnosed PCOS and women with IH could be misclassified as PCOS, which in both situations would increase the risk of type 2 error. We performed a sensitivity analysis in which we excluded women with possible IH and this did not change important results; therefore, we chose to keep women with possible IH as part of the PCOS cohort. Results for FT were derived from TT and SHBG because we used Vermeulen’s equation with estimated levels of albumin. We chose this method because it resembles generally applied procedures in the daily clinic, where direct measurement of FT by microdialysis is not available and albumin is not measured routinely (32). Albumin levels decrease during pregnancy and the level in 25% decreased during the third trimester (21). Therefore, we repeated FT calculations with an assumption of lover albumin levels. This did not change important results. In the clinic, it is not general practice to adjust estimated albumin concentration according to pregnancy status, so we kept an assumed plasma albumin concentration of 4.3 g/dL (20). Furthermore, we expect that a diagnosis of PCOS would not affect the tendency to decreased albumin levels during pregnancy. The correct method for estimation of FT is highly debated (32, 33), and the current study underlines the importance of general consensus also during pregnancy.
The women participating in OCC were more ethnically homogenous, leaner, more educated, and were less likely to smoke compared with the background population (16). This is often a problem in cohort studies, where minorities and people of lower social status tend to drop out. The presented reference intervals for TT, FT, and SHBG therefore need to be reproduced in a more obese study population and in women of other ethnicities.
Conclusions
Maternal levels of TT and FT were higher and SHBG levels were lower in third-trimester women with PCOS compared with controls. Specific reference ranges for TT, FT, and SHBG in women with PCOS was an ambiguous decision, but should be considered for FT.
Abbreviations:
- BMI
body mass index
- FT
free testosterone
- GDM
gestational diabetes mellitus
- IH
idiopathic hirsutism
- LC-MS/MS
liquid chromatography tandem mass spectrometry
- ln
natural logarithm
- OCC
Odense Child Cohort
- PCOS
polycystic ovary syndrome
- SHBG
sex hormone–binding globulin
- TT
total testosterone
Acknowledgments
The families in Odense Child Cohort are acknowledged for their participation and commitment to the study. The technicians at Hans Christian Andersen's Children's Hospital are acknowledged for their careful examination of the children.
Financial Support: Financial grants for the study were supported by the Danish Foundation for Scientific Innovation and Technology (09-067180); Ronald McDonald Children Foundation; Odense University Hospital; the Region of Southern Denmark ; Municipality of Odense; Mental Health Service of the Region of Southern Denmark; The Danish Council for Strategic Research, Program Commission on Health, Food and Welfare Grant 2101-08- 0058; Odense Patient Data Exploratory Network (OPEN); Novo Nordisk Foundation Grant NNF15OC00017734; Danish Council for Independent Research; The Foundation for Research Collaboration Between Rigshospitalet and Odense University Hospital; and the Health Foundation (Helsefonden) (all to H.B.K.).
Disclosure Summary: The authors have nothing to disclose.
References
Glintborg D, Jensen RC, Andersen M. Testosterone levels in 3rd trimester in polycystic ovary syndrome (Appendix Tables). Odense Child Cohort. Available at: https://doi.org/10.6084/m9.figshare.6652268.v1. Accessed 31 July 2018.
