


Abstract
High-resolution peripheral quantitative computed tomography (HRpQCT) is a noninvasive imaging technology that can provide insight into skeletal microstructure and strength. In asymptomatic primary hyperparathyroidism (PHPT), HRpQCT imaging has demonstrated both decreased cortical and trabecular indices, consistent with evidence for increased fracture risk. There are limited data regarding changes in HRpQCT parameters postparathyroidectomy.
To evaluate changes in skeletal microstructure by HRpQCT in subjects with PHPT after parathyroidectomy.
We studied 29 subjects with PHPT (21 women, 8 men) with HRpQCT at baseline and 6, 12, 18, and 24 months postparathyroidectomy.
Volumetric bone mineral density, microarchitectural indices, and finite element analysis at the distal radius and tibia.
At both the radius and tibia, there were significant improvements in total, cortical, and trabecular volumetric bone density as early as 6 months postparathyroidectomy (24-month values for total volumetric bone density, radius: +2.8 ± 4%, tibia: +4.4 ± 4%; P < 0.0001 for both), cortical thickness (radius: +1.1 ± 2%, tibia: +2.0 ± 3%; P < 0.01 for both), and trabecular bone volume (radius: +3.8 ± 5%, tibia: +3.2 ± 4%; P < 0.0001 for both). At both sites, by finite element analysis, stiffness and failure load were improved starting at 6 months postparathyroidectomy (24-month values for failure load, radius: +6.2 ± 6%, tibia: +4.8 ± 7%; P < 0.0001 for both).
These results provide information about skeletal microarchitecture in subjects with PHPT followed through 2 years after parathyroidectomy. Estimated bone strength is improved, consistent with data showing decreased fracture risk postparathyroidectomy.
Primary hyperparathyroidism (PHPT) is characterized by excessive secretion of parathyroid hormone and hypercalcemia. In parts of the world where serum calcium is a routine component of the multichannel autoanalyzer, the disease is usually recognized incidentally on routine blood tests (1, 2). The major complications of PHPT include nephrolithiasis, osteoporosis, and fracture (2). Even in its mild, asymptomatic form, PHPT is associated with skeletal changes when measured by dual-energy X-ray absorptiometry (DXA) and high-resolution peripheral quantitative computed tomography (HRpQCT), a noninvasive imaging method to measure bone geometry and microarchitecture and estimate bone strength (3, 4). Whereas trabecular sites are relatively preserved when measured by DXA, HRpQCT imaging demonstrates reduced trabecular as well as cortical indices. Data obtained by HRpQCT support epidemiological studies indicating increased generalized fracture risk at vertebral and nonvertebral sites (3, 4). It is well known that bone density by DXA improves after parathyroidectomy in PHPT (2, 5) but less is known about postparathyroidectomy changes in skeletal microstructure using HRpQCT. In a cohort of women 1 year after parathyroidectomy, improvements in total and trabecular volumetric bone density, bone stiffness, and failure load were noted at both the radius and tibia, as well as improvements in trabecular number and separation at the radius alone (6). In this study, we provide information about changes in skeletal microarchitecture in a cohort of women and men with PHPT followed for 2 years after parathyroid surgery.
Materials and Methods
Subjects
The diagnosis of PHPT was established by a serum calcium concentration above the upper normal limit with a concurrent parathyroid hormone (PTH) concentration above the upper normal limit (14 to 66 pg/mL) or inappropriately normal in the setting of hypercalcemia (≥25 pg/mL). Exclusion criteria included any other chronic disorder affecting mineral metabolism, including Paget disease of bone, significant liver or kidney disease, or untreated thyroid disease. Patients using bisphosphonates up until the time of surgery were considered eligible; current users of denosumab were excluded. Current users of hormone replacement therapy were not excluded as long as use was longstanding, antedated parathyroidectomy and was continued throughout the postparathyroidectomy period.
Patients were recruited from the Metabolic Bone Diseases Unit of Columbia University Medical Center. The study was approved by the Institutional Review Board of Columbia University Medical Center. All subjects gave written informed consent.
Of 42 subjects enrolled, 29 subjects who underwent successful parathyroidectomy and had data through at least 12 months are included in this analysis. Of the 29 subjects with baseline data, 27 participants had HRpQCT imaging at 6 months, 26 participants at 12 months, 23 participants at 18 months, and 20 participants at 24 months. For technical reasons, the HRpQCT instrument was not available for some subjects at a specified study visit, resulting in slight differences between numbers of subjects with DXA and HRpQCT data over the 2-year period.
Biochemical evaluation
Biochemical indices were measured by automated techniques. The normal ranges are as follows: serum calcium, 8.6 to 10.2 mg/dL; PTH, 14 to 66 pg/mL; 25-hydroxyvitamin D, >20 ng/mL; 1,25-dihydroxyvitamin D, 25 to 66 pg/mL; estimated glomerular filtration rate, >60 mL/min; phosphorus, 2.7 to 4.5 mg/dL; and alkaline phosphatase, 40 to 115 U/L.
Bone turnover markers
Collagen type 1 cross-linked C-telopeptide (CTX) was measured by enzyme-linked immunosorbent assay (Immunodiagnostic Systems, Scottsdale, AZ); inter- and intraassay coefficients of variation were 10.9 and 3%, respectively. The normal premenopausal range is 0.112 to 0.738 ng/mL. Propeptide of type I collagen (P1NP) was measured by radioimmunoassay (Immunodiagnostic Systems); inter- and intraassay coefficients of variation were 8.3 and 6.5%, respectively. The normal premenopausal range is 19 to 83 μg/L.
Imaging evaluation
Areal bone mineral density
Areal bone mineral density (BMD) was measured at the lumbar spine, L1 to L4; total hip; femoral neck; distal 1/3 radius and ultradistal radius by DXA (Hologic QDR4500, Waltham, MA). Short-term in vivo precision error (root-mean-square standard deviation) was 0.026 g/cm2 for L1 to L4 (1.1%), 0.041 g/cm2 for the femoral neck (2.4%), and 0.033 g/cm2 (1.8%) for the forearm.
Volumetric BMD and microarchitecture
HRpQCT images (Xtreme CT I; Scanco Medical AG, Brüttisellen, Switzerland) of the nondominant distal radius and tibia were obtained using a standard protocol (60 kVp, 900 μA, and 100-ms integration time) at a nominal isotropic resolution of 82 μm (7). The region of interest was defined by an antero-posterior scout view, and a reference line was manually placed at the end plate of the radius and tibia. The first of 110 parallel CT slices was acquired 9.5 mm proximal to the reference line at the radius and 22.5 mm proximal to the reference line at the tibia. Attenuation data were converted to equivalent hydroxyapatite (HA) densities. The manufacturer phantom was scanned daily for quality control.
The image analysis protocol has been previously described and validated (7–11). Briefly, a threshold-based algorithm was used to separate the volume of interest into cortical and trabecular compartments. Measurements of total and trabecular bone densities (Tt.BMD, Tb.BMD, mg HA/cm3) were obtained. Inner trabecular density (Dinn) was defined as the inner 60%, and the meta trabecular density (Dmeta) was defined as the outer 40% of the trabecular region. Trabecular bone volume (BV/TV, %) was derived from Tb.BMD, assuming that fully mineralized bone has a density of 1200 mg HA/cm3 [BV/TV % = 100 × (Tb.BMD/1200)]. Trabecular number (Tb.N, 1/mm) was defined as the inverse of the mean spacing of the midaxes. Trabecular thickness (Tb.Th, mm) and trabecular separation (Tb.Sp, mm) were derived from BV/TV and Tb.N using standard morphologic relationships [Tb.Th = (BV/TV)/Tb.N, Tb.Sp = (BV/TV)/Tb.N]. The calculation of intraindividual distribution of separation [trabecular heterogeneity (Tb.Sp.SD)], quantified by the standard deviation of the separation and reflecting the heterogeneity of the trabecular network, was also enabled through distance transformation techniques. Short-term in vivo precision error is 0.7% to 1.5% for total and trabecular densities and 2.5% to 4.4% for trabecular architecture at our facility.
In addition to the standard morphologic analysis previously, an automated segmentation algorithm [Image Processing Language (version 5.08b, Scanco Medical)] was used to measure total bone cross-sectional areas and cortical bone cross-sectional areas (Ct.Ar, mm2), cortical porosity (Ct.Po, %), cortical thickness (Ct.Th, mm), and cortical density (Ct.BMD, mm HA/cm3). Ct.Po was determined by the number of void voxels in each thresholded cortex image divided by the total number of cortical voxels. Ct.Th was calculated using a distance transform after removing the intracortical pores. Ct.BMD was defined by the average mineral density in the region demarcated by the autosegmentation cortical bone mask. The precision error for the automated segmentation algorithm is <1.5% (12).
Finite element analysis
The image analysis protocol has been previously described and validated (11, 13, 14). Whole-bone and trabecular HRpQCT images of the radius and tibia were converted into finite-element models (FAIM, version 6.0, Numerics88, Calgary, Canada) to estimate whole-bone stiffness (N/mm), calculated as the reaction force determined by the model at 1% strain divided by the average cross-sectional area from the morphological analysis. The in vivo precision error for the stiffness measure is <3.5% (15). Failure load (N) was calculated using the Pistoia criterion (16).
Statistical analysis
Descriptive characteristics of study subjects were tabulated for continuous variables by means, medians, and standard deviations. Differences between sexes were calculated by independent t tests for continuous variables and χ2 or Fisher’s exact test for categorical variables. A linear mixed model for repeated measures approach was applied to analyze bone turnover markers, DXA, and HRpQCT results with a single fixed effect of time through 24-month postparathyroidectomy and baseline level of the outcome entered as a continuous covariate. The autoregressive covariance structure (1) was determined prior to inferential testing to provide the best covariance model fit across all of the outcomes to be tested. This analysis assesses the reliability of the within-subject change from baseline. Data are reported as model-estimated means and standard deviations, unless otherwise specified. Differences between time points were calculated by independent t tests. We used linear regression to assess the contribution of age, sex, disease duration, and baseline levels of bone turnover markers to DXA and HRpQCT indices postparathyroidectomy. P values <0.05 were used to establish significance. Statistical analysis was performed using SAS, version 9.4 (SAS Institute, Cary, NC).
Results
Baseline characteristics
The mean age of the subjects was 61.8 ± 14 years (range 31 to 82 years), and 72.4% were women, consistent with the demographics of the disease (Table 1). The median years since diagnosis of PHPT was 1.00 year (range 0.08 to 35 years), greater in the women than men. Overall, 86.2% of subjects met at least one surgical criterion as defined by the Fourth International Workshop on the Management of Asymptomatic PHPT (17), with 44.8% meeting the criterion for osteoporosis as defined by DXA. There were no differences in surgical criteria between women and men.
Baseline Demographics, Laboratory Values, and Bone Density by Dual-Energy X-Ray Absorptiometry for the Primary Hyperparathyroid Cohort
| All (n = 29) | Women (n = 21) | Men (n = 8) | |
|---|---|---|---|
| Age (y) | 61.8 ± 14 | 63.9 ± 10 | 56.4 ± 14 |
| Height (cm) | 166.1 ± 9 | 163.3 ± 8 | 173.5 ± 10a |
| Weight (kg) | 79.1 ± 20 | 73.9 ± 16 | 92.6 ± 24a |
| Body mass index (kg/m2) | 28.6 ± 7 | 27.9 ± 7 | 30.5 ± 7 |
| Years since menopause (n = 18) | — | 14.1 ± 8 | — |
| Years since diagnosis | 1.0 [0.4–8.5] | 2.0 [0.5–12.0] | 0.82 [0.3–1.0]b |
| Prior bisphosphonate use (n) | 8 | 8 | 0 |
| Years since bisphosphonate discontinuation (n = 8) | 3.8 ± 3 | 3.8 ± 3 | NA |
| Current hormone use (n) | 11 | 11 | 0 |
| Met at least one surgical criteriac | 86.2% | 81.0% | 100.0% |
| Calcium >1 mg/dL above normal limit | 27.6% | 23.8% | 37.5% |
| Nephrolithiasis | 17.2% | 14.3% | 25.0% |
| Osteoporosis | 44.8% | 42.9% | 50.0% |
| Fractures | 6.9% | 9.5% | 0.0% |
| eGFR <60 mL/mind | 13.8% | 14.3% | 12.5% |
| Age <50 y | 13.8% | 4.8% | 37.5% |
| Serum calcium (mg/dL) | 10.9 ± 0.6 | 10.9 ± 0.6 | 10.9 ± 0.3 |
| PTH (pg/mL) | 92.5 ± 50 | 83.5 ± 50 | 107.3 ± 31 |
| 25-hydroxyvitamin D (ng/mL) (n = 17)d | 44.8 ± 15 | 41.0 ± 12 | 57.2 ± 21 |
| 1,25-dihydroxyvitamin D (pg/mL) | 68.3 ± 22 | 67.9 ± 22 | 69.2 ± 23 |
| eGFR (mL/min)e | 83.1 ± 18 | 81.8 ± 16 | 86.5 ± 23 |
| Phosphorus (mg/dL) | 2.8 ± 0.5 | 2.9 ± 0.5 | 2.7 ± 0.5 |
| Alkaline phosphatase (U/L) | 81.2 ± 24 | 76.7 ± 26 | 93.1 ± 15 |
| Lumbar spine bone density (g/cm2) | 0.944 ± 0.17 | 0.945 ± 0.17 | 0.941 ± 0.17 |
| Lumbar spine T-scoref | −1.00 ± 1.6 | −0.85 ± 1.6 | −1.39 ± 1.6 |
| Lumbar spine z-scoref | +0.36 ± 1.7 | +0.83 ± 1.6 | −0.81 ± 1.6b |
| Femoral neck bone density (g/cm2) | 0.704 ± 0.13 | 0.690 ± 0.10 | 0.741 ± 0.18 |
| Femoral neck T-score | −1.43 ± 1.1 | −1.44 ± 1.0 | −1.39 ± 1.3 |
| Femoral neck z-score | −0.12 ± 1.0 | +0.02 ± 1.0 | −0.21 ± 1.0 |
| Total hip bone density (g/cm2) | 0.840 ± 0.15 | 0.809 ± 0.12 | 0.922 ± 0.19 |
| Total hip T-score | −0.99 ± 1.1 | −1.10 ± 1.0 | −0.74 ± 1.3 |
| Total hip z-score | 0.00 ± 1.0 | +0.08 ± 1.0 | −0.21 ± 1.0 |
| 1/3 radius bone density (g/cm2) | 0.644 ± 0.12 | 0.609 ± 0.09 | 0.738 ± 0.12 |
| 1/3 radius T-score | −1.44 ± 1.8 | −1.42 ± 1.6 | −1.50 ± 2.3 |
| 1/3 radius z-score | +0.06 ± 1.5 | +0.28 ± 1.5 | −0.54 ± 1.7g |
| Ultradistal radius bone density (g/cm2) | 0.380 ± 0.09 | 0.365 ± 0.08 | 0.422 ± 0.10 |
| Ultradistal radius T-score | −1.60 ± 1.4 | −1.40 ± 1.3 | −2.10 ± 1.7 |
| Ultradistal radius z-score | −0.40 ± 1.3 | −0.10 ± 1.3 | −1.18 ± 1.3b |
Mean ± standard deviation or median (interquartile range).
Abbreviation: NA, not applicable.
P < 0.01 between women and men.
P < 0.001 between women and men.
Meets at least one of the five surgical criteria as per the guidelines from the Fourth International Workshop on the Management of Asymptomatic Primary Hyperparathyroidism (17).
Results available for only 17 subjects: 13 women and 4 men.
eGFR, estimated glomerular filtration rate, calculated according to the Chronic Kidney Disease Epidemiology Collaboration (CKD-EPI) Equation (18).
Bone density T- and z-scores were compared between women and men; comparisons were not assessed for absolute bone density.
P < 0.05 between women and men.
Biochemical evaluation
The mean serum calcium was elevated at baseline at 10.9 ± 0.6 mg/dL (Table 1). The average PTH concentration was 92.5 ± 50 pg/mL, with an average 25-hydroxyvitamin D level of 44.8 ± 15 ng/mL. The mean 1,25-dihydroxyvitamin D was elevated, at 68.3 ± 22 pg/mL. There were no differences between women and men. Serum calcium normalized and remained normal for all subjects following parathyroidectomy, indicating biochemical cure.
Bone turnover markers
The mean CTX value at baseline was 0.678 ± 0.35 ng/mL, at the upper end of the premenopausal range. CTX decreased by −49.7 ± 29% at 6 months (P < 0.0001) and remained below baseline levels through 24 months postparathyroidectomy, with an increase noted after the trough was reached at 6 months (−35.1 ± 48%; P < 0.0001 comparison of baseline to 24 months; P = 0.005 comparison of 6 to 24 months) (Fig. 1). The mean P1NP value at baseline was 68 ± 34 μg/L, also at the upper end of the premenopausal range. P1NP decreased by −41.9 ± 23% at 6 months (P < 0.0001) and remained below baseline levels through 24 months postparathyroidectomy (−38.4 ± 35%; P < 0.0001 comparison of baseline to 24 months; P = nonsignificant comparison of 6 to 24 months).
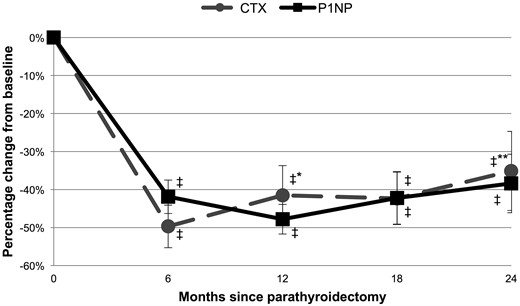
Percentage change in markers of bone resorption (CTX) and formation (P1NP) in subjects with primary hyperparathyroidism through 24 months postparathyroidectomy. ‡P < 0.001 compared with baseline; *P < 0.05 compared with 6 months; **P < 0.01 compared with 6 months.
Imaging
DXA
Baseline areal BMD values, T-scores, and z-scores are presented in Table 1. Baseline BMD z-scores in the men were lower than the women at the lumbar spine, 1/3 radius, and ultradistal radius sites. Postparathyroidectomy, BMD was significantly improved at the lumbar spine, femoral neck, and total hip starting at 6 months and persisting through 24 months for the entire cohort (Table 2). The greatest numerical increase in BMD from baseline at the lumbar spine (+5.4 ± 6%; P < 0.001) and femoral neck (+4.5 ± 4%; P < 0.0001) occurred at 18 months, whereas improvement at the total hip site was greatest at 24 months (+3.8 ± 4%; P < 0.0001). The lumbar spine site showed significant improvement from 12 to 18 months (P = 0.03). There was a significant increase in BMD at the ultradistal radius at 6 months, but this effect did not persist. There were no significant differences in BMD at the 1/3 radius site at any of the time points through 24 months.
Change in Bone Density by Dual-Energy X-Ray Absorptiometry in the Primary Hyperparathyroid Cohort Through 2 Years After Parathyroidectomy
| 6 Months (n = 26) | 12 Months (n = 27) | 18 Months (n = 24) | 24 Months (n = 21) | |
|---|---|---|---|---|
| Lumbar spine | +2.3 ± 3%a,b | +3.8 ± 5%c,d | +5.4 ± 6%b,c,d | +4.6 ± 5%c,d |
| Femoral neck | +2.7 ± 5%a | +2.8 ± 5%a | +4.5 ± 4%c,d | +3.9 ± 5%c,d |
| Total hip | +2.4 ± 3%c | +2.8 ± 3%c | +2.8 ± 4%c | +3.8 ± 4%c,d |
| 1/3 radius | −0.3 ± 3% | −0.3 ± 3% | −0.5 ± 4% | +0.2 ± 4% |
| Ultradistal radius | +1.7 ± 4%e | +0.0 ± 5% | −0.3 ± 6% | +1.3 ± 5% |
P < 0.01 compared with baseline.
P < 0.05 compared with 12 months.
P < 0.001 compared with baseline.
P < 0.05 compared with 6 months.
P < 0.05 compared with baseline.
Linear regression
In a linear regression model investigating change in areal BMD by DXA following parathyroidectomy, including the variables of age, sex, and disease duration, male sex was a significant positive predictor of the response at the lumbar spine (+3.1%; P = 0.028), femoral neck (+2.8%; P = 0.039), and total hip (+2.7%; P = 0.012), when adjusting for the other variables in the model. The BMD results at 24 months postparathyroidectomy stratified by sex are presented in Fig. 2. In a further analysis adjusting for age, sex, disease duration, and total area at the tibia by HRpQCT to adjust for bone size, sex was no longer a significant predictor of response at any site, although the result at the lumbar spine bordered on significance (+3.4%; P = 0.051). Neither age nor disease duration were significant predictors of the response in areal BMD. Estrogen use in women was also studied and was not a significant predictor of response.
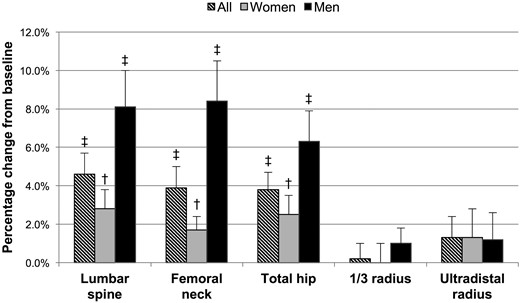
Percentage change in bone density by dual-energy X-ray absorptiometry in subjects with primary hyperparathyroidism at 24 months postparathyroidectomy, in the entire cohort and women and men separately. †P < 0.01 compared with baseline; ‡P < 0.001 compared with baseline.
HRpQCT
At the radius, there were no changes in total, cortical, or trabecular area at any time point through 24 months (Table 3; Fig. 3). Tt.BMD and Tb.BMD were significantly improved starting at 6 months postparathyroidectomy, and were increased by +2.8 ± 4% (P < 0.0001) and +3.8 ± 5% (P < 0.0001) at 24 months, respectively. Ct.BMD was improved at 24 months (+1.5% ± 3%; P < 0.05). Dmeta and Dinn improved early and remained improved at 24 months [+2.9 ± 4% (P < 0.0001) and +5.8 ± 9% (P < 0.05), respectively]. Ct.Th increased starting at 18 months and was +1.1 ± 2% (P < 0.01) at 24 months. BV/TV demonstrated improvement starting at 6 months and was increased +3.8 ± 5% (P < 0.0001) at 24 months, although other trabecular microarchitectural parameters were unchanged throughout the study period (Tb.N, Tb.Th, Tb.Sp, Tb.Sp.SD). Ct.Po also remained unchanged throughout the study period. There were significant improvements in Tt.BMD, Tb.BMD, Ct.BMD, Dinn, BV/TV, and failure load from 12 to 24 months.
Baseline High-Resolution Peripheral Quantitative Computed Tomography Parameters at the Radius and Tibia in the Primary Hyperparathyroid Cohort and Changes Through 2 Years After Parathyroidectomy
| Baseline (n = 29) | 6 Months (n = 27) | 12 Months (n = 26) | 18 Months (n = 23) | 24 Months (n = 20) | |
|---|---|---|---|---|---|
| Radius | |||||
| Tt.Ar (mm2) | 273 ± 60 | 0.0 ± 0.3% | +0.2 ± 1% | +0.1 ± 0.4% | 0.0 ± 0.4% |
| Ct.Ar (mm2) | 54 ± 14 | +0.4 ± 3% | +0.4 ± 4% | +1.2 ± 3% | +1.1 ± 3% |
| Tb.Ar (mm2) | 219 ± 56 | −0.1 ± 1% | +0.2 ± 2% | −0.1 ± 1% | −0.3 ± 1% |
| Tt.BMD (mg HA/cm3) | 264 ± 77 | +1.1 ± 3%a | +1.3 ± 4%a | +2.5 ± 4%b,c | +2.8 ± 4%b,c,d |
| Ct.BMD (mg HA/cm3) | 791 ± 74 | +0.5 ± 3% | +0.2 ± 4% | +1.2 ± 3% | +1.5 ± 3%a,d |
| Tb.BMD (mg HA/cm3) | 122 ± 44 | +1.7 ± 4%a | +1.8 ± 4%a | +3.4 ± 4%b,c,d | +3.8 ± 5%b,c,d |
| Ct.Th (mm) | 0.87 ± 0.2 | +0.2 ± 2% | +0.1 ± 2% | +0.8 ± 2%e | +1.1 ± 2%e |
| Dmeta (mg HA/cm3) | 185 ± 43 | +1.0 ± 4% | +1.5 ± 4%a | +1.8 ± 3%a | +2.9 ± 4%b |
| Dinn (mg HA/cm3) | 79 ± 46 | +5.3 ± 10%a | +1.9 ± 10% | +7.3 ± 8%c,d,e | +5.8 ± 9%a,d |
| Dmeta/inn | 3.50 ± 3.6 | −3.5 ± 8% | +0.6 ± 12% | −4.7 ± 6%a | −2.5 ± 5% |
| BV/TV (%) | 0.102 ± 0.04 | +1.7 ± 4%a | +1.8 ± 4%a | +3.4 ± 4%b,c,d | +3.8 ± 5%b,c,d |
| Tb.N (1/mm) | 1.77 ± 0.4 | 0.0 ± 10% | +1.7 ± 10% | +2.3 ± 8% | +3.6 ± 9% |
| Tb.Th (mm) | 0.057 ± 0.01 | +2.6 ± 8% | +0.7 ± 8% | +1.7 ± 8% | +0.5 ± 6% |
| Tb.Sp (mm) | 0.548 ± 0.18 | +0.7 ± 10% | −1.0 ± 9% | −1.8 ± 8% | −3.2 ± 9% |
| Tb.Sp.SD (mm) | 0.297 ± 0.21 | +0.8 ± 12% | −1.6 ± 11% | −0.2 ± 12% | −3.1 ± 11% |
| Ct.Po (%) | 2.7 ± 2 | +5.6 ± 21% | +4.9 ± 20% | +4.7 ± 20% | +5.7 ± 26% |
| Stiffness (N/mm) | 37,142 ± 13,078 | +4.2 ± 5%e | +3.6 ± 7%a | +6.0 ± 8%b | +6.6 ± 6%b |
| Failure load (N) | 1567 ± 543 | +4.0 ± 4%b | +3.5 ± 5%e | +5.6 ± 7%b | +6.2 ± 6%b,c,d |
| Tibia | |||||
| Tt.Ar | 785 ± 148 | 0.0 ± 0.1% | +0.1 ± 0.3% | 0.0 ± 0.1% | 0.0 ± 0.2% |
| Ct.Ar (mm2) | 111 ± 32 | +1.1 ± 3% | +1.9 ± 4%e,c | +2.7 ± 5%b,c | +4.5 ± 5%b,c,d,f |
| Tb.Ar (mm2) | 673 ± 147 | −0.2 ± 1% | −0.2 ± 1% | −0.4 ± 1%a,c | −0.8 ± 1%b,c,d,f |
| Tt.BMD (mg HA/cm3) | 238 ± 52 | +1.6 ± 2%e | +2.3 ± 3%b | +3.5 ± 4%b,c | +4.4 ± 4%b,c,d,f |
| Ct.BMD (mg HA/cm3) | 720 ± 98 | +0.9 ± 3% | +1.3 ± 3%a | +3.0 ± 5%b,d | +4.0 ± 4%b,c,d |
| Tb.BMD (mg HA/cm3) | 149 ± 33 | +1.3 ± 2%a | +1.7 ± 3%e | +2.7 ± 3%b,c | +3.2 ± 4%b,c |
| Ct.Th (mm) | 1.19 ± 0.3 | +0.7 ± 2% | +0.9 ± 2% | +1.9 ± 3%b,c,d | +2.0 ± 3%b,c,d,f |
| Dmeta (mg HA/cm3) | 219 ± 37 | +1.0 ± 2%a | +1.3 ± 3%e | +2.2 ± 3%b,c | +2.4 ± 3%b,c |
| Dinn (mg HA/cm3) | 101 ± 35 | +1.9 ± 3%a | +2.3 ± 4%e | +4.0 ± 5%b,c | +4.9 ± 6%b,c |
| Dmeta/inn | 2.43 ± 1.1 | −0.9 ± 3% | −0.9 ± 3% | −1.6 ± 4%a | −2.1 ± 4%e |
| BV/TV (%) | 0.124 ± 0.03 | +1.3 ± 2%a | +1.7 ± 3%e | +2.7 ± 3%b,c | +3.2 ± 4%b,c |
| Tb.N (1/mm) | 1.92 ± 0.4 | −3.1 ± 8% | −0.2 ± 11%c | +0.8 ± 9% | +3.5 ± 9%c,f |
| Tb.Th (mm) | 0.065 ± 0.01 | +5.0 ± 8%e | +2.6 ± 10% | +2.6 ± 9% | +0.1 ± 8%c |
| Tb.Sp (mm) | 0.479 ± 0.12 | +3.7 ± 8%a | +0.9 ± 10%c | −0.4 ± 8%c | −3.2 ± 8%c,f |
| Tb.Sp.SD (mm) | 0.244 ± 0.14 | +2.8 ± 10% | −1.0 ± 11%c | −0.8 ± 9% | −4.1 ± 8%c |
| Ct.Po (%) | 7.9 ± 3 | −1.6 ± 11% | −2.0 ± 8% | −3.5 ± 11% | +1.4 ± 10%d |
| Stiffness (N/mm) | 115,142 ± 37,247 | 4.2 ± 6%b | 5.1 ± 7%b | 4.6 ± 7%b | 4.7 ± 8%e |
| Failure load (N) | 4906 ± 1187 | 3.6 ± 5%b | 4.6 ± 6%b | 4.4 ± 6%b | 4.8 ± 7%b |
Dmeta/inn, the radio of meta to inner trabecular density; Tb.Ar, trabecular area; Tb.BMD, trabecular volumetric bone mineral density; Tt.Ar, total area.
P < 0.05 compared with baseline.
P < 0.001 compared with baseline.
P < 0.05 compared with 6 months.
P < 0.05 compared with 12 months.
P < 0.01 compared with baseline.
P < 0.05 compared with 18 months.
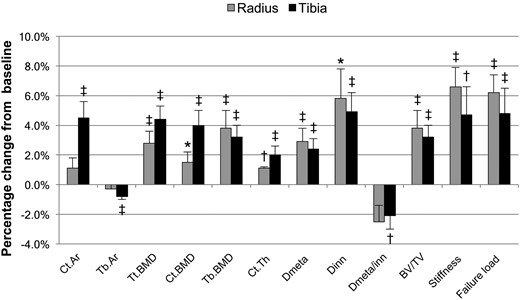
Percentage change in bone density by high-resolution peripheral quantitative computed tomography in subjects with primary hyperparathyroidism at 24 months postparathyroidectomy for selected parameters. Tb.Ar, trabecular area. *P < 0.05 compared with baseline; †P < 0.01 compared with baseline; ‡P < 0.001 compared with baseline.
At the tibia, Ct.Ar increased and was +4.5 ± 5% (P < 0.0001) at 24 months, whereas Tb.Ar decreased −0.8 ± 1% (P < 0.0001) and total bone cross-sectional areas remained unchanged. At 24 months, Tt.BMD, Ct.BMD, and Tb.BMD were increased by +4.4 ± 4%, +4.0 ± 4%, and +3.2 ± 4%, respectively (P < 0.0001 for all). Dmeta and Dinn improved early and remained improved at 24 months [+2.4 ± 3% (P < 0.0001) and +4.9 ± 6% (P < 0.001), respectively], whereas Dmeta/Dinn decreased (−2.1 ± 4%; P < 0.01). As with the radius, BV/TV demonstrated improvement starting at 6 months and was increased +3.2 ± 4% (P < 0.0001) at 24 months. Tb.Th and Tb.Sp were increased at 6 months, but these effects did not persist, and the other trabecular microarchitectural parameters (Tb.N, Tb.Sp.SD) were unchanged throughout the study period. Ct.Po also remained unchanged throughout the study period. There were significant changes in Ct.Ar, Tb.Ar, Tt.BMD, Ct.BMD, and Ct.Th from 12 to 24 months. Ct.Ar, Tb.Ar, Tt.BMD, and Ct.Th continued to change from 18 to 24 months. The addition of bisphosphonate use to the model did not significantly influence the outcome measures (results not shown).
Finite element analysis
At the radius, stiffness and failure load were improved starting at 6 months through 24 months postparathyroidectomy (Table 3). At 24 months, stiffness was improved by +6.6 ± 6% and failure load by +6.2 ± 6% (P < 0.0001 for both). Failure load continued to improve from 12 to 24 months (P = 0.037). Similarly, at the tibia, stiffness and failure load also improved starting at 6 months and remained increased through 24 months [at 24 months, stiffness: +4.7 ± 8% (P < 0.01), failure load: +4.8 ± 7% (P < 0.0001)].
Linear regression
The best fit model for the majority of parameters included age, sex, duration, and baseline CTX. At the radius, duration of PHPT was a significant predictor of the response for the following parameters, after adjusting for the other variables in the model (results given for 10-year increase in disease duration): Ct.Ar (+1.0%; P = 0.036), Tb.Ar (−0.4%; P = 0.037), Ct.Th (+1.0%; P = 0.016), Tb.BMD (+1.0%; P = 0.049), Dinn (+3.0%; P = 0.015), and BV/TV (+1.0%; P = 0.034). Baseline CTX was a significant predictor of the response to the following parameters, after adjusting for the other variables in the model (results given for a one-unit increase in CTX): Tb.BMD (+3.2%; P = 0.037), Dmeta (+3.2%; P = 0.039), and BV/TV (+3.8%; P = 0.027). At the tibia, age was a significant predictor of the response to the following parameters, after adjusting for the other variables in the model (results given for 10-year increase in age): Tb.Th (−2.0%; P = 0.033) and stiffness (−1.0%; P = 0.044). Disease duration was a significant predictor of Ct.Po (−4.0% ; P = 0.025). CTX was a significant predictor of the following parameters: Ct.Ar (+4.1%; P = 0.024), Ct.Th (+3.6%; P = 0.029), and Tb.Sp.SD (−9.9%; P = 0.009). Estrogen use in women was not a significant predictor of response.
Discussion
The results of this study provide information about changes in skeletal geometry, microarchitecture, and estimated bone strength through 2 years after successful parathyroidectomy in PHPT. Using DXA, there were improvements in areal BMD at the lumbar spine, femoral neck, and total hip starting at 6 months and persisting through 24 months. Despite there being no sustained change in areal BMD at the 1/3 or ultradistal radius sites throughout the 24 months, improvements in volumetric BMD and other parameters were noted at the radius using HRpQCT. At both the radius and tibia, we noted significant improvements in total, cortical, and trabecular volumetric BMD and cortical thickness. Although there were not any sustained changes in trabecular microarchitectural parameters at either the radius or tibia, it was noteworthy that estimated bone strength was improved after surgery at both sites, starting at 6 months and persisting through 24 months. There was further improvement in various parameters at the radius and tibia from 12 to 24 months, and at the tibia from 18 to 24 months.
In a study from our group of postmenopausal women with untreated PHPT compared with healthy controls, cortical deterioration was noted at both the radius and tibia in addition to trabecular deterioration noted at the radius, demonstrated by decreased Tb.N and Tb.Th in addition to increased Tb.Sp and Tb.Sp.SD (4). Hansen et al. also noted cortical deterioration at both sites with decreased Tb.N and borderline increased Tb.Sp at the radius in a cohort of primarily postmenopausal women with untreated PHPT (3). These results contrast with histomorphometric and microcomputed tomography analyses from iliac crest bone biopsies showing preservation of the trabecular compartment (19–21). This discrepancy in the trabecular compartment between HRpQCT and bone biopsy in PHPT may be due to site-specific differences and/or a result of the peculiarity of the iliac crest as neither a true weight-bearing nor nonweight-bearing site. In addition, bone in PHPT may appear trabecularized with cortical remnants resembling trabeculae and erroneously included in the analysis of trabecular density (22). The HRpQCT data are more consistent with clinical data regarding fracture risk in the disease. Even in the mild, asymptomatic form, PHPT is associated with an increased risk of fracture, at both vertebral and nonvertebral sites (23–25).
To our knowledge, there is only one other prospective study evaluating change in HRpQCT parameters after parathyroid surgery in PHPT (6). Hansen et al. (6) investigated a cohort of 27 women through 1 year postparathyroidectomy. They found similar improvements in BMD by DXA at the lumbar spine (+3.5 ± 4%; P < 0.01) and total hip (+2.8 ± 3%; P < 0.01) at 12 months. Using HRpQCT, at both the radius and tibia, they found similar increases in Tt.BMD, Tb.BMD, and BV/TV. However, they also noted improvements in Tb.N and Tb.Sp at the radius only, not observed in our cohort. Stiffness and failure load were improved at both the radius (+2.9 ± 6% and +3.1 ± 6%, respectively; P < 0.05 for both) and tibia (+3.3 ± 7% and +3.3 ± 6%, respectively; P < 0.05 for both), similar to the results in our cohort.
We did not find any changes in Ct.Po or trabecular microarchitectural parameters following parathyroidectomy. The 82-μm voxel size of the Xtreme CT I limits the direct quantification of porosity to relatively large Haversian canals resolvable by this technology and has been shown to underestimate porosity measurements (26). The precise identification of the transition zone between the cortical and trabecular compartments is challenging and may be especially hindered in PHPT due to changes to the endocortical and intracortical envelopes (22). In addition, trabecular parameters are derived rather than directly measured with the Xtreme CT I. These analytical issues and/or a lack of power due to relatively small numbers of subjects may have prevented us from showing differences among these parameters in our study. However, our results did demonstrate that estimated bone strength was improved at both the radius and tibia. Bone strength is determined by a number of factors, with BV/TV of particular importance (14, 27). Our data and the results from Hansen et al. (6) are consistent with cohort studies and retrospective analyses demonstrating decreased fracture risk after successful parathyroid surgery (28–30).
Multiple studies have demonstrated improvement in BMD at the lumbar spine and hip sites by 6 months postparathyroidectomy, although improvement at the radius tends to lag behind (5). Using HRpQCT, we were able to see significant improvements at the radius, comparable to the ultradistal radius site measured by DXA. Improvement in areal BMD by DXA in our cohort was greater at the lumbar spine and hip in the men than women, although these differences did not persist when adjusting for age, disease duration, and bone size. There are some data indicating a sex difference in the DXA response postparathyroidectomy (31, 32), but this has not been a consistent finding (5, 33). There was no effect of sex on volumetric BMD or other HRpQCT parameters in our cohort when adjusting for age, disease duration, or baseline levels of CTX or P1NP.
We also noted significant declines in markers of bone resorption and formation postparathyroidectomy, consistent with the published data (34–36). We found that baseline levels of CTX were associated with changes in skeletal microstructure postparathyroidectomy. This is consistent with the limited data showing more improvement in areal BMD after parathyroidectomy in subjects with higher baseline levels of bone resorption (35, 37). We also noted that subjects with a longer disease duration had more improvement in various HRpQCT parameters, which may be reassuring to patients who have been followed with mild, asymptomatic disease for many years prior to parathyroidectomy. This finding requires further investigation.
Overall, our cohort had mild, asymptomatic PHPT, consistent with the most common presentation in the developed world (2). The average serum calcium was within 1 mg/dL above the upper normal limit. The average PTH concentration was less than two times the upper normal limit, with an average 25-hydroxyvitamin D level that was replete. This is consistent with data showing that the biochemical presentation is shifting as more subjects with PHPT are vitamin D replete, with lower PTH concentrations than previous (38).
Limitations of this study include the relatively small number of men and loss to follow up in several subjects. Our study was not designed to assess differences between subjects with or without fractures. We further discussed the methodologic limitations of HRpQCT imaging previously. Changes in finite element analysis parameters have not yet been studied with regard to absolute fracture risk reduction. The strengths of this investigation include the mixed cohort of women and men with PHPT followed longitudinally through 2 years postparathyroidectomy. In addition, we applied state-of-the-art imaging technology to identify specific skeletal variables changed after successful parathyroid surgery. The use of finite element analysis with insights into improved bone strength following parathyroidectomy is another methodological strength. Our cohort had mild, asymptomatic disease, and our results are likely to apply to many subjects with PHPT.
In this study, we have shown, in a group of women and men with PHPT, improvements in skeletal volumetric bone density, geometry, and bone strength at the radius and tibia using noninvasive high-resolution imaging through 2 years after parathyroid surgery.
Abbreviations:
- BMD
bone mineral density
- BV/TV
trabecular bone volume
- Ct.Ar
cortical bone cross-sectional area
- Ct.BMD
cortical density
- Ct.Po
cortical porosity
- Ct.Th
cortical thickness
- CTX
collagen type 1 cross-linked C-telopeptide
- Dinn
inner trabecular density
- Dmeta
meta trabecular density
- DXA
dual-energy X-ray absorptiometry
- HA
hydroxyapatite
- HRpQCT
high-resolution peripheral quantitative computed tomography
- P1NP
propeptide of type I collagen
- PHPT
primary hyperparathyroidism
- PTH
parathyroid hormone
- Tb.BMD
trabecular bone density
- Tb.N
trabecular number
- Tb.Sp
trabecular separation
- Tb.Sp.SD
trabecular heterogeneity
- Tb.Th
trabecular thickness
- Tt.BMD
total bone density.
Acknowledgments
We acknowledge Julia Udesky, Wen-Wei Fan, Rukshana Majeed, and Maximo Gomez, our very helpful research coordinators.
Financial Support: This work was supported in part by National Institutes of Health Grants DK32333 and DK095944.
Disclosure Summary: N.E.C. receives research support from Shire. M.R.R. receives research support from Shire. J.P.B. is a consultant for Amgen, Radius, Shire, and Ultragenyx. B.C.S., Y.-K.D.T., J.M.W., S.A., B.O., and X.E.G. have nothing to disclose.
