


Abstract
The incidence of pancreatic neuroendocrine tumors (PNETs) is increasing. Current staging systems include nodal positivity, but the association of lymph node status and worse survival is controversial.
The study aim was to determine the prognostic significance of lymph node ratio (LNR) and compare it with nodal positivity for PNET.
A retrospective analysis of the Surveillance, Epidemiology, and End Results database between 2004 and 2011 was performed in patients who underwent a pancreatectomy with lymphadenectomy. The primary outcome was disease-specific survival (DSS).
Of the 896 patients analyzed, T stage, N stage, distant metastasis, grade, extent of resection, sex, and age ≥57 years were significantly associated with worse DSS on univariate analysis. On multivariate analysis, age ≥57 [hazard ratio (HR) 1.75, 95% confidence interval (CI), 1.12 to 2.74, P = 0.015], male sex (HR 1.58; 95% CI, 1.01 to 2.48; P = 0.046), grade (poorly differentiated/undifferentiated: HR 7.59; 95% CI, 4.71 to 12.23; P < 0.001), distant metastases (HR 2.45; 95% CI, 1.58 to 3.79; P < 0.001), and partial pancreatectomy (HR 2.55; 95% CI, 1.2 to 5.4; P = 0.015) were associated with worse DSS. Comparison between staging models constructed based on LNR cutoffs and the American Joint Committee on Cancer (AJCC) eighth edition staging system revealed that a model based on LNR ≥0.5 was superior.
LNR ≥0.5 is independently associated with worse DSS. A staging system with LNR ≥0.5 was superior to the current AJCC eighth edition staging system.
Pancreatic neuroendocrine tumors (PNETs) are rare tumors, with an incidence of 5.25 per 100,000 (1), that account for ~3% of all pancreatic neoplasms (2). The prognosis is superior to that of pancreatic adenocarcinomas, with a reported 5-year survival of 59.3% and 10-year survival of 37.7% (3). The natural history of PNETs is highly variable, with some tumors showing indolent behavior but others displaying an aggressive course, with local invasion and distant metastasis (2, 4). Higher tumor grade, distant metastasis, and older age have been consistently found to be the most important prognostic factors after PNET resection (3).
Several staging systems have been developed to better stratify prognosis in patients with PNET. The 2010 World Health Organization staging system incorporates mitotic count and Ki-67 index to separate patients into three categories (5). The eighth edition of the American Joint Committee on Cancer (AJCC) tumor–node–metastasis staging system includes primary tumor size, presence of lymph node metastasis on pathologic examination, and presence of distant metastases (6). Lymph node status is particularly important in PNET staging systems, because the presence of lymph node metastasis would render a patient stage III according to both the AJCC and European Neuroendocrine Tumor Society staging systems (6, 7). Optimal risk stratification is important because of the ever-expanding surgical and nonsurgical treatment options for patients with PNET, including somatostatin analogs (8), targeted therapies (everolimus, sunitinib) (9, 10), chemotherapy (streptozocin, 5-fluorouracil, temozolomide, capecitabine) (11), and peptide receptor radionuclide therapy (12).
The prognostic significance of lymph node metastasis in PNET is controversial. Several investigators have reported a significant association between lymph node metastasis and survival (13–15), whereas others have not found a significant association (3, 16). Lymph node ratio (LNR) is calculated based on the number of positive lymph nodes compared with the number of lymph nodes examined and has emerged as a prognostic marker possibly superior to simply assessing the presence or absence of lymph node metastasis. LNR has been evaluated in several malignancies, including pancreatic adenocarcinoma, where large studies have found it to be the most important prognostic factor among all variables considered (17, 18). Two retrospective small studies have assessed the prognostic significance of LNR in patients with PNET by using different cutoffs, with disease-free survival as the primary outcome measure (19, 20). The significance of LNR and disease-specific survival (DSS) has not been reported in patients with PNET. Furthermore, an optimal LNR cutoff in a large cohort of patients with PNET has not been identified. Optimal staging of patients with PNET is necessary to best determine which management strategies should be used both in the adjuvant setting and in those without surgically resectable disease. The purpose of this study was to determine the prognostic significance of LNR in patients with PNET and compare it with nodal positivity for PNET.
Methods
The National Cancer Institute’s Surveillance, Epidemiology, and End Results (SEER) database was used in this study. Individual cases were retrieved with the SEER*Stat software (version 8.1.5, 31 March 2014; Cancer Statistics Branch, NCI, Bethesda, MD). Because of the SEER database’s inclusion of unidentifiable patient information, this study was exempted for approval by the Office of Human Subjects Research of the National Institutes of Health.
Inclusion and exclusion criteria
Patients who received a diagnosis and underwent surgery with resection of lymph nodes for PNET between 2004 and 2011 were identified. Cases with unavailable information about the number of positive lymph nodes on examination or DSS were excluded. The following histologic subtypes were included in the analysis, based on their International Classification of Diseases for Oncology, Third Edition codes: islet cell carcinoma (8150), malignant insulinoma (8151), malignant glucagonoma (8152), malignant gastrinoma (8153), VIPoma (8155), malignant somatostatinoma (8156), malignant carcinoid (8240), goblet cell carcinoid (8243), and neuroendocrine carcinoma (8246). The following variables were included in the analysis: age at diagnosis, race, sex, year of diagnosis, primary tumor location, tumor grade, tumor functionality, AJCC T stage, AJCC N stage, number of positive lymph nodes, number of lymph nodes examined, presence of distant metastasis, type of surgery performed, and DSS. AJCC T stage was coded based on the eighth edition of the AJCC staging system based on the variables collaborative stage tumor size (2004+) and collaborative stage extension (2004+) (6). The T component of the European Neuroendocrine Tumor Society staging system was not tested separately, because it is identical to that of the eighth edition of the AJCC staging system (6, 7).
Statistical analysis
Survival analysis was performed with DSS as the primary outcome measure. To identify differences in survival between groups, the Kaplan-Meier method and the log-rank test were used for univariate analysis. A stepwise algorithm was used to identify optimal cutoffs for LNR, adequate lymphadenectomy, and lymph node positivity. For multivariate analysis, the backward selection method of Cox proportional regression analysis was used to identify independent prognostic factors, including only the variables that were significant on univariate analysis (P < 0.05). Cases with missing data were excluded from multivariate analysis.
The cutoffs that were independent predictors of worse survival were then used to construct staging models for comparison. Each model consisted of all the factors used in PNET staging, namely tumor grade, AJCC T stage, AJCC M stage, and either LNR or AJCC N stage for the nodal component of the staging system. Comparison of these models was subsequently performed with the following statistical methods that are used for staging model comparison: Akaike information criterion [AIC = −2 log maximum likelihood + 2 × degrees of freedom (df)], (21), Bayesian information criterion (BIC = −2 log maximum likelihood + log(sample size) × df) (22), corrected Akaike information criterion (AICc = −2 log maximum likelihood + [2 * n * (df + 1)/(n − df − 2)]) (23), and Harrell’s C-statistic (24). Models with lower AIC, BIC, and AICc values are considered superior, whereas models with higher C-statistics are considered superior.
Statistical tests used two-tailed P values, and P values of <0.05 were considered significant. All statistical analyses were performed in SPSS (version 21; IBM, Armonk, NY).
Results
Prognostic factors
Overall, 896 patients were identified, of whom 459 (51.2%) were men and 437 (48.8%) were women. Median age at diagnosis was 57 years. Most tumors were in the pancreatic tail (321, 35.8%), followed by the pancreatic head (288, 32.1%). Most tumors were well differentiated (WD) on histologic examination (55.7%). Most tumors were also nonfunctioning (96.4%) and nonmetastatic (75%). The median number of lymph nodes examined was 9, and the average number of lymph nodes examined was 11.4 ± 9.8. Detailed clinical, demographic, and pathologic features of the study cohort are summarized in Table 1.
Demographic, Clinical, and Pathologic Characteristics of Study Cohort
| Variable | Number of Patients (n = 896), n (%) |
|---|---|
| Age, median, y | 57 (range 17–87) |
| Sex | |
| Male | 459 (51.2%) |
| Female | 437 (48.8%) |
| Race | |
| White | 722 (80.6%) |
| African American | 90 (10%) |
| Other | 79 (8.8%) |
| Tumor location | |
| Head | 288 (32.1%) |
| Body | 97 (10.8%) |
| Tail | 321(35.8%) |
| Other | 190 (21.2%) |
| Extent of resection | |
| Local excision | 771 (86%) |
| Partial pancreatectomy | 47 (5.2%) |
| Total pancreatectomy | 78 (8.7%) |
| Grade | |
| WD | 499 (55.7%) |
| MD | 102 (11.4%) |
| PD or UD | 75 (8.4%) |
| Functionality | |
| Functioning | 32 (3.6%) |
| Nonfunctioning | 864 (96.4%) |
| AJCC T stagea | |
| T1 | 152 (17%) |
| T2 | 184 (20.5%) |
| T3 | 382 (42.6%) |
| T4 | 155 (17.3%) |
| AJCC N stage | |
| N0 | 459 (51.2%) |
| N1 | 437 (48.8%) |
| AJCC M stage | |
| M0 | 672 (75%) |
| M1 | 218 (24.3%) |
Based on the eighth edition of the AJCC staging system for PNETs.
Univariate survival analysis identified age at diagnosis >57 years (75.9 ± 1.9 months vs 81.5 ± 1.7 months, P = 0.02), male sex (76.2 ± 1.9 months vs 81.3 ± 1.7 months, P = 0.035), greater extent of resection (local excision 79.6 ± 1.4 months, partial pancreatectomy 57.7 ± 5.4 months, total pancreatectomy 81.6 ± 3.7 months, P = 0.001), higher tumor grade [WD 84.8 ± 1.7 months, moderately differentiated (MD) 76.4 ± 3.6 months, poorly differentiated (PD) or undifferentiated (UD) 40.3 ± 5.1 months, P < 0.001], higher T stage (T1 86 ± 2.9 months, T2 85.1 ± 2.2 months, T3 77.8 ± 2 months, T4 63.9 ± 3.1 months, P < 0.001), nodal positivity (73.6 ± 2 months vs 84.3 ± 1.6 months, P < 0.001), and presence of distant metastatic disease (64.3 ± 2.9 months vs 84.5 ± 1.3 months, P < 0.001) to be significantly associated with worse DSS (Fig. 1). In contrast, race, tumor location, and tumor functionality were not associated with worse DSS. On multivariate analysis, age at diagnosis >57 years [hazard ratio (HR) 1.75; 95% confidence interval (CI), 1.12 to 2.74; P = 0.015], male sex (HR 1.58; 95% CI, 1.01 to 2.48; P = 0.046), lesser extent of resection (partial pancreatectomy vs local excision: HR 2.55; 95% CI, 1.2 to 5.4; P = 0.015; total pancreatectomy vs local excision: HR 0.72; 95% CI, 0.35 to 1.46; P = 0.36), tumor grade (MD: HR 1.52; 95% CI, 0.81 to 2.84; P = 0.19; PD or UD: HR 7.59; 95% CI, 4.71 to 12.23; P < 0.001), and presence of distant metastasis (HR 2.45; 95% CI, 1.58 to 3.79; P < 0.001) were independently associated with worse DSS (Table 2).
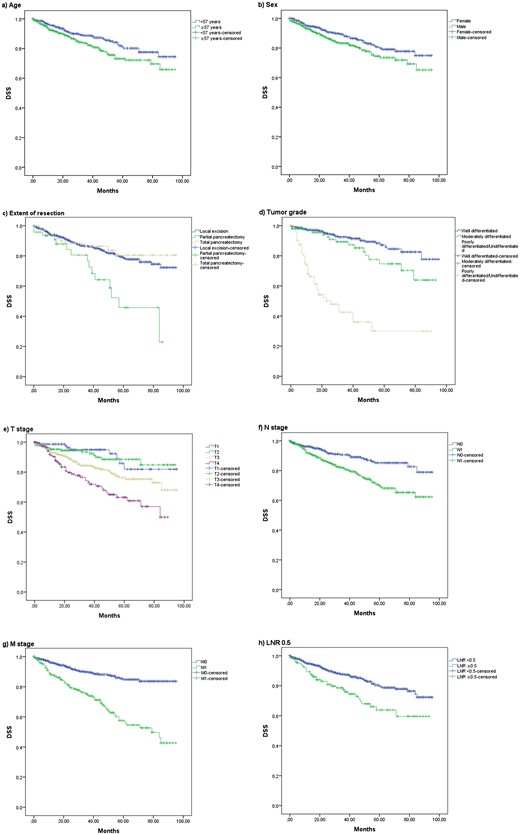
Disease-specific survival curves for (a) age, (b) sex, (c) extent of resection, (d) tumor grade, (e) T stage, (f) N stage, (g) M stage, and (h) LNR ≥0.5.
Univariate and Multivariate Analysis for DSS
| P on Univariate Analysis | HR (95% CI) | P on Multivariate Analysis | |
|---|---|---|---|
| Age | 0.02 | 0.015 | |
| <57 y | 1.00 | ||
| ≥57 y | 1.75 (1.12–2.74) | ||
| Sex | 0.035 | 0.046 | |
| Female | 1.00 | ||
| Male | 1.58 (1.01–2.48) | ||
| Race | 0.657 | — | — |
| Tumor location | 0.698 | — | — |
| Extent of resection | 0.001 | 0.026 | |
| Local excision | 1.00 | ||
| Partial pancreatectomy | 2.55 (1.2–5.4) | 0.015 | |
| Total pancreatectomy | 0.72 (0.35–1.46) | 0.36 | |
| Grade | <0.001 | <0.001 | |
| WD | 1.00 | ||
| MD | 1.52 (0.81–2.84) | 0.19 | |
| PD or UD | 7.59 (4.71–12.23) | <0.001 | |
| Functionality | 0.345 | — | — |
| AJCC T stage | <0.001 | 0.516 | |
| T1 | 1.00 | ||
| T2 | 1.74 (0.56–5.42) | 0.338 | |
| T3 | 2.06 (0.72–5.86) | 0.178 | |
| T4 | 2.23 (0.74–6.71) | 0.154 | |
| AJCC N stage | <0.001 | 0.053 | |
| N0 | 1.00 | ||
| N1 | 1.59 (0.99–2.54) | ||
| AJCC M stage | <0.001 | <0.001 | |
| M0 | 1.00 | ||
| M1 | 2.45 (1.58–3.79) |
A stepwise algorithm was used to identify whether a minimum number of lymph nodes examined was associated with improved DSS, but no cutoff was found to be significant on univariate analysis (Table 3). The same stepwise method was then used in subanalyses based on tumor location (head, body, and tail tumors) and extent of resection (local excision and partial or total pancreatectomy) to identify whether a cutoff for minimum number of lymph nodes examined could be identified for these patients, but no significant cutoff was established (Table 4). The identification of potential cutoffs for positive lymph nodes on pathologic examination was performed in a stepwise analysis. A pathological finding of either a single, two, three, four, five, or eight positive nodes was significantly associated with worse DSS. Similarly, a stepwise analysis was performed to identify an optimal cutoff for LNR, which revealed various cutoffs significantly associated with worse DSS (Table 3).
DSS by Lymph Nodes Examined, Number of Positive Lymph Nodes, and LNR, With Different Cutoffs for Each Variable
| Number of Cases Above Each Cutoff (%) | P on Univariate Analysis | P on Multivariate Analysis | HR (95% CI) | |
|---|---|---|---|---|
| Lymph nodes examined | ||||
| ≥2 | 826 (92.2%) | 0.521 | — | — |
| ≥3 | 756 (84.4%) | 0.924 | — | — |
| ≥4 | 697 (77.8%) | 0.712 | — | — |
| ≥5 | 605 (67.5%) | 0.861 | — | — |
| ≥6 | 654 (73%) | 0.957 | — | — |
| ≥7 | 605 (67.5%) | 0.861 | — | — |
| ≥8 | 517 (57.7%) | 0.501 | — | — |
| ≥9 | 475 (53%) | 0.221 | — | — |
| ≥10 | 439 (49%) | 0.375 | — | — |
| ≥15 | 264 (29.5%) | 0.55 | — | — |
| Positive lymph nodes | ||||
| ≥2 | 297 (33.1%) | 0.01 | 0.55 | 1.15 (0.74–1.78) |
| ≥3 | 214 (23.9%) | <0.001 | 0.196 | 1.34 (0.86–2.1) |
| ≥4 | 158 (17.6%) | <0.001 | 0.069 | 1.58 (0.97–2.59) |
| ≥5 | 115 (12.8%) | 0.004 | 0.201 | 1.42 (0.83–2.42) |
| ≥6 | 80 (8.9%) | 0.06 | — | — |
| ≥7 | 62 (6.9%) | 0.058 | — | — |
| ≥8 | 48 (5.4%) | 0.003 | 0.295 | 1.44 (0.73–2.84) |
| LNR | ||||
| ≥0.05 | 423 (47.2%) | <0.001 | 0.068 | 1.53 (0.97–2.43) |
| ≥0.07 | 395 (44.1%) | <0.001 | 0.045 | 1.58 (1.01–2.48) |
| ≥0.1 | 350 (39.1%) | <0.001 | 0.062 | 1.52 (0.98–2.36) |
| ≥0.2 | 262 (29.2%) | <0.001 | 0.032 | 1.62 (1.04–2.5) |
| ≥0.3 | 205 (22.9%) | <0.001 | 0.025 | 1.68 (1.07–2.63) |
| ≥0.4 | 158 (17.6%) | <0.001 | 0.114 | 1.48 (0.91–2.42) |
| ≥0.5 | 131 (14.6%) | <0.001 | 0.039 | 1.71 (1.03–2.84) |
| ≥0.6 | 94 (10.5%) | 0.021 | 0.278 | 1.41 (0.76–2.64) |
| ≥0.7 | 72 (8%) | 0.001 | 0.125 | 1.66 (0.87–3.16) |
| ≥0.8 | 63 (7%) | 0.019 | 0.078 | 1.83 (0.93–3.6) |
DSS by Lymph Nodes Examined for Different Subgroups
| Lymph Nodes Examined | Number of Cases Above Each Cutoff (%) | P on Univariate Analysis | P on Multivariate Analysis | HR (95% CI) |
|---|---|---|---|---|
| Tumor location | ||||
| Head (n = 288) | ||||
| ≥2 | 270 (93.8%) | 0.38 | — | — |
| ≥3 | 257 (89.2%) | 0.771 | — | — |
| ≥4 | 247 (85.8%) | 0.408 | — | — |
| ≥5 | 240 (83.3%) | 0.307 | — | — |
| ≥6 | 230 (79.9%) | 0.461 | — | — |
| ≥7 | 221 (76.7%) | 0.661 | — | — |
| ≥8 | 211 (73.3%) | 0.63 | — | — |
| ≥9 | 197 (68.4%) | 0.842 | — | — |
| ≥10 | 190 (66%) | 0.728 | — | — |
| ≥15 | 124 (43.1%) | 0.113 | — | — |
| Body (n = 97) | ||||
| ≥2 | 87 (89.7%) | 0.909 | — | — |
| ≥3 | 80 (82.5%) | 0.284 | — | — |
| ≥4 | 73 (75.3%) | 0.359 | — | — |
| ≥5 | 68 (70.1%) | 0.171 | — | — |
| ≥6 | 60 (61.9%) | 0.175 | — | — |
| ≥7 | 54 (55.7%) | 0.249 | — | — |
| ≥8 | 51 (52.6%) | 0.138 | — | — |
| ≥9 | 44 (45.4%) | 0.041 | 0.219 | 2.7 (0.55–13.16) |
| ≥10 | 40 (41.2%) | 0.245 | — | — |
| ≥15 | 30 (30.9%) | 0.09 | — | — |
| Tail (n = 321) | ||||
| ≥2 | 296 (92.2%) | 0.726 | ||
| ≥3 | 264 (82.2%) | 0.949 | ||
| ≥4 | 240 (74.8%) | 0.874 | ||
| ≥5 | 217 (67.6%) | 0.922 | ||
| ≥6 | 199 (62%) | 0.598 | ||
| ≥7 | 180 (56.1%) | 0.874 | ||
| ≥8 | 152 (47.4%) | 0.323 | ||
| ≥9 | 139 (43.3%) | 0.281 | ||
| ≥10 | 122 (38%) | 0.254 | ||
| ≥15 | 56 (17.4%) | 0.094 | ||
| Extent of resection | ||||
| Local excision (n = 771) | ||||
| ≥2 | 713 (92.5%) | 0.894 | ||
| ≥3 | 648 (84%) | 0.681 | ||
| ≥4 | 596 (77.3%) | 0.88 | ||
| ≥5 | 556 (72.1%) | 0.568 | ||
| ≥6 | 513 (66.5%) | 0.575 | ||
| ≥7 | 477 (61.9%) | 0.558 | ||
| ≥8 | 429 (55.6%) | 0.342 | ||
| ≥9 | 394 (51.1%) | 0.207 | ||
| ≥10 | 361 (46.8%) | 0.248 | ||
| ≥15 | 212 (27.5%) | 0.478 | ||
| Partial or total pancreatectomy (n = 125) | ||||
| ≥2 | 113 (90.4%) | 0.216 | ||
| ≥3 | 108 (86.4%) | 0.312 | ||
| ≥4 | 101 (80.8%) | 0.136 | ||
| ≥5 | 98 (78.4%) | 0.144 | ||
| ≥6 | 92 (73.6%) | 0.285 | ||
| ≥7 | 89 (71.2%) | 0.286 | ||
| ≥8 | 88 (70.4%) | 0.367 | ||
| ≥9 | 81 (64.8%) | 0.846 | ||
| ≥10 | 78 (62.4%) | 0.443 | ||
| ≥15 | 52 (41.6%) | 0.615 | ||
Multivariate analyses were performed for each cutoff of both positive lymph nodes and LNR that were significant on univariate analysis. Significant univariate variables included age >57 years, sex, extent of resection, tumor grade, T stage, and M stage. No cutoff for positive lymph nodes was found to be significant on multivariate analysis. On the contrary, various LNR cutoffs were independently associated with worse DSS (Table 3).
Comparison of different staging models to determine the optimal LNR
Each of the staging models based on LNR cutoffs that were independent prognostic factors of worse DSS were then selected for comparison. We performed this comparison by creating multivariate models containing each parameter of the standard staging process (i.e., tumor grade, AJCC T stage, and AJCC M stage), as well as LNR with direct comparison based on AIC, BIC, AICc, and C-statistic values. AIC, BIC, AICc, and C-statistic values have been used to identify optimal staging systems (25–29). Lower values indicate superior prognostic value for AIC, BIC, and AICc, whereas higher values indicate superior comparative prognostic value for the C-statistic. Among these cutoffs and models, the model using an LNR ≥0.5 had the lowest AIC (920.79), BIC (916.61), and AICc (923.01), and it also had the highest C-statistic (0.7792). In comparison, the eighth edition of the AJCC staging system (i.e., tumor grade, AJCC T stage, AJCC N stage, and AJCC M stage) had a higher AIC (923.38), BIC (919.2), and AICc (925.6), and it also had a lower C-statistic (0.7591). Notably, this was the least prognostic staging system compared with various LNR cutoffs in terms of AIC, BIC, AICc, and C-statistic (Table 5).
Comparison of Staging Models Based on LNR and AJCC Staging Systems
| Staging Model | AIC | BIC | AICc | C-Statistic |
|---|---|---|---|---|
| LNR 0.07 | 922.58 | 918.40 | 924.80 | 0.7625 |
| LNR 0.2 | 921.25 | 917.07 | 923.47 | 0.7748 |
| LNR 0.3 | 921.44 | 917.26 | 923.66 | 0.7747 |
| LNR 0.5 | 920.79 | 916.61 | 923.01 | 0.7792 |
| AJCC eighth edition | 923.38 | 919.20 | 925.60 | 0.7591 |
| N stage and LNR 0.5 | 922.50 | 917.32 | 924.78 | 0.7719 |
Discussion
Accurate assessment of a patient’s prognosis after surgery is vital to determine the best therapeutic treatment. Recently, the eighth edition of the AJCC was released to guide clinicians and patients with PNETs in assessing prognosis. In this study, the prognostic values of nodal positivity and the LNR were examined. Various LNR cutoffs were found to be significantly associated with worse DSS by multivariate analysis. A comparison of staging systems incorporating these LNR cutoffs and the eighth edition of AJCC staging system indicated that the optimal staging system incorporated T stage, M stage, LNR ≥0.5, and tumor grade.
The contribution of lymph node metastasis to prognosis is controversial in patients with PNET. Some studies suggest that lymph node metastasis is independently associated with worse disease-free survival (4, 30, 31) and overall survival (13, 14) in patients with PNET, whereas others did not find an association with overall survival (3, 16). Krampitz et al. (15) suggested that nodal positivity is associated with a shorter time to developing liver metastases and worse disease-related survival after an average of 8 years of follow up. Curran et al. (31) used the SEER database to examine the prognostic utility of nodal positivity and identified it as an independent predictor of DSS when patients were matched for grade and tumor size. In their analysis, high grade and increasing tumor size were also found to predict nodal metastasis. Nodal positivity was not found to be associated with DSS by multivariate analysis in this study. In contrast, LNR was found to be associated with DSS and should be incorporated into the PNET staging system.
Discrepancies in the results regarding the prognostic significance of lymph node metastasis may be explained by the low lymph node sampling rates for PNET, which ranged from 20.5% for enucleations to 77.2% for major anatomic resections (32). Low lymph node sampling rates result in part from the inconsistent practice of routine prophylactic lymphadenectomy in patients with PNET, with different criteria advocated by surgeons (30, 31, 33). For instance, Tsutsumi et al. (33) suggested that lymphadenectomy should be performed for all gastrinomas and nongastrinomas ≥15 mm, whereas Jiang et al. (30) proposed that routine lymphadenectomy in nonfunctional PNETs ≤25 mm is not necessary. Curran et al. (31) observed that no lymph node metastases were found in low-grade tumors that were <1 cm in patients who underwent lymphadenectomy, and thus they deemed lymphadenectomy unnecessary for these patients. However, assessing grade preoperatively by endoscopy can be difficult and not accurate. Hasegawa et al. (34) noted that the concordance rate of Ki-67 based on endoscopic fine needle aspiration and resected specimens is only 77.8%. LNR takes into account the adequacy of a lymphadenectomy, and therefore its association with DSS may be a more accurate determinant of patient prognosis with adequate lymph node resection. Nodal status as assessed by LNR is important for prognosis and should be completed in all patients with PNET.
The results of this study also demonstrate that higher nodal burden does not discriminate between low- and high-risk patients, because no cutoff number of positive lymph nodes was found to be significant on multivariate analysis. This ability of LNR to better stratify low- and high-risk patients is explained by consideration of the number of lymph nodes examined. Based on LNR, a patient with three positive lymph nodes out of four examined would be expected to have worse prognosis than a patient with three positive lymph nodes out of eight examined, whereas they would be expected to have the same prognosis if the number of positive lymph nodes were taken into consideration. If more lymph nodes were sampled, considering the low sampling rates during PNET surgery, the former patient would have a higher likelihood of having even more positive lymph nodes than the latter patient, indicating more aggressive disease behavior overall. In this way, an LNR-based staging system eliminates the variability in lymph node sampling during PNET surgery and is better able to stratify low- and high-risk patients than higher nodal burden.
The prognostic significance of LNR in PNET has been explored in two retrospective studies that used recurrence-free survival (RFS) as the primary endpoint. Ricci et al. (19) found that tumor size, Ki-67, and LNR >0.07 were independently associated with lower RFS, whereas Boninsegna et al. (20) identified LNR >0.2 and Ki-67 >5% as independent prognostic factors associated with lower RFS. These studies provide a foundation for determining whether LNR is associated with DSS, which is the most important outcome measure for staging and planning future treatment strategies. In the current study, LNRs ≥0.07 and ≥0.2 were assessed and found to be independently associated with DSS. However, we selected LNR ≥0.5 as the optimal cutoff because of a higher HR compared with LNRs ≥0.07 and ≥0.2 and improved prognostic staging when we compared the various LNR cutoffs.
The current study has several limitations, including the retrospective design and exclusion of cases based on the availability of data. Large cancer registries contain patients from different institutions and time periods and are subject to potential miscoding and missing information. In addition, there is no information on whether additional treatment was given. However, large cancer registries are the best current data available. The SEER database also does not collect information on benign tumors but instead includes tumors that have local invasion or metastatic disease. In this way, data on localized, less aggressive tumors may not be included in the current analysis. This limitation may explain why our cutoff was higher than the ones reported by other studies (19, 20). Furthermore, although an analysis to identify the minimum number of lymph nodes examined was performed, which did not reveal a significant cutoff, the results of this study are potentially limited by stage migration due to the insufficient number of lymph nodes examined. For this purpose, future prospective studies with a predetermined minimum number of lymph nodes examined could more appropriately answer this question.
In conclusion, LNR ≥0.5 is independently associated with worse DSS. A staging system with LNR ≥0.5 is superior to the current AJCC eighth edition staging system, which uses nodal positivity, and therefore LNR ≥0.5 should replace nodal positivity in future pathological staging systems.
Abbreviations:
- AIC
Akaike information criterion
- AICc
corrected Akaike information criterion
- AJCC
American Joint Committee on Cancer
- BIC
Bayesian information criterion
- CI
confidence interval
- df
degrees of freedom
- DSS
disease-specific survival
- HR
hazard ratio
- LNR
lymph node ratio
- MD
moderately differentiated
- PD
poorly differentiated
- PNET
pancreatic neuroendocrine tumor
- RFS
recurrence-free survival
- SEER
Surveillance, Epidemiology, and End Results
- UD
undifferentiated
- WD
well differentiated.
Acknowledgments
We thank Dr. Seth Steinberg and Dr. David Venzon for assistance in statistical analysis and interpretation.
Financial Support: This research was supported by the intramural research program of the Center for Cancer Research, National Cancer Institute, National Institutes of Health.
Disclosure Summary: The authors have nothing to disclose.
References
Amin MB, Edge SB, American Joint Committee on Cancer. AJCC Cancer Staging Manual. http://www.springer.com/us/book/9783319406176. Accessed 5 May 2017.
Harrell FE, Lee KL, Califf RM, Pryor DB, Rosati RA. Regression modelling strategies for improved prognostic prediction. Stat Med. 1984;3(2):143–152. http://www.ncbi.nlm.nih.gov/pubmed/6463451. Accessed 31 July 2017.
