


Abstract
Recessive mutations in TMEM38B cause type XIV osteogenesis imperfecta (OI) by dysregulating intracellular calcium flux.
Clinical and bone material phenotype description and osteoblast differentiation studies.
Natural history study in pediatric research centers.
Eight patients with type XIV OI.
Clinical examinations included bone mineral density, radiographs, echocardiography, and muscle biopsy. Bone biopsy samples (n = 3) were analyzed using histomorphometry, quantitative backscattered electron microscopy, and Raman microspectroscopy. Cellular differentiation studies were performed on proband and control osteoblasts and normal murine osteoclasts.
Type XIV OI clinical phenotype ranges from asymptomatic to severe. Previously unreported features include vertebral fractures, periosteal cloaking, coxa vara, and extraskeletal features (muscular hypotonia, cardiac abnormalities). Proband lumbar spine bone density z score was reduced [median −3.3 (range −4.77 to +0.1; n = 7)] and increased by +1.7 (1.17 to 3.0; n = 3) following bisphosphonate therapy. TMEM38B mutant bone has reduced trabecular bone volume, osteoblast, and particularly osteoclast numbers, with >80% reduction in bone resorption. Bone matrix mineralization is normal and nanoporosity low. We demonstrate a complex osteoblast differentiation defect with decreased expression of early markers and increased expression of late and mineralization-related markers. Predominance of trimeric intracellular cation channel type B over type A expression in murine osteoclasts supports an intrinsic osteoclast defect underlying low bone turnover.
OI type XIV has a bone histology, matrix mineralization, and osteoblast differentiation pattern that is distinct from OI with collagen defects. Probands are responsive to bisphosphonates and some show muscular and cardiovascular features possibly related to intracellular calcium flux abnormalities.
Osteogenesis imperfecta (OI) is a clinically and genotypically heterogeneous, heritable connective tissue disorder that results in fragile, deformed bones, short stature, and low bone mass (1). Most cases of OI are due to dominantly inherited mutations in COL1A1 or COL1A2 that affect the structure or quantity of type I collagen (types I to IV) (2, 3). Rare, mostly recessive, forms of OI are caused by defects in genes whose products are involved with collagen folding or posttranslational modification (2, 4–7).
Recessively inherited mutations in the TMEM38B gene (Online Mendelian Inheritance in Man no. 611236), which encodes the ubiquitously expressed endoplasmic reticulum (ER) protein trimeric intracellular cation channel (TRIC) type B, cause OI type XIV (Online Mendelian Inheritance in Man no. 615066). TMEM38B mutations reported to date include an exon 4 deletion among Bedouins (8, 9), an exon 1 to 2 deletion in an Albanian child (10), and two point mutations in exon 4 and intron 3 in three Chinese children (11). Using primary fibroblasts and osteoblasts (OBs) from affected individuals, we recently demonstrated that absence of TRIC-B disrupts ER calcium flux kinetics, consistent with increased activation of the PERK/ATF4 pathway of ER stress (12, 13). Expression of multiple genes for collagen-interacting proteins is altered in proband cells, leading to dysregulated type I collagen synthesis, including decreased hydroxylation of collagen helical lysine residues and intracellular retention of misfolded collagen (12). The full clinical and skeletal phenotype, bone histomorphometry, bone material properties, OB differentiation pattern, and response to bisphosphonate (BP) therapy have not previously been presented.
Materials and Methods
Clinical data, samples, and bone imaging
Clinical information and anthropometric data were taken from medical records of six patients (P1 to P6) with genetically confirmed type XIV OI attending OI specialist clinics at Birmingham Children’s Hospital (Birmingham, UK); two brothers (P7 and P8) were studied at the National Institutes of Health Clinical Center (Bethesda, MD). In both centers, all patients with clinical signs suggestive of OI are offered genetic testing using a recessive OI gene panel. Blood, bone biopsy, and DNA samples were collected from the patients and their parents after obtaining informed consent/assent. Bone densitometry, including lateral vertebral assessment (Hologic or GE Lunar iDXA) and X-rays, were taken as part of routine clinical care or OI natural history protocols. Lateral vertebral morphometry was assessed using the Genant score (14).
Bone tissue characteristics: bone histomorphometry, quantitative backscattered electron imaging, and Raman microspectroscopy
Transiliac bone biopsies were taken in P2, P4, and P7 (when naive to BP therapy) and repeated in P7 after 1 year of BP therapy. Double-labeling with tetracycline for dynamic measurement of bone formation was performed in P2 and P7. Sample preparation and histomorphometric analyses were performed using standard procedures (15). Bone mineralization density distribution (BMDD), reflecting the calcium content of bone matrix, was measured in trabecular and cortical bone by quantitative backscattered electron imaging (qBEI) as described previously (16).
Raman microspectroscopy was used to evaluate the properties of the trabecular bone mineral and organic matrix as a function of four tissue ages (17, 18): (1) between the second fluorescent label and the mineralizing front (1- to 3-day-old bone), (2) between the two fluorescent labels (4- to 20-day-old bone), (3) immediately behind the first fluorescent label (>20-day-old bone), and (4) the geometrical center of trabeculae (older bone tissue). At each tissue age, the mineral/matrix ratio, nanoporosity (a surrogate of tissue water), and glycosaminoglycan, lipid, and pyridinoline content were determined, as previously described (18). Results from bone histomorphometry, qBEI, and Raman analysis were compared with pediatric reference data from healthy subjects, and type I OI patients (17, 19–23).
Molecular studies
Genomic DNA was extracted using standard protocols. For P1 to P6, clonal sequencing using SureSelect target enrichment (Agilent Technologies) and the Illumina MiSeq platform was performed using a custom-designed gene panel. Sequence analysis using a custom bioinformatics pipeline based on open source workflow by the Broad Institute (http://www.broadinstitute.org/gatk/guide/best-practices) was undertaken using a minimum threshold of 30-fold read depth for exonic sequence and intron/exon boundary. Variants identified were filtered against polymorphism lists and assessed using the Association for Clinical Genetic Science Best Practice Guidelines (http://www.acgs.uk.com). For P7 and P8, the maternal TMEM38B mutation was detected by next-generation sequencing using a recessive OI panel (Connective Tissue Gene Tests, Allentown, PA). Subsequently, the paternal mutation was detected by deletion analysis (12).
Cell culture
Primary OB cultures were established from surgical bone chips of normal control (aged 4 years) and P7 (prepubertal, aged 13 years), as previously described (24). To induce OB differentiation, confluent cells were cultured for 30 days in α-minimum essential medium, supplemented with 10% fetal bovine serum, 1% penicillin/streptomycin, 25 μg/mL l-ascorbic acid, 10−8 M dexamethasone, and 2.5 mM 2-glycerophosphate.
Bone marrow–derived primary osteoclast (OC) cultures were generated from femora of 8-week-old C57BL/6 mice as previously described (25). Cultures were assessed for an OC phenotype by the presence of multinucleated tartrate-resistant acid phosphatase–positive stained cells (Sigma-Aldrich).
Analysis of gene expression
Total RNA was extracted from patient OB and mouse OC cultures at the indicated time points using TRI Reagent (Molecular Research Center) according to the manufacturer’s protocol, then treated with DNA-free (Life Technologies). Gene transcript levels of cell differentiation markers were quantitated by real-time polymerase chain reaction following reverse transcription using a high-capacity complementary DNA archive kit and TaqMan assays on demand (Supplemental Information 1). Relative expression of genes of interest was measured in triplicate and normalized to two reference genes (ACTB, B2M, Actb, and B2m).
Results
Molecular studies
P1 to P6 originated from three apparently unrelated Pakistani families living in Birmingham, UK, and presented with increased bone fragility and osteoporosis. Sanger sequencing confirmed that all probands were homozygous for the same c.507G>A mutation in exon 4 of TMEM38B. This mutation replaces tryptophan 169 with a stop codon (p.W169X). All obligate carrier parents were heterozygous for the mutation (Supplemental Fig. 1).
P7 and P8 were born to unrelated American parents of British/Scottish and British/German origin and found to be compound heterozygous for the previously reported deletion encompassing TMEM38B exons 1 and 2 (10) and a novel c.63dupT, which directly introduces a premature termination codon (p.D22X). Their father carries the deletion and their mother the c.63dupT allele.
Both genotypes led to a TMEM38B-null molecular outcome in fibroblast and OB cultures of P2 and P7 (who appear as probands 3 and 2, respectively, in Ref. 12).
Clinical and radiological phenotype
Expressivity of clinical OI features was highly variable (Table 1). P1 and P6 presented antenatally with bowed femora. P1 to P7 had sustained a significant low trauma fracture by 2 years of age, whereas P8 had no fractures. Two individuals were short [height < −2 standard deviations (SDs)] and overweight. P5 had nonprogressive bilateral nephrocalcinosis of unknown origin detected at birth. P7 has relative macrocephaly (58 cm, 98th centile) with normal brain magnetic resonance imaging, facial appearance, and dentition. His clinical OI phenotype was severe whereas his brother (P8) was asymptomatic, indicating incomplete penetrance. All had normal calcium and phosphate metabolism, and only P2 had consistently elevated alkaline phosphatase (ALP) levels.
Clinical Phenotype of Affected Patients
| Patient | P1 | P2 | P3 | P4 | P5 | P6 | P7 | P8 |
|---|---|---|---|---|---|---|---|---|
| Sex | Male | Male | Female | Female | Male | Female | Male | Male |
| Antenatal scan | Bowed left femur | Normal | Normal | Normal | Normal | Bowed femora | Normal | Normal |
| Birth weight at term, kg | 2.5 | 2.7 | 2.4 | 2.9 | 1.8 | 2.3 | 3.4 | 2.64 (34 wk) |
| Sclera | Gray | White | White | Blue | White | Blue | Blue | White |
| Age at first fracture, y | 0.2 | 2 | 2 | 0.3 | 0.5 | 0 | 0 | No fractures |
| Location of first recorded fracture | Vertebra | Femur | Femur | Femur | Tibia | Femur | Femur | No fractures |
| Rodding surgery location (age, y; number of operations) | Femur (2.5;1) | Femur (6.9; 1) | None | Femur (2.5; 1) | Femur (7, 1) spine (12, 2) | None | Both femora and right tibia (2–7, 7) | None |
| Developmental delay | Global | Global | None | None | Motor | Motor | None | None |
| Hearing loss | Sensorineural | Normal | Normal | Normal | Normal | Normal | Sensorineural | Normal |
| Scoliosis (Cobb angle) | None | None | None | Minimal (4°) | Moderate (50°) | None | Moderate (29°) | Minimal (2°) |
| Height z score (age, y) | −1.07 (4) | 0.2 (14.1) | −1.9 (22) | −2 (22) | −1.27 (14.6) | −1.2 (11.9) | −3 (27) | 0.1 (24) |
| Weight z score (age, y) | 1.48 (4) | 2.6 (14.1) | 1.5 (22) | 1 (22) | 0.01 (14.6) | −0.2 (11.9) | 0 (27) | 1.5 (24) |
| Body mass index z score | 3.1 | 2.4 | 1.9 | 1.7 | 0.8 | 0.6 (11.9) | 1.0 | 1.5 |
Cognitive development
P1 and P2 developed motor skills appropriately but have delayed speech and language development. P2 has a concomitant diagnosis of autistic spectrum disorder. Cognitive development is normal in P3 to P8.
Radiological findings
Long bone radiographs of all patients demonstrated osteopenia (Supplemental Fig. 2). Five patients required femoral rodding (Table 1). Interestingly, P1, whose radiographs at birth showed femoral bowing with midshaft cortical thickening, developed widespread periosteal reactions (cloaking) of all long bones at 2 months of age. A follow-up skeletal survey at 22 months of age showed resolving periosteal reaction, coxa vara, and osteopenia (Supplemental Fig. 2A–C, 2E, 2F, 2H, and 2I). In contrast, P7 has extremely thin long bones (Supplemental Fig. 2N and 2O). P1 had four to five Wormian bones around the lambdoid suture at age 2 months.
Spine and respiratory
P1 had multiple vertebral compression fractures at age 2 months that showed incomplete reshaping by 22 months (Supplemental Fig. 2A, 2D, and 2G). P2 had multiple vertebral compression fractures at presentation aged 12 years (Supplemental Fig. 2J). To date, two patients (25%) have developed scoliosis (Cobb angle > 10°), which is progressively deforming in P5 and P7. Following spinal rodding surgery at age 15 years, P5 has severe restrictive lung disease. P7 developed moderate lower airway obstruction with air trapping at age 22 years (Table 1).
Cardiovascular health
Three patients (P3, P5, and P7) displayed cardiac pathology. P3 presented at age 14 years with secondary amenorrhea, significant weight gain (body mass index of 32 kg/m2), and hirsutism. She had impaired glucose tolerance (120 minute glucose 10.4 mmol/L after oral glucose load), acanthosis nigricans, and fatty liver on ultrasound. She was started on metformin and later on a combined ethinylestradiol/cyproterone acetate contraceptive pill (combined oral contraceptive pill), upon which her hirsutism, weight gain, and periods improved. At age 16 years, she had an extensive anterior myocardial infarction secondary to a thrombus in the left anterior descending coronary artery. Her combined oral contraceptive pill was discontinued. P5 had a large congenital secundum atrial septal defect and a perimembranous ventricular septal defect. He developed heart failure, requiring surgery at age 2 months. P7’s echocardiogram at age 21 years revealed tricuspid regurgitation with an anatomically normal valve. At age 27, asymmetric septal hypertrophy of the left ventricle and mild aortic root dilation were detected. The septal hypertrophy progressed further and he developed nonobstructive hypertrophic cardiomyopathy with ST elevation and borderline right axis deviation on electrocardiogram. Cardiovascular lipid profile was normal in all eight individuals. Echocardiogram and electrocardiogram were normal in P1, P2, P4 to P6, and P8.
Muscle phenotype
P1 to P3 and P6, their unaffected siblings, and P7 and P8 have no evidence of myopathy. P4 has muscular hypotonia, which was fully investigated. Her electromyogram showed a denervating pattern with no suggestion of muscle myopathic activity. Muscle biopsy also showed no evidence of congenital myopathy, metabolic or storage disorder, or mitochondrial cytopathy. Serum lactate, basic mitochondrial DNA screen, and brain magnetic resonance imaging were normal. She walks with a Trendelenburg gait. Her brother, P5, also has moderate hypotonia associated with delayed motor milestones, and only walked without support at 3 years of age.
Clinical and radiological phenotype of heterozygous carriers
Parents of affected patients had no history of fractures and were generally healthy, with normal lumbar spine bone mineral density (BMD) where measured (z scores of 0.7 to −0.3, n = 4). Parents of P7/P8 were fully assessed. Their father, age 59 years, has macrocephaly (59 cm, >95th centile), moderate hip laxity, degenerative changes in midthoracic vertebrae, normal BMD (z score of +0.1), and occupational high-frequency hearing loss bilaterally. Echocardiogram shows concentric left ventricular hypertrophy, mildly dilated ascending aorta, and mild mitral and aortic regurgitation with normal valvular anatomy. Their mother, age 56 years, has type I diabetes mellitus and Graves disease, short stature, and normal head circumference. Radiographs show mild central compressions of lower thoracic and lumbar vertebrae, with normal BMD (z score of −0.3). Calcifications were noted in the abdominal aorta on X-rays, with annular calcification of mitral and aortic valves. She has mild midfrequency sensorineural hearing loss bilaterally.
BMD and response to BP treatment
Proband lumbar spine BMD z scores varied widely, ranging from normal (P3 and P4) to osteopenic (P6 and P8) to decreased (P2, P5, and P7), with a mean median z score of −3.3 (range, −4.77 to +0.1) in individuals old enough to be measured (P2 to P8, Table 2). Four patients were treated with BPs. Dual X-ray absorptiometry scans before and after treatment (n = 3) revealed substantial increase in BMD z score of 3, 1.7, and 1.17 SD (median, +1.7), respectively. Patients with BMD z scores within the normal range have not required BP treatment to date.
Bone Density, Fractures, and Response to Bisphosphonate Therapy
| Patient | P1 | P2 | P3 | P4 | P5 | P6 | P7 | P8 |
|---|---|---|---|---|---|---|---|---|
| Current age, y | 4 | 15 | 26 | 24 | 14.9 | 12 | 27 | 24 |
| Lumbar spine BMD z score (age, y) | Too young | −3.1 (12) | −0.5 (23) | 0.1 (21) | −2.0 (4) | −1.6 (5) | −4.77 (12)a | −1.8 (24) |
| Lumbar spine BMD z score after BP treatment (duration, y) | N/A | −0.1 (2) | N/A | N/A | −0.3 (6) | N/A | −3.6 (1) | N/A |
| BP therapy | Pamidronate, zoledronate | Zoledronate | None | None | Pamidronate, zoledronate | None | Pamidronate | None |
| Age started, y | 2 | 12 | N/A | N/A | 5 | N/A | 13 | N/A |
| Number of vertebral fractures (age, y)b | 8 (0.2) | 13 (11) | None (24) | None (21) | 3 (4) | None (12) | None (27) | None (24) |
| Number of nonvertebral fractures prior to BP treatment (location) | None | 4 (femur) | 2 (femur, radius) | 5 (femur) | 5 (tibia, femur, humerus) | 2 (femur, tibia) | 17 (lower extremity long bones) | None |
| Number of nonvertebral fractures after BPs started (location) | 2 (femur, tibia) | 0 | N/A | N/A | 1 (tibia) | N/A | 1 (tibia) | N/A |
Abbreviation: N/A, not applicable.
Lumbar spine quantitative computed tomography density z score of −2.9.
Age refers to earliest detection in patients with fractures, and latest assessment for those with none.
Evaluation of transiliac bone biopsies
Bone histomorphometry (Table 3)
Results of Bone Histomorphometry
| Parameters | Control Values (15) | P2 | P4 | P7 | OI Type I (19) |
|---|---|---|---|---|---|
| Age at biopsy, y | 11–13.9 | 12 | 12 | 13 | 7.6 ± 3.8 |
| Structural parameters | |||||
| BV/TV, % | 24.4 ± 4.3 | —a | 17.98 | 4.46 | 11.0 ± 5.2 |
| Tb.Th, μm | 148 ± 23 | 93.43 | 141.64 | 53.94 | 105.0 ± 25 |
| Tb.N, /mm | 1.66 ± 0.22 | —a | 1.27 | 0.83 | 1.3 ± 0.39 |
| Ct.Wi, mm | 0.90 ± 0.33b | 0.81a | 0.60 | 0.56 | 0.52 ± 0.20 |
| Static parameters of bone formation | |||||
| OV/BV, % | 2.12 ± 1.0 | 4.18 | 1.97 | 4.73 | 5.2 ± 2.6 |
| O.Th, µm | 6.7 ± 1.7 | 4.55 | 7.94 | 3.43 | 5.5 ± 1.7 |
| OS/BS, % | 22.1 ± 7.8 | 54.22 | 17.23 | 38.08 | 48 ± 14 |
| Ob.S/BS, % | 6.7 ± 4.5 | 2.97 | 0.96 | 8.98 | 19.4 ± 9.5 |
| Dynamic parameters of bone formation | |||||
| MS/BS, % | 11.07 ± 5.0 | 7.05 | N/A | 9.93 | 48 ± 16 |
| MAR, µm/d | 0.87 ± 0.09 | 0.92 | N/A | 0.77 | 0.73 ± 0.18 |
| Aj.AR, µm/d | 0.46 ± 0.10 | 0.12 | N/A | 0.20 | 0.35 ± 0.14 |
| BFR/BS, µm/y | 37.3 ± 16.7 | 23.77 | N/A | 27.75 | 77 ± 34 |
| BFR/BV, %/y | 49.9 ± 21.4 | 50.28 | N/A | 108.18 | 116 ± 62 |
| Mlt, d | 14.5 ± 3.00 | 37.88 | N/A | 17.18 | 16.5 (12.5–19.8) |
| Static parameters of bone resorption | |||||
| ES/BS, % | 14.9 ± 5.6 | 2.94 | 1.55 | 0 | 15.6 (13.7–21.8) |
| Oc.S/BS, % | 1.14 ± 0.74 | 0.15 | 0.10 | 0 | 1.37 (1.05–1.70) |
| N.Oc/BS, /mm | 0.29 ± 0.14 | 0.04 | 0.03 | 0 | 0.47 ± 0.29 |
For comparison, typical values for patients with OI type I are given (19). P4 did not receive tetracycline labeling.
Abbreviations: Aj.AR, adjusted apposition rate; BFR, bone formation rate; Ct.Wi, cortical thickness (width); MAR, mineral apposition rate; Mlt, mineralization lag time; MS, mineralizing surface; N/A, not applicable; N.Oc, osteoclast number; Ob.S, OB surface; Oc.S, osteoclast surface; OS, osteoid surface; O.Th, osteoid thickness; OV, osteoid volume; Tb.N, trabecular number; Tb.Th, trabecular thickness.
Sample contained only one cortical plate. Therefore, BV/TV and Tb.N could not be assessed.
Mean value from two cortical plates.
The main histomorphometric features in the transiliac biopsy samples (P2, P4, and P7) were predominance of low bone volume (BV)/total volume (TV), normal to reduced OB numbers, and very low resorption. Backscattered electron images demonstrate BV/TV below −1 SD in P4 [Fig. 1(c)] and below −4 SD (−82% from normal) in P7 [Fig. 1(d)]. Although BV/TV could not be assessed in P2, many thin and partially isolated trabecular features were viewed in the cancellous compartment [Fig. 1(a) and 1(b)]. Trabecular surfaces (in P2 and P7) were covered by an abnormally extended and thin osteoid layer resulting in a substantial increase in osteoid surface [osteoid surface/bone surface (BS)] and osteoid volume (osteoid volume/BV) (Table 3). Unlike OI caused by collagen-gene mutations, neither OB nor OC indices were increased in affected patients. In fact, OB surface/BS and mineralizing surface/BS were within normal range or decreased (P4). Interestingly, despite the low amount of trabecular bone, intense fluorescent double labels were detected in cortical bone [Fig. 1(e), P7]. P2 had focal areas of osteoid accumulation, which explains the elevated mineralization lag time and the low adjusted apposition rate. In all patients, OC and bone resorption indices were markedly decreased to <20% of healthy controls. Bone cortex had a normal thickness, lamellar pattern, and normal haversian canals.
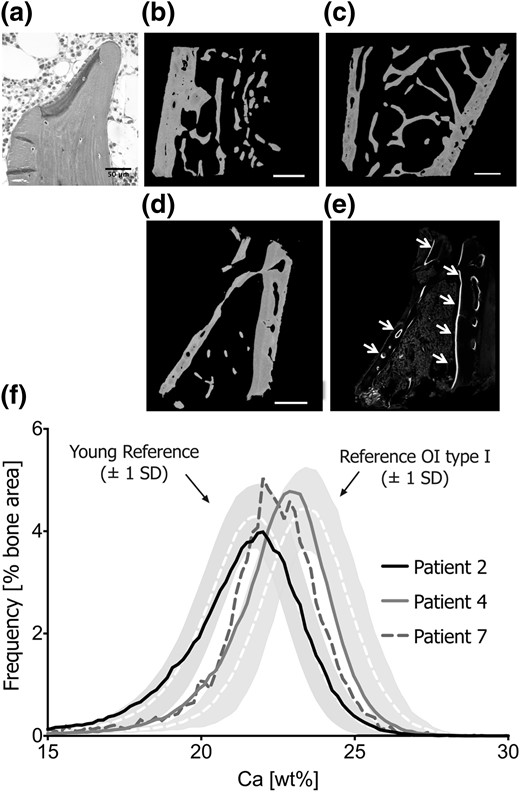
Bone tissue characteristics. Transiliac bone biopsy section of P2 under light microscopy (a) shows plump OBs forming an unmineralized matrix (dark gray). Mineralized matrix appears light gray (Goldner’s trichrome staining represents originally mineralized bone matrix in green, and osteoid in purple). Active bone formation was very rarely sighted. Backscattered images show bone biopsy samples from P2 (b), P4 (c), and P7 (c). The very low amount of trabecular bone tissue in P7’s sample is consistent with his severe skeletal phenotype. Under confocal laser-scanning microscopy, fluorescent double labels are detected on intracortical and endocortical bone surfaces (e; see white arrows), which does not reflect high bone remodeling but cortical bone apposition. (f) BMDD curves of cancellous bone of the three patients in relationship to pediatric reference values (20) and to patients with OI type I (23). Note that P4 has very low bone turnover and consequently the BMDD curve was right-shifted, reflecting higher average tissue age of the bone packets.
qBEI (Table 4)
qBEI Results From Cancellous and Cortical Bone
| BMDD Parameters | Reference Values for Controls (20) | P2 | P4a | P7b | P7 After BP Treatment | Reference Values for OI Type I (23) |
|---|---|---|---|---|---|---|
| Cancellous bone | ||||||
| CaMean, wt% Ca | 20.95 (0.57) | 20.67 | 22.09 | 21.10 | — | 22.43 (0.63) |
| CaPeak, wt% Ca | 21.66 (0.52) | 21.66 | 22.87 | 22.36 | — | 23.39 (0.57) |
| CaWidth, Δwt% Ca | 3.47 [3.12; 3.64] | 3.64 | 3.12 | 2.95 | — | 3.08 (0.28) |
| CaLow, % | 6.14 [4.90; 7.99] | 9.65 | 4.43 | 9.59 | — | 5.94 (2.05) |
| CaHigh, % | 0.89 [0.43; 1.47] | 1.24 | 3.54 | 2.03 | — | 7.54 [5.00; 11.82] |
| Cortical bone | ||||||
| CaMean, wt% Ca | 20.45 [19.68; 21.04] | 20.99 | 21.07 | 19.04 | 21.00 | 22.51 (0.46) |
| CaPeak, wt% Ca | 21.14 [20.62; 21.75] | 21.66 | 21.92 | 19.50 | 21.49 | 23.29 (0.48) |
| CaWidth, Δwt% Ca | 3.81 [3.38; 4.38] | 3.29 | 4.42 | 5.03 | 3.81 | 3.28 (0.25) |
| CaLow, % | 9.06 [6.22; 15.00] | 6.53 | 8.61 | 27.40 | 5.32 | 4.60 (0.80) |
| CaHigh, % | 0.46 [0.28; 1.22] | 0.81 | 2.33 | 0.36 | 0.44 | 8.60 (4.00) |
BMDD reference values for healthy controls (1.5 to 23 years) and OI patients (2 to 14 years) are provided as median [interquartile range] or mean (SD), as appropriate (20, 23). Note that the BMDD in healthy children has only minor variation and does not show any age dependency (20).
Only one cortex available.
High cortical bone formation.
Trabecular bone.
In P2 and P7, the average bone matrix mineralization was normal, rather than elevated as in OI type I bone. The matrix portion with low mineralization (CaLow) was slightly above both the healthy reference and OI type I ranges. In contrast, P4 had a BMDD curve that was shifted toward higher matrix mineralization [Fig. 1(f)] with increased CaMean, CaPeak, and CaHigh values, consistent with low turnover revealed on histomorphometry. In all patients, the portion of fully mineralized CaHigh was markedly lower (53% to 84%) than in OI type I.
Cortical bone.
The CaMean and CaPeak of P2 and P4 were within the normal range, although again P4 showed increased CaHigh. In contrast, P7’s cortical bone matrix before BP treatment was much less mineralized than control bone, even less than his trabecular bone (CaMean, −7%, and −10% respectively). Concomitantly, there was a threefold increase of CaLow reflecting the large portion of bone undergoing primary mineralization. The high cortical bone apposition was mirrored by strong tetracycline labeling on endocortical and intracortical surfaces [Fig. 1(E)]. After 1 year of BP therapy, P7’s cortical CaMean and CaPeak increased and CaLow decreased substantially, reflecting increasing tissue age due to the anticatabolic therapy.
Raman microspectroscopy
Mineral/matrix and mineral maturity/crystallinity ratios were within reference range of healthy children. Nanoporosity was decreased (at younger tissue ages in P2 and P7 and oldest in P4), compared with healthy controls and even lower than classical OI bone. Relative glycosaminoglycan content at the oldest tissue age was decreased in P2 and P4 and increased in P7 compared with healthy children. Lipid content was lower in P2 and P7 compared with healthy children. Finally, pyridinoline content was comparable to OI type I bone, being higher than normal at the two younger tissue ages, and normal at older ones (Supplemental Table 1).
OB and OC studies
Cultured OBs from P7 showed reduced expression of early markers of differentiation (RUNX2, SP7, COL1A1, SPARC), an increase in later markers, including those related to mineralization (ALPL, OPN, IBSP, BGLAP, DMP), and also delayed SOST expression (Fig. 2). The normal RANKL/OPG profile suggests normal functioning of the major extrinsic OC stimulation system. To explain the low bone resorption on patient bone histomorphometry, we examined OCs from murine cultures, because cultures of patient OCs were not available. We determined whether Tric-b and its coupled Ca2+ ion ([Ca2+]) channel ITPR3 were expressed in differentiated murine OCs, as well as the potential for redundancy by Tric-a and its coupled RYR3 [Ca2+] channel in this cell type (26). The results confirm marked predominant expression of the ER TRIC-B channel over TRIC-A (10- to 15-fold in mature OCs), and the inositol 1,4,5-trisphosphate receptor Itpr3 [Ca2+] efflux channel over Ryr3 (≈25-fold), respectively (Fig. 2, bottom panels).
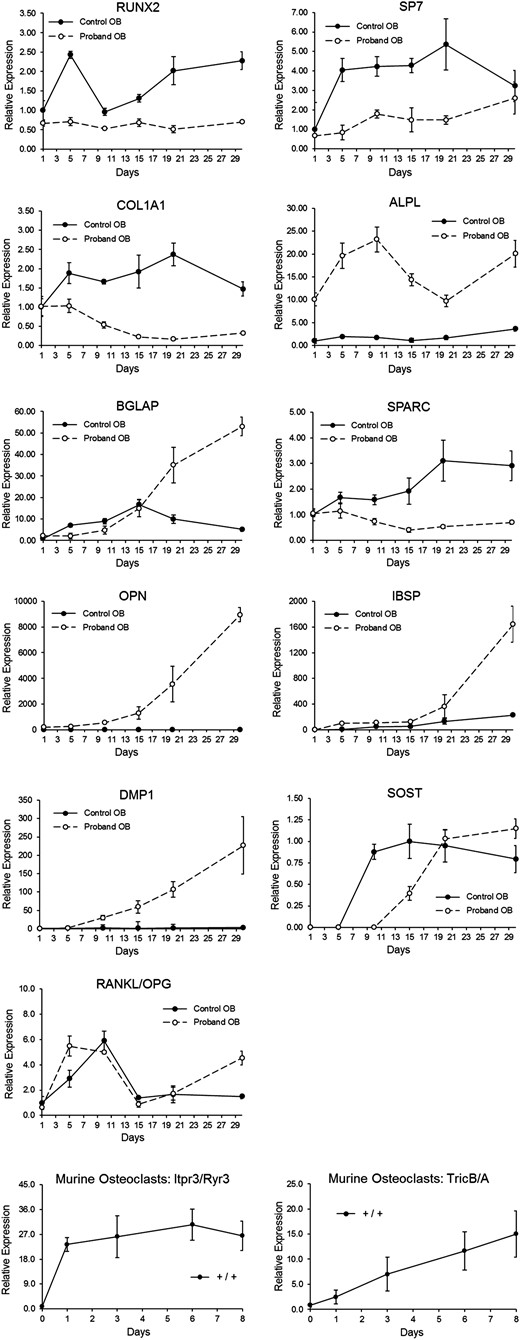
Proband (P7) OB time curve vs controls, and murine OC differentiation. OB differentiation time course (from P7) depicting relative levels of RNA transcripts for various proteins involved in collagen synthesis or bone mineralization, measured at baseline and every 5 days for 30 days. RNA transcripts included RUNX2, SP7, COL1A1, ALPL (TNSALP), BGLAP (osteocalcin), SPARC (osteonectin), OPN (osteopontin), IBSP, DMP1, SOST, and RANKL/OPG. Murine OC differentiation cultures (bottom panels) were used to measure calcium channel expressions. Itpr3/Ryr3 transcripts are equivalent to those for the human ER calcium efflux channels IP3R and RyR, and Tric-b/Tric-a transcripts are equivalent to those for the human channels TRIC-B and TRIC-A.
Discussion
TMEM38B-null mutations cause type XIV OI by disturbing ER calcium flux kinetics, which alters the function of multiple proteins in the ER (12). Type I collagen posttranslational modification displays a distinct pattern, with decreased helical and increased telopeptide lysyl hydroxylation, which contrasts with the helical overmodification typical of classical dominant OI and recessive defects in procollagen prolyl 3-hydroxylation. Procollagen in TMEM38B-null cells is also misfolded and substantially degraded intracellularly, underlying reduced collagen secretion (12). In this study, we present our extensive investigations of the type XIV OI phenotype, including its distinctive bone tissue characteristics and bone cellular defects.
The skeletal phenotype of our eight patients had variable expressivity and penetrance, ranging from barely detectable to severe. Development of scoliosis and hearing loss was also variable. We observed previously unreported features such as vertebral fractures with spontaneous reshaping, periosteal cloaking, coxa vara, and abnormal dentition. Periosteal cloaking similar to our observation in P1 appears present on radiographs of other patients with OI type XIV (8) and OI of unknown etiology (27). Such generalized cloaking may represent a response to healing long bone fractures and is not typical of classical OI. Cardiac abnormalities of different etiologies were observed in three patients, and in both carrier parents of P7/P8. P4 and P5 have muscular hypotonia. However, muscle and myocardial cells express much more TRIC-A than the ubiquitous TRIC-B (28), although TRIC-B deficiency may indirectly affect these tissues via increased ER stress. Tric-a and Tric-b double-knockout mice die in utero due to cardiac arrest, indicating a shared role of these channels in Ca2+ signaling in embryonic cardiomyocytes. Additionally, even Tric-b+/− mice are susceptible to stress-induced heart failure (28), which potentially indicates an association between the cardiac findings and the heterozygous state of P7/P8’s parents. Until more evidence becomes available, monitoring cardiovascular risk factors in affected patients may be required. Additionally, the lack of significant respiratory abnormalities in our patients contrasts with the Tric-b knockout mouse model, which shows respiratory defects with abnormal IP3R-mediated Ca2+ release in airway epithelial cells. Finally, in view of parental consanguinity, we cannot confidently attribute cognitive impairment in P1 and P2 to a TMEM38B effect in neuroepithelial tissue.
OI type XIV bone is structurally distinct from bone with type I collagen gene defects. In the absence of TRIC-B, bone tissue has low-normal OB numbers with a low mineral adjusted apposition rate and a uniform paucity of OCs. In classical OI, bone turnover and cell numbers are high, but mineral apposition rate is low, implying that many OBs produce less matrix, which is typically hypermineralized (23, 29). BMDD by qBEI in TRIC-B–deficient bone is either normal or slightly right-shifted, reflecting a situation of low bone turnover that allows more time for bone packets to mineralize (16, 30). Specifically, P4 has a high mineralization, low turnover profile similar to children with chronic kidney disease or slow growth (31). In contrast, bone from P7, with the most severe skeletal phenotype, featured active OBs on rudimental trabeculae and a lack of OCs but normal BMDD. Strikingly, his cortex showed active primary bone formation as evidenced by intense intracortical and endocortical fluorescence labeling [Fig. 2(E)] and increased cortical CaLow. Raman microspectroscopy also revealed an unaltered mineral/matrix ratio in TMEM38B mutant bone. However, similar to classical OI bone, nanoporosity, a surrogate of tissue water, was decreased at the three younger tissue ages compared with healthy controls (22). Consistently, elevated pyridinoline content at the two younger tissue ages mirrors increased or accelerated trivalent cross-links formation resulting in stiffer collagen fibers, which exhibit more “brittle-like” behavior (32). Thus, bone fragility in type XIV OI is explained by reduced trabecular bone and nanoporosity, as well as increased pyridinoline content. Despite low bone resorption, bone mineral density and cortical mineral content increased in response to BP therapy in type XIV OI patients. The observed shift toward higher, and less heterogeneous, cortical BMDD following 1 year of BP therapy is characteristic for patients with normal or lowered mineralization density (16). This contrasts sharply to classical OI bone where the hypermineralized, fully saturated matrix cannot further increase its density (29).
Differentiation of P7’s OBs demonstrated reduced expression of early markers of differentiation (RUNX2, SP7, and COL1A1), which is consistent with reduced OB numbers shown on bone biopsy, and would exacerbate the decreased collagen secretion resulting from collagen misfolding in the ER (12). Expression of the OB differentiation marker ALP is related to [Ca2+] flux because its suppression by small interfering RNA blocks BMP2-induced flux of [Ca2+] from ER to cytoplasm, raising the proposal of ALP as a monitor of intracellular calcium concentration (33). Our cell culture work suggests that this loop may also work in the reverse direction, with reduced ER [Ca2+] flux in TRIC-B–deficient cells leading to a compensatory increase in OB ALPL expression.
Calcium signaling has broad effects on pathways promoting and inhibiting mineralization. Expression of multiple genes whose products interact with [Ca2+] and/or influence mineralization are altered in type XIV OI OBs, although mineralization of type XIV OI bone tissue is not abnormal. Whereas expression of promineralization ALP/ALPL (34) is increased, there is decreased expression of osteonectin/SPARC, which initiates and promotes mineralization, and increased expression of osteocalcin/BGLAP and OPN, which inhibit crystal growth (35, 36). The SIBLING proteins BSP and OPN have generally opposing roles in promoting and opposing mineralization (37), but their concurrent increase in transcripts in TRIC-B–deficient cells is unexpected, because BSP−/− cells have increased OPN expression (38). Furthermore, SOST expression was delayed, suggesting that differentiation to osteocytes may be impaired. The complex OB gene expression pattern apparently contravenes the usual OI mechanism toward hypermineralization. Studies on the levels and interactions of these proteins in TRIC-B–deficient cells and matrix should be a focus of further investigation. In partial agreement with our patient findings, differentiated calvarial OBs of Tric-b knockout mice have normal levels of type I collagen transcripts, with decreased collagen production due to intracellular degradation (26). As in patient cells, the early differentiation markers Runx2 and Osx are reduced in murine OBs. However, Alpl, Bsp, and Bglap transcripts are reduced, whereas Sparc is normal, suggesting greater impairment of murine OB differentiation and mineralization than in patients.
An apparent intrinsic defect in OCs is another distinctive feature of type XIV OI. To investigate the low OC numbers and activity in patient bone in the context of normal OB RANKL/OPG ratios, we investigated the levels of expression of the TRIC-B/IP3R and TRIC-A/RyR paired sets of channels for K+ entry and Ca2+ efflux from the ER in normal murine OCs. Our demonstrations of 15-fold higher expression of TRIC-B relative to TRIC-A, and 25-fold higher expression of IP3R than RyR channels, support the predominance of the TRIC-B system in OCs, with minimal to no redundancy of function. Combined with patient histomorphometry and in vitro OB expression profiles, our data support an intrinsic, OB-independent, OC defect in patients with TMEM38B mutations. We speculate that interference with [Ca2+] flux kinetics in TRIC-B–null OCs impairs their response to normal developmental signals, resulting in low OC numbers and reduced bone resorption. In recent experimental data from Tric-b−/− mice (26), OC markers such as cathepsin K and Atp6v0d2 had reduced expression in newborn murine femora.
In conclusion, we describe a wide phenotypic spectrum of OI caused by TMEM38B mutations, ranging from asymptomatic to severe, and novel skeletal and potential extraskeletal features. Such phenotypic variability even with identical genotypes may reflect different ethnic and genetic backgrounds, modifiers of TMEM38B expression, or other genes involved in posttranslational modification and ER calcium flux. Although the small number of biopsies with great variability limits interpretation, bone turnover and BMDD were remarkably lower than in classical OI (23). Although normal BMDD has also been reported in OI caused by WNT1 mutations (39), WNT1-deficient patients lack the abnormalities of type I collagen posttranslational modification found in OI type XIV. The paucity of OBs and OCs and the normal BMDD with extremely reduced nanoporosity are uniquely different from classical OI. In this study, we further delineate the mechanism of bone fragility in TMEM38B mutant bone not only as a complex OB differentiation defect due to impaired ER Ca2+ flux kinetics, but also likely as an intrinsic OC defect. Despite the low bone resorption, patients still respond to BP therapy with increased BMD and cortical bone matrix mineralization. The role of TRIC-B in human OB and OC function, as well as cardiovascular or muscular health, requires further study.
Abbreviations:
- ALP
alkaline phosphatase
- BMD
bone mineral density
- BMDD
bone mineralization density distribution
- BP
bisphosphonate
- BS
bone surface
- BV
bone volume
- [Ca2+]
Ca2+ concentration
- ER
endoplasmic reticulum
- IP3R
inositol 1,4,5-trisphosphate receptor
- OB
osteoblast
- OC
osteoclast
- OI
osteogenesis imperfecta
- P
patient
- qBEI
quantitative backscattered electron imaging
- SD
standard deviation
- TRIC
trimeric intracellular cation channel
- TV
total volume.
Acknowledgments
We thank Prof. Eamonn Maher (University of Cambridge), Duncan McHale and Martin Armstrong (UCB Pharma), and Prof. David Goldstein and Slave Petrovski (Columbia University) for supervising H.T. and enabling whole exome sequencing. We thank Dr. Neil Gittoes (Queen Elizabeth Hospital Birmingham) for assisting with data collection. We also thank Daniela Gabriel, Petra Keplinger, Sonja Lueger, and Phaedra Messmer for careful sample preparations and qBEI measurements.
This study was supported by the AUVA (research funds of the Austrian Workers Compensation Board) and by the WGKK (Viennese regional health insurance fund), as well as National Institute of Child Health and Human Development/National Institutes of Health intramural funds to J.C.M.
Author contributions: M.B., H.T., and W.A.C. performed molecular studies. N.F.-Z., S.G., P.R., E.P.P., and K.K. performed bone tissue studies. E.A.W., W.H., N.J.S., V.S., N.J.C., A.A., J.V., T.C., B.M.S., and J.C.M. provided patient evaluations and reports. E.A.W., M.B., N.F.-Z., J.C.M., and W.H. drafted the manuscript. E.A.W, M.B., S.S., H.T., T.C., W.A.C., P.R., N.F.-Z., K.K., N.J.C., N.J.S., J.C.M., and W.H. revised the manuscript content.
Disclosure Summary: H.T. reports grants from UCB Pharma during the conduct of the study. The remaining authors have nothing to disclose.
References
Author notes
Address all correspondence and requests for reprints to: Wolfgang Högler, MD, DSc, Department of Endocrinology and Diabetes, Birmingham Children’s Hospital, Steelhouse Lane, Birmingham B4 6NH, United Kingdom. E-mail: [email protected].
