


Abstract
Increasing evidence suggests an association between thyroid-stimulating hormone (TSH), free thyroxine (fT4), and deiodinases with insulin resistance and type 2 diabetes mellitus (T2D).
We examined whether TSH and fT4 levels and deiodinases are causally associated with insulin resistance and T2D, using Mendelian randomization.
We selected 20 genetic variants for TSH level and four for fT4 level (identified in a genome-wide association study (GWAS) meta-analysis of European-ancestry cohorts) as instrumental variables for TSH and fT4 levels, respectively. We used summary data from GWASs on the outcomes T2D [Diabetes, Genetics Replication and Meta-analysis (DIAGRAM), n = 12,171 cases and n = 56,862 control subjects] and glycemic traits in patients without diabetes [Meta-Analyses of Glucose and Insulin-Related Traits Consortium (MAGIC), n = 46,186 for fasting glucose and insulin and n = 46,368 for hemoglobin A1c]. To examine whether the associations between TSH/fT4 levels and the study outcomes were causal, we combined the effects of the genetic instruments. Furthermore, we examined the associations among 16 variants in DIO1, DIO2, DIO3, and T2D and glycemic traits.
We found no evidence for an association between the combined genetic instrumental variables for TSH and fT4 and the study outcomes. For example, we did not observe a genetically determined association between high TSH level and T2D (odds ratio, 0.91 per standard deviation TSH increase; 95% confidence interval, 0.78 to 1.07). Selected genetic variants in DIO1 (e.g., rs7527713) were associated with measures of insulin resistance.
We found no evidence for a causal association between circulatory levels of TSH and fT4 with insulin resistance and T2D, but we found suggestive evidence that DIO1 affects glucose metabolism.
Due to the increased proportion of obesity (1, 2) and increased life expectancy (3–5), type 2 diabetes mellitus (T2D) is becoming a major public health challenge. Key mechanisms involved in T2D are insulin resistance in muscle, adipose tissue, and liver, and impaired insulin secretion due to deterioration of pancreatic β-cell function (3). As recently described by Peppa et al. (6), there is increasing evidence for the existence of an association between endocrine disorders, like disturbed thyroid function or (subclinical) hypothyroidism, and altered glucose-insulin homeostasis. For example, several studies have reported that subclinical hypothyroidism is related to insulin resistance and T2D (7, 8).
The concentration of thyroid hormones in the circulation is regulated by the hypothalamic pituitary-thyroid axis. Thyrotropin-releasing hormone secreted by the hypothalamus regulates synthesis and release of thyroid-stimulating hormone (TSH) from the pituitary gland, which stimulates the production and secretion of the thyroid hormones by the thyroid gland. Via a classical feedback loop, thyroid hormones inhibit the production of hypothalamic thyrotropin-releasing hormone and pituitary TSH. In target tissues, type 1 and 2 deiodinases convert the prohormone thyroxine into the active hormone triiodothyronine, while type 3 deiodinase converts thyroxine into inactive reverse triiodothyronine (9, 10).
It has been shown that patients with subclinical hypothyroidism have lower insulin sensitivity (7,11). In euthyroid individuals, higher free thyroxine (fT4) levels and/or lower TSH levels have been associated with a higher insulin sensitivity (11, 12) and with a lower risk of developing T2D (13). Of the deiodinases, genetic variation in deiodinase 2 has been associated with risk of T2D (14), but results between studies such as these are inconsistent (15–17). These studies suggest thyroid hormone metabolism might exert an effect on insulin sensitivity and T2D, but the biological mechanisms for these observations are largely unclear. Causality of observational associations (e.g., low TSH in euthyroid individuals and higher insulin sensitivity) cannot be ascertained because of unmeasured confounding and/or reverse causality. In case of reverse causality, insulin resistance might suppress thyroid function and, consequently, lead to relatively higher TSH and lower fT4 levels.
One method used to ascertain causality of observational associations, free of confounding and reverse causality, is Mendelian randomization (MR) (18, 19). This method uses genetic variants as instrumental variables for the exposure of interest (20). The levels of TSH and fT4 are, in part, genetically determined (21), and several loci have been identified in a large genome-wide association study (GWAS) (22). To date and to our knowledge, however, no studies have investigated the relation between genetic variants associated with TSH and fT4 concentration and glycemic traits and T2D. On the other hand, genetic variation in DIO2 has been studied before in relation to T2D, but this needs to be explored in more depth to confirm earlier results. With respect to the other deiodinases, deiodinase 1 is highly expressed in liver tissue, a pivotal organ in glucose-insulin homeostasis (23) and insulin-like growth factor-1 (IGF-1) production (24). Deiodinase 3 is an inactivation deiodinase associated with reverse triiodothyronine concentration and, thus, inhibits thyroid hormone action. However, to the best of our knowledge, no studies have been performed on deiodinase 1 and 3 in relation to insulin resistance and T2D. In addition to individual participant data, MR studies can also be conducted using the summary statistics data of previous GWAS meta-analyses (25). Within the current study, we aimed to investigate whether there is evidence for a causal association between circulatory TSH and fT4 levels and glycemic traits and T2D, using MR. Furthermore, to provide more insights into the role of thyroid function in target tissues in the pathogenesis of T2D, we additionally tested genetic variants in deiodinase 1, 2, and 3 in relation to measures of insulin resistance and T2D.
Materials and Methods
Selection of single nucleotide polymorphisms associated with TSH or fT4
For this MR study, we selected the lead single nucleotide polymorphisms (SNPs) for all genetic loci that have been shown to independently associate with the levels of TSH or fT4 (P < 5 × 10⁻⁸) as genetic instrumental variables for TSH and fT4 levels, respectively. These loci were extracted from a meta-analysis of GWASs performed by Porcu et al. (22) in individuals of European ancestry, which is the largest GWAS on TSH and fT4 level to date. This meta-analysis identified 20 independent genetic variants associated with higher serum TSH level in 26,420 individuals and four independent genetic variants associated with higher serum fT4 level in 17,520 individuals. In these meta-analyses, TSH and fT4 were standardized. The identified genetic variants explained a total of 5.64% and 2.30% of total variation in TSH and fT4 serum level, respectively. Within this GWAS analysis, all individuals with a TSH level <0.4 and >4.0 mIU/L were excluded.
Selection of SNPs associated with deiodinases
Adapted from Panicker et al. (26), we selected nine SNPs mapped in DIO1, three SNPs in DIO2, and four SNPs in DIO3, which cover 100%, 85%, and 71%, respectively, of the common HapMap-based variation in these genes (minor allele frequency, >10%) with r2 > 0.8.
Data sources and outcome definition
In this study, we used T2D and glycemic traits as outcomes. We used publicly available summary statistics datasets of two large GWASs conducted by the Diabetes, Genetics Replication and Meta-analysis (DIAGRAM) Consortium and the Meta-Analyses of Glucose and Insulin-Related Traits Consortium (MAGIC). These datasets contain the summary level meta-analysis data of these GWASs, comprising the per-allele β estimates of the SNPs on the outcomes, accompanying standard errors, and the effect alleles. The data of the DIAGRAM consortium comprised the stage 1 meta-analysis of 12 different cohort studies of European ancestry (27), including 12,171 cases of T2D and 56,862 control subjects. T2D was defined based on a fasting glucose concentration >6.9 mmol/L, treatment with glucose-lowering agents, and/or diagnosis by a general practitioner or medical specialist. The data from MAGIC comprised a meta-analysis of 21 different cohort studies of European ancestry investigating genetic variants associated with glycemic traits (28). In total, 46,186 individuals without diabetes were included in the meta-analysis. From the MAGIC, we used all glycemic traits [i.e., fasting glucose and insulin, the homeostatic model assessment for insulin resistance (HOMA-IR) and pancreatic β-cell function (HOMA-B)] as study outcomes. Within the GWAS meta-analyses, data on fasting insulin, HOMA-IR, and HOMA-B were log transformed to approximate a normal distribution. Logarithmic transformation has been shown to result in normalization of insulin-dependent data (29), and is commonly used in analyses that require normal data distribution. Additionally, we used data from a second meta-analysis of GWASs from MAGIC on hemoglobin A1c (HbA1c; N = 46,368) (30). Furthermore, we used data from MAGIC on fasting glucose and insulin that have been adjusted for body mass index (BMI), because thyroid hormone is known to be associated with BMI (31). Potential mediation of effects by BMI (e.g., effects of thyroid function on glucose metabolism through BMI) was accounted for in this analysis, and the direct effect could be studied.
Statistical analyses
To limit bias from including weak genetic instrumental variables (i.e., those that explain little of the variance in the exposure of interest), we calculated the F statistic as a measure of strength for each genetic instrument. In line with the existing literature, we considered F ≥ 10 as being of sufficient strength (32). We then explored whether any of the individual genetic instruments or genetic variants in the deiodinase genes were associated with T2D or glycemic traits. For these analyses, we corrected for multiple testing with Bonferroni, based on the number of variants included in each analysis (TSH: α = 0.05/20 = 0.0025; fT4: α = 0.05/4 = 0.0125; the DIO genes: α = 0.05/16 = 0.0031).
By performing summary level MR analyses, we aimed to separately combine the 20 genetic instrumental variables for TSH level and the four genetic instrumental variables for fT4 level to obtain a genetically determined (causal) association between the TSH and fT4 levels on the study outcomes (notably T2D, fasting glucose, insulin, HOMA-IR, HOMA-B, and HbA1c). The resulting estimate can be interpreted as the change in outcome per unit increase in genetically raised exposure of interest [e.g., change in log(odds) for T2D per standard deviation increase in genetically raised TSH levels].
Analogous to pooling estimates from different studies in conventional meta-analysis using inverse-variance weighting, we weighted this combined estimate by the inverse of the variance of the per-allele effect on the outcome (T2D or glycemic trait) for each genetic instrument. However, the effect estimate retrieved from this analysis might be biased because some of the genetic instrumental variables could be invalid because of pleiotropy. Biological pleiotropy is a phenomenon by which a genetic variant influences other traits independently of the exposure of interest of the study and thereby influences the outcome of interest, which, therefore, may bias the results of an MR study. If these pleiotropic effects across the genetic variants do not balance out, this might skew the mean genetically determined estimate of the exposure on the outcome. Such bias is formally called “directional pleiotropy.” To take into account potential bias in this study caused by directional pleiotropy, we conducted two sensitivity analyses, knowing MR-Egger regression (33) and weighted median estimator analyses (34). With MR-Egger analyses, we were able to formally test for the presence of directional pleiotropy (33). These analyses were repeated using summary-level statistics data of the GWAS analyses on fasting glucose and insulin adjusted for BMI. The unadjusted source codes for these methods for R Project for Statistical Computing, as provided online by the authors (33,34), were used for the calculations of the combined effect of the individual genetic instrumental variables. For the combined effect of the genetic instruments on the study outcomes, a two-sided P < 0.05 was considered statistically significant.
Results
Effect of individual genetic instruments for TSH or fT4 levels on various study outcomes
All individual genetic instruments for both TSH and fT4 levels had an F statistic >10 [TSH: median, 42.5 (range, 32.1–245.4); fT4: median, 52.1 (range, 34.1–132.3)] and, therefore, were considered to be of sufficient strength to be used in the current study. The associations between the individual genetic instruments for TSH levels and T2D and the glycemic traits are presented in Fig. 1. Of the individual genetic instruments, we observed an association between rs9472138 in VEGFA and T2D (Supplemental Table 1), and between rs3813582 in MAF/LOC440389 and HOMA-IR after correction for multiple testing. Within the analysis adjusted for BMI, only rs9472138 in VEGFA was associated with fasting glucose after correction for multiple testing (Fig. 2). None of the individual genetic instruments for fT4 were associated with any of the study outcomes (Supplemental Fig. 1).
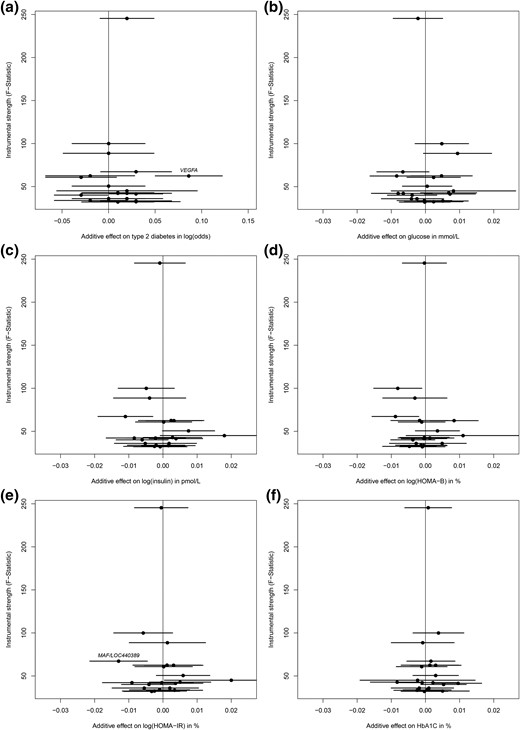
The effect for individual genetic instrumental variables for TSH levels and study outcomes. Results are displayed as the additive β estimates with 95% CIs. The x-axis presents the additive (per allele) effect for each of the individual genetic instrumental variables and the study outcome. The full written name of a gene indicates a significant association after Bonferroni correction (P = 0.0025). The associations are shown between 20 genetic markers for TSH levels and (a) type 2 diabetes mellitus, (b) fasting glucose, (c) fasting log(insulin), (d) log(HOMA-B), (e) log(HOMA-IR), and (f) HbA1C.
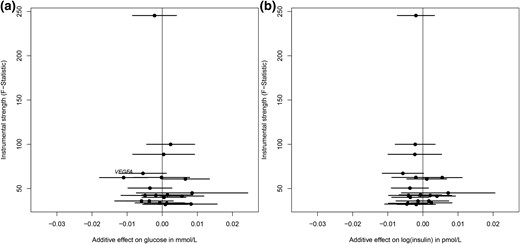
The effect for individual genetic instrumental variables for TSH levels and BMI-adjusted fasting glucose and insulin. Results are displayed as the additive β estimates with 95% CIs. The x-axis presents the additive (per allele) effect for each of the individual genetic instrumental variables and the study outcome. The full written name of a gene indicates a significant association after Bonferroni correction (P = 0.0025). (a) BMI-adjusted fasting glucose and (b) BMI-adjusted fasting log(insulin).
Combined effect of genetic instrumental variables for TSH and fT4 levels on the study outcomes
When using inverse-variance weighted analyses to combine the effects on the outcomes of the individual genetic instruments, we found no evidence of an association between TSH level and the risk of T2D [odds ratio, 0.91 per 1 standard deviation higher TSH, 95% confidence interval (CI), 0.78 to 1.07; Fig. 3; Table 1]. Furthermore, again using inverse-variance weighted analyses, we found no evidence that there was an association between TSH level and the other studied glycemic traits, such as fasting glucose and insulin. The mean effect estimates remained similar with MR-Egger regression and median weighted estimator analyses. Nevertheless, we found some suggestive evidence using median weighted estimator analysis that there might be an association between a higher TSH level and lower risk of T2D (β = −0.139; 95% CI, −0.301 to 0.023). We found no evidence, using MR-Egger regression analysis, that the intercept deviated from zero, which indicates that we found no evidence that the effect estimates were biased due to directional pleiotropy. In addition, similar results were observed when we used the GWAS datasets on glycemic traits adjusted for BMI (results not shown). Similarly, we did not find evidence for an association between a higher fT4 level and any of the study outcomes (Table 1; Supplemental Fig. 2).

The combined effect of the individual genetic instrumental variables for TSH levels on the study outcomes. Results of the individual genetic instruments for TSH levels are displayed as the causal effect on study outcome with 95% CIs per SD higher serum level of TSH. The solid line represents the regression line of the inverse-variance weighted approach to combine the individual genetic instruments. The dashed line represents the regression line of the MR-Egger regression analysis to combine the individual genetic instruments. Data presented for (a) type 2 diabetes mellitus, (b) fasting glucose, (c) fasting log(insulin), (d) log(HOMA-B), (e) log(HOMA-IR), and (f) HbA1c. SD, standard deviation.
MR Estimates
| T2D [log(odds)] | Glucose, mmol/L | Log(insulin), pmol/L | Log(HOMA-IR), % | Log(HOMA-B), % | HbA1c, % | |
|---|---|---|---|---|---|---|
| TSH | ||||||
| Inverse-variance weighted | −0.092 (−0.251 to 0.067) | 0.001 (−0.029 to 0.030) | −0.012 (−0.041 to 0.016) | −0.009 (−0.039 to 0.022) | −0.011 (−0.035 to 0.013) | 0.010 (−0.012 to 0.032) |
| MR Egger | ||||||
| Intercept | 0.002 (−0.039 to 0.042) | −0.002 (−0.009 to 0.006) | −0.001 (−0.008 to 0.001) | −0.001 (−0.009 to 0.007) | 9.3x10⁻⁵(−0.006 to 0.006) | 0.001 (−0.004 to 0.007) |
| Estimate | −0.113 (−0.469 to 0.244) | 0.019 (−0.061 to 0.099) | 0.001 (−0.100 to 0.095) | 0.009 (−0.077 to 0.095) | −0.012 (−0.084 to 0.059) | −0.006 (−0.077 to 0.066) |
| Weighted median estimator | −0.139 (−0.301 to 0.023) | −0.005 (−0.042 to 0.033) | −0.009 (−0.046 to 0.028) | −0.002 (−0.040 to 0.037) | −0.007 (−0.039 to 0.0248) | 0.003 (−0.027 to 0.033) |
| fT4 | ||||||
| Inverse-variance weighted | 0.099 (−0.066 to 0.265) | 0.003 (−0.043 to 0.050) | 0.016 (−0.021 to 0.052) | 0.013 (−0.025 to 0.052) | 0.0127 (−0.019 to 0.044) | −0.008 (−0.041 to 0.025) |
| MR Egger | ||||||
| Intercept | 0.017 (−0.038 to 0.071) | 0.017 (−0.019 to 0.054) | −0.010 (−0.037 to 0.017) | −0.006 (−0.030 to 0.019) | −0.013 (−0.036 to 0.010) | −0.002 (−0.019 to 0.015) |
| Estimate | −0.040 (−1.325 to 1.245) | −0.146 (−0.469 to 0.178) | 0.103 (−0.244 to 0.450) | 0.061 (−0.271 to 0.394) | 0.123 (−0.159 to 0.407) | 0.008 (−0.257 to 0.274) |
| Weighted median estimator | 0.087 (−0.096 to 0.270) | −0.020 (−0.064 to 0.024) | 0.024 (−0.018 to 0.067) | 0.018 (−0.028 to 0.065) | 0.005 (−0.034 to 0.043) | −0.006 (−0.043 to 0.031) |
Effect of genetic variation in deiodinases and the study outcomes
After correction for multiple testing (Table 2), the genetic variants rs11206237, rs2268181, and rs7527713 mapped in DIO1 were significantly associated with fasting insulin [βadditive = −0.018 pmol/L (95% CI, −0.029 to −0.007); βadditive = 0.019 pmol/L (95% CI, 0.008 to 0.030); βadditive = −0.018 pmol/L (95% CI, −0.028 to −0.008), respectively], and with HOMA-IR [βadditive = −0.018 pmol/L (95% CI, −0.029 to −0.007); βadditive = 0.020 pmol/L (95% CI, 0.009–0.031); βadditive = −0.019 (95%, CI, −0.029 to −0.009), respectively]. In addition, rs7527713 in DIO1 was associated with HOMA-B (βadditive = −0.014; 95% CI −0.023 to −0.005). None of the three genetic variants in DIO2 and none of the four SNPs in DIO3 was significantly associated with T2D or any of the glycemic traits.
The Association Between Genetic Variants for Deiodinases and the Study Outcomes
| T2D [log(odds)] | Glucose, mmol/L | Log (insulin), pmol/L | Log (HOMA-IR), % | Log (HOMA-B), % | HbA1c, % | |
|---|---|---|---|---|---|---|
| DIO1 | ||||||
| rs11206237 | 0.010 (−0.041 to 0.058) | −0.004 (−0.014 to 0.006) | −0.018 (−0.029 to −0.007)a | −0.018 (−0.029 to −0.007)a | −0.010 (−0.019 to −0.001) | 0.004 (−0.005 to 0.014) |
| rs11206244 | 0.000 (−0.041 to 0.039) | −0.001 (−0.009 to 0.007) | 0.003 (−0.005 to 0.012) | 0.003 (−0.006 to 0.012) | 0.003 (−0.004 to 0.011) | 0.001 (−0.007 to 0.008) |
| rs2235544 | 0.010 (−0.020 to 0.049) | −0.003 (−0.011 to 0.004) | 0.003 (−0.004 to 0.011) | 0.002 (−0.006 to 0.010) | 0.004 (−0.003 to 0.010 | −0.001 (−0.008 to 0.006) |
| rs2268181 | 0.010 (−0.041 to 0.058) | 0.005 (−0.005 to 0.015) | 0.019 (0.008 to 0.030)a | 0.020 (0.009 to 0.031)a | 0.011 (0.002 to 0.020) | −0.003 (−0.012 to 0.006) |
| rs2294511 | 0.010 (−0.030 to 0.049) | 0.001 (−0.008 to 0.010) | −0.007 (−0.016 to 0.003) | −0.005 (−0.015 to 0.006) | −0.006 (−0.014 to 0.002) | 0.004 (−0.003 to 0.012) |
| rs2294512 | 0.030 (−0.010 to 0.068) | −0.003 (−0.011 to 0.005) | −0.003 (−0.011 to 0.006) | −0.004 (−0.012 to 0.005) | −0.001 (−0.008 to 0.006) | −0.001 (−0.008 to 0.007) |
| rs4926616 | 0.020 (−0.030 to 0.058) | −0.003 (−0.012 to 0.006) | 0.008 (−0.001 to 0.018) | 0.005 (−0.005 to 0.015) | 0.007 (−0.001 to 0.015) | −0.006 (−0.014 to 0.002) |
| rs731828 | 0.010 (−0.030 to 0.039) | −0.004 (−0.011 to 0.004) | −0.005 (−0.013 to 0.003) | −0.005 (−0.013 to 0.003) | −0.000 (−0.007 to 0.006) | −0.002 (−0.009 to 0.005) |
| rs7527713 | 0.020 (−0.020 to 0.068) | −0.002 (−0.011 to 0.008) | −0.018 (−0.028 to −0.008)a | −0.019 (−0.029 to −0.009)a | −0.014 (−0.023 to −0.005)a | 0.006 (−0.003 to 0.014) |
| DIO2 | ||||||
| rs225011 | 0.000 (−0.030 to 0.039) | −0.001 (−0.009 to 0.006) | −0.003 (−0.010 to 0.005) | −0.002 (−0.010 to 0.006) | 0.001 (−0.006 to 0.007) | −0.001 (−0.007 to 0.006) |
| rs225014 | 0.010 (−0.030 to 0.049) | −0.002 (−0.009 to 0.006) | 0.000 (−0.008 to 0.008) | 0.001 (−0.008 to 0.009) | 0.002 (−0.005 to 0.009) | −0.003 (−0.010 to 0.004) |
| rs225015 | 0.010 (−0.030 to 0.049) | 0.003 (−0.005 to 0.011) | 0.002 (−0.006 to 0.010) | 0.001 (−0.007 to 0.010) | −0.001 (−0.008 to 0.006) | 0.003 (−0.004 to 0.010) |
| DIO3 | ||||||
| rs17716499 | 0.020 (−0.030 to 0.068) | 0.005 (−0.003 to 0.013) | 0.003 (−0.006 to 0.011) | 0.003 (−0.006 to 0.012) | −0.000 (−0.007 to 0.007) | 0.002 (−0.006 to 0.010) |
| rs7150269 | 0.010 (−0.030 to 0.049) | 0.011 (0.003 to 0.019) | 0.001 (−0.008 to 0.009) | 0.002 (−0.007 to 0.011) | −0.002 (−0.009 to 0.005) | 0.000 (−0.008 to 0.008) |
| rs8011440 | 0.010 (−0.030 to 0.058) | −0.008 (−0.017 to 0.001) | −0.002 (−0.011 to 0.007) | −0.002 (−0.012 to 0.007) | 0.001 (−0.007 to 0.009) | −0.001 (−0.009 to 0.008) |
| rs945006 | 0.049 (−0.041 to 0.140) | 0.003 (−0.014 to 0.019) | −0.009 (−0.027 to 0.008) | −0.006 (−0.024 to 0.012) | −0.002 (−0.016 to 0.011) | −0.006 (−0.020 to 0.008) |
Data presented as additive β coefficients with 95% CI.
Significant association after correction for multiple testing (P < 0.0031).
Discussion
In this study, we used MR analyses to examine whether the previously described observational associations between subclinical hypothyroidism, characterized by high TSH levels and fT4 levels within the normal range, with measures of insulin resistance and T2D (7,8) are causal. Within this study, we did not find evidence that the association between TSH and fT4 (as determined in a population with TSH levels between >0.4 and <4.0 mIU/L) with T2D and glycemic traits (i.e., fasting glucose and insulin, HOMA-IR, HOMA-B, and HbA1c) is causal. However, although effect sizes were relatively small, we found suggestive evidence for an association between selected genetic variants in DIO1 with glycemic traits, but not with T2D.
The lack of a genetically determined (causal) association between TSH/fT4 levels and measures of glucose metabolism suggests that the previously observed association between subclinical hypothyroidism and insulin resistance might be explained by reverse causality or residual confounding. In case of reverse causality, progression of insulin resistance and T2D influences TSH and thyroid hormone levels (35). In addition, unmeasured or unknown factors not taken into account as confounding variables in the observational studies might have affected the observed association between subclinical hypothyroidism and insulin resistance.
In this study, two genetic variants associated with TSH level showed a significant association with the study outcomes after correction for multiple testing. The genetic variant rs3813582 was significantly associated with HOMA-IR. This polymorphism is a noncoding variant in an exonic region of the LOC440389/MAF gene, associated with increased thyroid volume (36), a condition more frequently found in patients with insulin resistance (37). However, the allele that has been associated with higher TSH concentration (22) was associated with lower insulin resistance in the data from the MAGIC. Gene expression of LOC440389/MAF was previously found to be higher in thyroid tissue compared with skeletal muscle, which might suggest a more thyroid-specific function (36). Further studies are required to gain more information about this SNP and its potential effect on insulin resistance beyond the effects through TSH.
Moreover, we observed that rs9472138 in VEGFA was associated with T2D and fasting glucose after adjustment for BMI. VEGFA encodes a growth factor important in angiogenesis, which is critical for thyroid function because of the high vascularization of this organ for the continuous supply of iodine to synthesize thyroid hormones (38). Genetic variation in VEGFA has not been significantly related to T2D in GWASs. Nevertheless, it might still be a novel genetic predictor for T2D. Previous work already suggested that VEGFA gene variants were associated with diabetic nephropathy (39). Based on our results, we hypothesize that this association is independent of TSH level, and that VEGFA is involved in multiple biological pathways.
In the literature, there is evidence of an association between deiodinases and the onset of insulin resistance (14). The most studied polymorphism in the deiodinases in relation to insulin resistance and T2D is rs225014 in DIO2, which has a high allele frequency in various ethnic groups (16). However, previous studies have shown contradictory results (15, 17). In this study, we assessed the role of deiodinases on insulin resistance and T2D, using genetic variants in the deiodinase genes that cover the gene as much as possible (26). We observed genetic variation in DIO1 to be significantly associated with fasting insulin, HOMA-IR, and HOMA-B. In the data from DIAGRAM and MAGIC, we did not find a significant association between the previously described polymorphism in DIO2 and increased risk for T2D and any of the glycemic traits in individuals of European ancestry. The discrepancy in the results can be explained by the smaller sample size of the previous studies and by the differences in ethnic background of the different cohorts examining the relationship. However, we showed there might be a minor effect of deiodinase 1 on insulin resistance. To the best of our knowledge, no data are yet available about this mechanism; therefore, it will require further studies. Speculatively, polymorphisms in DIO1 are highly expressed in liver tissue (23) and have been associated with IGF-1 and IGF-1–related end points, such as body height and skeletal muscle mass (24). Skeletal muscle is an important organ for insulin-stimulated glucose uptake and a lower relative muscle mass was associated with insulin resistance (40). However, this hypothesis should be explored in more detail in future studies.
Strengths of this study include the large sample size of the study populations and the use of summary statistics data, which increases efficiency. A limitation of our study was that the 20 independent loci associated with the level of TSH only explained 5.64% of the total variation in TSH concentration, and only 2.30% for fT4 (22). Nevertheless, the F statistics of all individual genetic instrumental variables was >10, which should greatly limit the likelihood of weak instrumental variable bias (32). Additional insights could be provided by the identification of additional loci that are associated with TSH and fT4 concentrations. However, the effect sizes of these newly identified loci will probably be lower or they will have a smaller allele frequency. In both cases, the strength of the instrumental variables will be lower, and the contribution of these genetic instrumental variables in the combined effect will be lower as well. Another limitation is that the genetic contribution to TSH and fT4 concentrations is different between men and women (22), and (subclinical) hypothyroidism was more frequent in women than in men (41). The datasets of the study outcomes were not available stratified by sex; therefore, we were not able to address the research questions separately for men and women. Furthermore, because the genetic instrumental variables, as well as the summary statistics, originated from populations of European ancestry, our results may not be generalized to populations of non-European ancestry. A last limitation might be that the GWAS on TSH and fT4 was only performed in euthyroid individuals. However, because the combined score of the 20 identified genetic variants associated with TSH was also associated with a higher risk of having an extremely high TSH level (22), results might be also applicable for patients beyond the normal TSH range.
Taken together, the results of this study indicate no causal association between genetically determined circulatory TSH and fT4 levels and higher risk of T2D. This conclusion was supported by the lack of significant association between genetically determined circulatory TSH and fT4 with glycemic traits. Moreover, we did observe an association between genetic variants in DIO1 and insulin resistance, which might suggest that thyroid metabolism affects glucose metabolism in target tissues.
Abbreviations:
- BMI
body mass index
- CI
confidence interval
- DIAGRAM
Diabetes, Genetics Replication and Meta-analysis
- fT4
free thyroxine
- GWAS
genome-wide association study
- HbA1c
hemoglobin A1c
- HOMA-B
homeostatic model assessment for pancreatic β-cell function
- HOMA-IR
homeostatic model assessment for insulin resistance
- IGF-1
insulin-like growth factor-1
- MAGIC
Meta-Analyses of Glucose and Insulin-Related Traits Consortium
- MR
Mendelian randomization
- T2D
type 2 diabetes mellitus
- TSH
thyroid-stimulating hormone.
Acknowledgments
We thank the DIAGRAM and MAGIC consortia for making the results files of their meta-analyses available.
This study was funded by the European Commission-funded projects HUMAN (Grant Health-2013-INNOVATION-1-602757) and THYRAGE (Horizon 2020 research and innovation program under Grant Agreement Number 666869).
Disclosure Summary: The authors have nothing to disclose.
References
Author notes
Address all correspondence and requests for reprints to: Raymond Noordam, PhD, Department of Gerontology and Geriatrics, Leiden University Medical Center, PO Box 9600, 2300 RC Leiden, The Netherlands. E-mail: [email protected].
