


Abstract
Anaplastic thyroid cancer (ATC) is rare and a highly fatal malignancy. The role of programmed death-1 (PD-1) and programmed death ligand-1 (PD-L1) as prognostic and/or predictive markers in ATC is unknown.
Multimodal therapy offers the best chance at tumor control. The objective of this study was to detect potential associations of PD-1/PD-L1 axis variables with outcome data in ATC.
Retrospective study of a uniformly treated cohort.
Single institution retrospective cohort study.
Sixteen patients who received intensity-modulated radiation therapy (15 had preceding surgery) were studied.
Patients treated with multimodal therapy were followed and assessed for overall survival (OS) and progression-free survival (PFS).
All samples demonstrated PD-1 expression in inflammatory cells whereas tumor cells were primarily negative. PD-L1 was expressed on ATC tumor cells in most samples and showed mainly membranous staining. High PD-1 expression (>40% staining) in inflammatory cells was associated with worse overall survival (OS; hazard ratio, 3.36; 95% confidence interval, 1.00 to 12.96; P < 0.05) and trended toward worse PFS, whereas high PD-L1 expression in tumor cells (>33% staining) trended toward worse PFS and OS.
PD-1/PD-L1 pathway proteins are highly expressed in ATC tumor samples and appear to represent predictive markers of PFS and OS in multimodality-treated ATC patients.
Thyroid cancer incidence is rising, in large part due to indolent small papillary thyroid cancers, most of which have excellent long-term prognoses (1). However, a small group of patients with thyroid cancer do have advanced disease, and their mortality rates are much higher. Anaplastic thyroid cancer (ATC), the most lethal of any human cancer, accounts disproportionally for deaths related to thyroid cancer.
ATC is a subset of thyroid cancer that is undifferentiated, exhibits rapid growth, and is almost universally fatal (2). To be effective, treatment of ATC must be instituted expeditiously and requires multidisciplinary input. Doxorubicin is the only Food and Drug Administration–approved systemic therapy option, but it has very limited efficacy (3). To date, the most efficacious approach involves chemoradiation therapy with or without surgical resection. Data from our group has demonstrated that in stage IVA and IVB ATC, multimodal therapy with chemoradiation is associated with improved outcomes (4). However, most of these patients, and nearly all stage IVC patients, ultimately die of their disease. Newer therapies are therefore desperately needed.
Malignancies often subvert the inherent mechanisms of immune system regulation to “hide” from active immune surveillance. Checkpoint inhibitors, such as cytotoxic T lymphocyte–associated protein 4 inhibitors and programmed death ligand-1 (PD-L1) inhibitors, have shown efficacy in overcoming this immune suppression in a subset of patients with melanoma, lung cancer, and many other malignancies (5–7). The roles of these checkpoint inhibitors in thyroid cancer remain unknown, but they are being investigated. Recent reports demonstrate expression patterns of programmed death-1 (PD-1) and PD-L1 in differentiated thyroid cancer (DTC) (8–10); however, the role of PD-1 and PD-L1 as predictive and/or prognostic markers is lacking in ATC.
We have previously reported on a small cohort of ATC patients treated with a multimodal therapy protocol who experience apparently improved overall survival (OS) (11). We have since treated additional patients using the same approach, validating initial results (4). The objective of this retrospective study was to examine the roles of PD-1 and PD-L1 in defining the prognosis of this uniformly treated cohort of ATC patients.
Methods
Patients and clinical data
This is a single-institution, retrospective cohort study approved by the Mayo Clinic Institutional Review Board. Only patients who had provided prior informed consent for research purposes, received all or part of their care at the Mayo Clinic, and had tissue available for analysis were included. Patients were identified from our institutional database, and only patients treated with a multimodal protocol using chemoradiation with or without surgery were included. Patients were treated between 1 January 2003 and 31 December 2015.
Inclusion criteria included patients with newly diagnosed, histologically confirmed ATC. Pathological samples were rereviewed by K.M.R. for the study. Patients with poorly differentiated thyroid cancer, or tumors that were diagnosed only at autopsy or by death certificate, were excluded. Patients who were treated under the Radiation Therapy Oncology Group trial 0912 were also excluded.
Information for each patient was collected from the electronic medical records, including demographic characteristics, pathologic characteristics, and details of treatment modalities, response, and follow-up for vital status. Survival endpoints and follow-up were documented through January 2016. Standard American Joint Committee on Cancer staging was used to define stages IVA, IVB, and IVC.
Immunohistochemistry
Pathologist-assessed tissues were blinded to patient outcomes. For conventional microscopic examinations, representative sections of the tumor were fixed in formalin, routinely processed, embedded in paraffin, cut at 4 μm, and stained with hematoxylin and eosin. Additional sections were cut for immunohistochemistry per the clinical method used in the laboratory at the time. Briefly, PD-L1 staining was performed using the E1L3N clone from Cell Signaling Technology (Danvers, MA) at a 1:750 dilution with a 64-minute Cell Conditioning Solution 1 pretreatment for antigen retrieval with OptiView and adenosine 5′-monophosphate detection (diaminobenzidine) on the BenchMark XT platform from Ventana Medical Systems (Tucson, AZ). PD-1 (CD279) staining was performed using the NAT105 clone from Abcam (Cambridge, MA) at a 1:200 dilution with a 32-minute Cell Conditioning Solution 1 pretreatment for antigen retrieval with OptiView detection (diaminobenzidine) on the BenchMark XT platform from Ventana Medical Systems (Tucson, AZ). Appropriate positive and negative controls were included in each sample run to assure reliability of IHC assessment. Stains were initially scored for intensity of staining (0 to 3), percentage of cells staining (0% to 100%), cell type, and stain localization from which an Allred-like score was calculated for all samples (12). A score of 0–5 was given as follows: no staining (0), ≤1% (1), 1% to 10% (2), 11% to 33% (3), 34% to 66% (4), and 67% to 100% (5), respectively. Intensity of staining was scored as: 0, negative; 1, weak; 2, intermediate; and 3, strong. Scores from percentage staining and intensity were added to get the final score. Samples were considered positive if the Allred-like score was ≥3. PD-L1 high vs low and PD-1 high vs low for tumor and inflammatory cells, respectively, were determined arbitrarily with respect to the median percentage staining for each group. For example, median percentage staining for PD-L1 in tumor cells was 33%, and hence ≤33% was designated as PD-L1 low and >33% was designated as PD-L1 high.
Statistical analysis
To calculate survival endpoints, the date of diagnosis (date of biopsy, imaging, or clinic visit documenting diagnosis), date of locoregional recurrence and/or distant metastasis (date of biopsy or the date of imaging or clinic visit documenting recurrence), and date of death or last follow-up were used. OS was considered based on death from any cause. Progression was defined as the earliest date of development of any locoregional relapse, distant metastasis, or death. Patients were followed from the date of diagnosis to the earliest date for each endpoint, or were censored at last follow-up. OS and progression-free survival (PFS) were summarized using the Kaplan–Meier method, and the median survival time was reported. Hazard ratios, 95% profile likelihood-based confidence intervals, and likelihood ratio tests were calculated using Cox proportional hazards models. All analyses were performed using SAS version 9.4 (SAS Institute, Cary, NC) or R version 3.1.1 (13), and P values of <0.05 were considered statistically significant.
Results
We identified 54 patients from our records with the diagnosis of ATC in the prespecified study period. Five patients were excluded, as they were treated as part of the Radiation Therapy and Oncology Group protocol, and one patient did not have research authorization and was excluded. Of the remaining 48 patients, 18 were treated with palliative radiation therapy or best supportive care and did not receive multimodal therapy, and they were also excluded from analysis. Sixteen of the remaining 30 patients had sufficient tissue for testing. Patient and treatment characteristics are noted in Table 1. Eleven patients were male (69%), and median age was 58 (range, 37 to 83) years. Most patients had stage IVB disease (n = 13, 81%). There were two (13%) with stage IVC and one (6%) with stage IVA disease at diagnosis. Of the 16 samples, 10 (63%) showed pure ATC with no evidence of prior DTC, whereas the remaining six (38%) showed evidence of concomitant DTC in the same pathologic samples.
Patient and Treatment Characteristics by PD-1 High (>40%) vs Low (≤40%) Expression in Inflammatory Cells, and PD-L1 High (> 33%) vs Low (≤ 33%) Expression in Tumor Cells
| PD-1 Expression in
Inflammatory Cells [N (%)] | PD-L1 Expression in
Tumor Cells [N (%)] | Total Patients [N (%)] | |||
|---|---|---|---|---|---|
| High (>40%) | Low (≤40%) | High (>33%) | Low (≤33%) | ||
| Sex | |||||
| Male | 5 (71) | 6 (67) | 5 (83) | 6 (60) | 11 (69) |
| Female | 2 (29) | 3 (33) | 1 (17) | 4 (40) | 5 (31) |
| Race | |||||
| White | 6 (86) | 9 (100) | 5 (83) | 10 (100) | 15 (94) |
| Black | 1 (14) | 0 | 1 (17) | 0 | 1 (6) |
| Median age, y | 55 (range, 45–71) | 60 (range, 37–83) | 60 (range, 50–71) | 57 (range, 37–83) | 58 (range, 37–83) |
| Histology | |||||
| Pure ATC | 3 (43) | 7 (78) | 3 (50) | 7 (70) | 10 (63) |
| With DTC | 4 (57) | 2 (22) | 3 (50) | 3 (30) | 6 (38) |
| AJCC stage | |||||
| IVA | 0 | 1 (11) | 0 | 1 (10) | 1 (6) |
| IVB | 6 (86) | 7 (78) | 5 (83) | 8 (80) | 13 (81) |
| IVC | 1 (14) | 1 (11) | 1 (17) | 1 (10) | 2 (13) |
| Surgery | |||||
| Yes | 7 (100) | 8 (89) | 6 (100) | 9 (90) | 15 (94) |
| No | 0 | 1 (11) | 0 | 1 (10) | 1 (6) |
| Resection status | |||||
| R0 | 3 (43) | 1 (11) | 2 (33) | 2 (20) | 4 (25) |
| R1 | 3 (43) | 5 (56) | 4 (67) | 4 (40) | 8 (50) |
| R2 | 1 (14) | 2 (22) | 0 | 3 (30) | 3 (19) |
| Biopsy only | 0 | 1 (11) | 0 | 1 (10) | 1 (6) |
| Chemoradiation | 7 (100) | 9 (100) | 6 (100) | 10 (100) | 16 (100) |
| Median radiation dose, Gy | 64 (range, 46–66) | 66 (range, 58–70) | 63 (range, 46–66) | 66 (range, 58–70) | 66 (range, 46–70) |
| Chemotherapy | |||||
| Docetaxel plus doxorubicin | 5 (71) | 5 (56) | 5 (83) | 5 (50) | 10 (63) |
| Carboplatin plus paclitaxel | 2 (29) | 0 | 1 (17) | 1 (10) | 2 (13) |
| Cisplatin | 0 | 2 (22) | 0 | 2 (20) | 2 (13) |
| Doxorubicin | 0 | 2 (22) | 0 | 2 (20) | 2 (13) |
Abbreviation: AJCC, American Joint Committee on Cancer.
Treatment consisted of surgical resection, if feasible, followed by chemoradiation. Fifteen patients (94%) underwent surgical resection. Complete surgical resection with negative margins (R0 resection) was achieved in four (27%), resection with microscopic positive margins (R1) was achieved in eight (53%), and three (20%) had R2 resection. One (6%) patient initiated chemoradiation after diagnosis by biopsy and did not undergo surgical resection. All patients (n =16, 100%) received chemoradiation therapy. Median dose of radiation therapy was 66 Gy (range, 46 to 70). Ten (63%) patients received docetaxel and doxorubicin as concurrent chemotherapy. Other regimens used were cisplatin (n = 2, 13%), carboplatin plus paclitaxel (n = 2, 13%), and doxorubicin (n = 2, 13%). All patients completed intended chemoradiation therapy.
Samples were stained for both PD-1 and PD-L1, with tumor cells and inflammatory cells in stroma independently assessed and scored. Representative hematoxylin and eosin staining for an ATC is shown in Fig. 1(a). PD-1 staining was highly discordant in tumor cells vs inflammatory cells. Most tumor cells lacked PD-1 staining (PD-1 positive, n = 1; PD-1 negative, n = 15). In contrast, all samples showed positive staining for PD-1 in inflammatory cells (n = 16). Median PD-1 percentage staining in inflammatory cells was 40% (range, 9% to 80%), and the median Allred-like score was 5.5 (range, 3 to 7). Representative images of low (≤40%) and high (>40%) PD-1 expression on inflammatory cells is shown in Fig. 1(d) and 1(e), respectively.
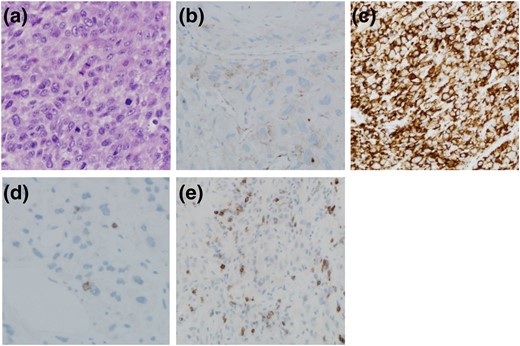
Representative photomicrographs showing (a) hematoxylin and eosin–stained section of ATC, (b) section of ATC tumor mass showing low PD-L1 expression, (c) section of ATC tumor mass showing high PD-L1 expression, (d) section showing low PD-1 expression on inflammatory cells, and (e) section showing high PD-1 expression on inflammatory cells. Original magnification: a, c, and e, 200×; b and d, 400×.
PD-L1 staining in tumor cells was positive in most patients (n = 13). The staining was mostly membranous and relatively strong, with median PD-L1 staining of 33% (range, 0% to 100%), and the median Allred-like score was 6 (range, 0 to 8). PD-L1 staining in inflammatory cells was positive in seven of 16 patients, with both median percentage staining and median Allred-like scores of 0. We could not definitively determine whether PD-1 expression in inflammatory cells correlated with PD-L1 staining in tumor cells (data not shown). Representative images of low (≤33%) and high (>33%) PD-L1 expression on tumor cells is shown in Fig. 1(b) and 1(c), respectively.
Patient and treatment characteristics based on PD-1 expression in inflammatory cells (≤40% vs >40%) and PD-L1 expression in tumor cells (≤33% vs >33%) are shown in Table 1. None of the differences in various characteristics in each group was statistically significant. Details of survival characteristics are noted in Table 2. At last follow-up, 14 of 16 patients had died and all died of disease-related complications. Median PFS was 123 days for PD-L1 tumor cell–positive patients vs 1388 days for PD-L1 tumor cell–negative patients [hazard ratio (HR), 1.38; 95% confidence interval (CI), 0.42 to 6.20; P = 0.62; Fig. 2(a)]. Similarly, median OS was 175 days for PD-L1 tumor cell–positive patients vs 1995 days for PD-L1 tumor cell–negative patients [HR, 1.35; 95% CI, 0.41 to 6.10; P = 0.64; Fig. 2(b)]. When the same data were analyzed by percentage staining (≤33% vs >33% PD-L1 staining), median PFS [Fig. 2(c)] was 453 days for ≤33% PD-L1 positive vs 118 days for >33% PD-L1 positive tumor cell staining patients (HR, 3.04; 95% CI, 0.90 to 10.80; P = 0.07). Similarly, median OS [Fig. 2(d)] was 1474 days for ≤33% PD-L1 positive vs 149 days for >33% PD-L1 positive tumor cell staining patients (HR, 3.72; 95% CI, 0.91 to 18.25; P = 0.07).
PFS and OS of the PD-1 and PD-L1 Staining Groups
| Outcome | Groups | N (No. Events) | Median Days | 1-Year Survival % (95% CI) | 2-Year Survival % (95% CI) | Hazard Ratio (95% CI) | P Value |
|---|---|---|---|---|---|---|---|
| PFS | PD-L1 tumor | ||||||
| Negative | 3 (3) | 1388 | 66.7 (13.3, 100.0) | 66.7 (13.3, 100.0) | Reference | 0.62 | |
| Positive | 13 (12) | 123 | 23.1 (0.2, 46.0) | 15.4 (0.0, 35.0) | 1.38 (0.42, 6.20) | ||
| PD-L1 tumor percentage staining | |||||||
| ≤33% | 10 (9) | 453 | 50.0 (19.0, 81.0) | 40.0 (9.6, 70.4) | Reference | 0.07 | |
| >33% | 6 (6) | 118 | 0.0 (NA) | 0.0 (NA) | 3.04 (0.90, 10.80) | ||
| PD-L1 inflammatory cells | |||||||
| Negative | 9 (9) | 119 | 33.3 (2.5, 64.1) | 22.2 (0.0, 49.4) | Reference | 0.66 | |
| Positive | 7 (6) | 202 | 28.6 (0.0, 62.0) | 28.6 (0.0, 62.0) | 0.78 (0.26, 2.28) | ||
| PD-1 inflammatory cell percentage staining | |||||||
| ≤40% | 9 (8) | 250 | 44.4 (12.0, 76.9) | 33.3 (2.5, 64.1) | Reference | 0.22 | |
| >40% | 7 (7) | 123 | 14.3 (0.0, 40.2) | 14.3 (0.0, 40.2) | 1.96 (0.66, 5.85) | ||
| OS | PD-L1 tumor | ||||||
| Negative | 3 (3) | 1995 | 100.0 (NA) | 66.7 (13.3, 100.0) | Reference | 0.64 | |
| Positive | 13 (11) | 175 | 38.5 (12.0, 64.9) | 38.5 (12.0, 64.9) | 1.35 (0.41, 6.10) | ||
| PD-L1 tumor percentage staining | |||||||
| ≤33% | 10 (9) | 1474 | 70.0 (41.6, 98.4) | 60.0 (29.6, 90.4) | Reference | 0.07 | |
| >33% | 6 (5) | 149 | 16.7 (0.0, 46.5) | 0.0 (NA) | 3.72 (0.91, 18.25) | ||
| PD-L1 inflammatory cells | |||||||
| Negative | 9 (9) | 175 | 44.4 (12.0, 76.9) | 33.3 (2.5, 64.1) | Reference | 0.44 | |
| Positive | 7 (5) | 953 | 57.1 (20.5, 93.8) | 57.1 (20.5, 93.8) | 0.65 (0.19, 1.95) | ||
| PD-1 inflammatory cell percentage staining | |||||||
| ≤40% | 9 (7) | 2059 | 66.7 (35.9, 97.5) | 53.3 (19.4, 87.3) | Reference | <0.05 | |
| >40% | 7 (7) | 175 | 28.6 (0.0, 62.0) | 28.6 (0.0, 62.0) | 3.36 (1.00, 12.96) |
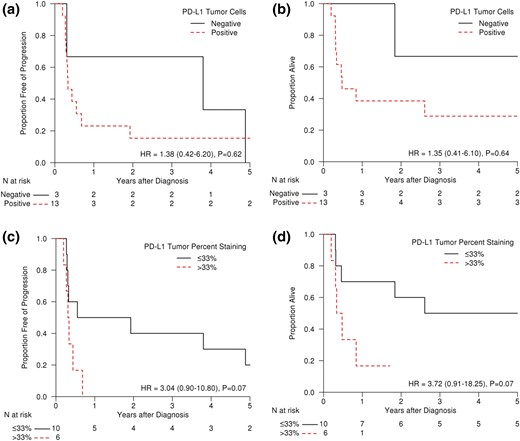
(a) PFS and (b) OS of ATC patients demonstrating positive or negative staining (determined by Allred-like score) for PD-L1 in their tumor cells. (c) PFS and (d) OS of ATC patients demonstrating ≤33% or >33% staining for PD-L1 in their tumor cells.
Median PFS per PD-L1 staining in inflammatory cells (positive vs negative) was also statistically nonsignificant [Fig. 3(a); 202 days for PD-L1 positive vs 119 days for PD-L1 negative; HR, 0.78; 95% CI, 0.26 to 2.28; P = 0.66]. Similarly, median OS was 953 days for PD-L1 inflammatory cell positive vs 175 days for PD-L1 inflammatory cell negative [Fig. 3(b); HR, 0.65; 95% CI, 0.19 to 1.95; P = 0.44]. Median PD-L1 staining percentage in inflammatory cells was 0, and analysis of patients with no staining (0%) vs ≥1% was also not significant for both PFS and OS (data not shown).
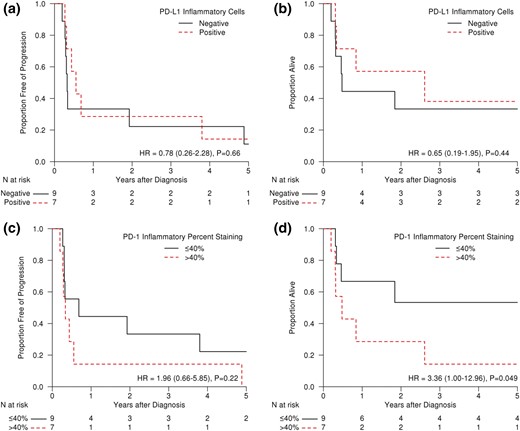
(a) PFS and (b) OS of ATC patients demonstrating positive or negative staining (determined by Allred-like score) for PD-L1 in their inflammatory cells. (c) PFS and (d) OS of ATC patients demonstrating ≤40% or >40% staining for PD-1 in their inflammatory cells.
Comparison for PD-1 positive vs PD-1 negative in tumor cells (n = 1 vs n = 15, respectively) was not performed due to the inadequate number of positive patients. PD-1 staining in inflammatory cells was positive in all samples. However, PFS in patients with ≤40% PD-1–positive inflammatory cells was 250 days vs 123 days in patients with >40% PD-1–positive inflammatory cells [Fig. 3(c); HR, 1.96; 95% CI, 0.66 to 5.85; P = 0.22]. OS was significantly different in these two groups [Fig. 3(d); 2059 days for ≤40% PD-1 positive vs 175 days for >40% PD-1 positive; HR, 3.36; 95%, CI 1.00 to 12.96; P < 0.05).
Discussion
ATC is a highly lethal cancer with median survival historically reported to be 4 to 6 months (14–17). Treatment of AJCC stage IVA and IVB patients with chemoradiation therapy with or without surgery can provide long-term control, but is very toxic (11, 18–20). Multimodal therapy has been consistently offered at our institution for these selected patients, providing a uniformly treated cohort for analysis.
Recently, immunotherapy has emerged as a new therapeutic approach for patients with cancer, demonstrating efficacy in highly mutated cancers such as melanoma and non–small-cell lung cancer (5, 21). The roles of these immune pathways are now being investigated in thyroid cancer (8, 22); however, their roles in determining prognosis or as a predictive marker remain lacking. We thus explored the role of PD-1 and PD-L1 expression in our cohort of uniformly treated ATC patients. Limitations of our study include small sample size and its single-institution nature; strengths include assessment of uniformly and consecutively treated patients.
In our cohort, most tumor cells were PD-L1 positive. Whether this relates to small cohort size or might reflect a more generalized phenomenon in ATC is unknown. However, recently published data from Bastman et al. (8) similarly showed that six of eight samples from ATC patients highly expressed PD-L1. These limited data suggest that ATCs may be associated with an antitumor immune response that may, however, be blocked or “paralyzed” by high expression of PD-1 and PD-L1 checkpoint molecules that inhibit immune response. PD-L1 may be expressed by the cancer cells themselves, as well as by tumor-associated macrophages (8, 22). The latter have been shown to heavily infiltrate most ATCs and likely contribute to an immunosuppressive tumor microenvironment (23). With no additional stains for subsets of immune cells, we could not comment on the composition of these infiltrates in our ATC patients.
We have shown in ATC that positive staining for PD-L1 in tumor cells or PD-1 staining in inflammatory cells appears predictive of poor prognosis in the ATC patients in terms of both PFS and OS. Despite a relatively small sample size, this is one of the largest uniformly treated patient cohorts, making these findings thought-provoking and potentially important for planning future trials in this rare and highly lethal cancer.
In our cohort, PD-1 staining was mostly seen on immune cells and not on tumor cells. High expression of the PD-1 in these stromal inflammatory cells could be a marker of immune exhaustion as demonstrated by Severson et al. (24) in PD-1– and Tim-3–positive CD8 T cells from patients with DTC. Further comprehensive analyses with specific staining for various subsets of immune cells to characterize the specific population and coexpression of other markers such as Tim-3 in our cohort would be more insightful. In contrast to our study, Batsman et al. (8) demonstrated little expression of PD-1 in DTC and none in ATC samples. Perhaps this is a result of variability and small sample size in both studies. Therefore, additional methods such as analysis from peripheral leukocytes of ATC patients to define “immune signatures” or gene expression markers could be studied to serve as prognostic or predictive markers. However, it is critical to implement these studies prospectively in upcoming clinical studies.
We tried to categorize samples using Allred-like scores to semiobjectively quantify the staining. However, analysis using this score to denote samples as positive vs negative seemed to not separate the groups prognostically as well as percentage cells staining. The optimal cutoff for choosing PD-L1– or PD-1–positive samples is not known. In the past, major clinical trials have used the PD-L1 cutoff anywhere from 1% (25), 5% (26), 25%, (27) to 50% (28, 29). The reagents and method of scoring used to determine these cutoffs have also varied. Importantly, note membranous vs cytoplasmic staining. In some assays staining of tumor cells only is counted for PD-L1 positivity (26) vs both tumor and immune cells in some assays (25, 28). In our analysis, we used the median percentage staining as cutoff for our survival analysis for both PD-1 and PD-L1 staining to designate them as high vs low. A more rigorous analysis to determine the optimal cutoff will require a larger dataset but will be difficult to obtain in rare disease such as ATC.
In conclusion, high expression of PD-L1 and PD-1 in this cancer suggests that therapies that block these pathways could potentially be effective therapeutic approaches. With limited systemic therapeutic options available, this hypothesis needs to be tested. ATC is a prime target for such therapies, as these cancers have high rates of mutations, including commonly mutated genes such as P53, TERT promoter, and BRAF and also of microsatellite instability genes (30–32). High numbers of mutations (21), mismatch repair deficiency (33), and BRAF mutation (22) all have been shown to be associated with response to anti–PD-1 agents in other contexts. Accordingly, clinical trials of anti–PD-1 agents with chemoradiation therapy are being planned at our institution as well as by the NRG Oncology group.
Abbreviations:
- ATC
anaplastic thyroid cancer
- CI
confidence interval
- DTC
differentiated thyroid cancer
- HR
hazard ratio
- OS
overall survival
- PD-1
programmed death-1
- PD-L1
programmed death ligand-1
- PFS
progression-free survival.
Acknowledgments
The authors are extremely grateful to patients and families, for without their consent and contribution this research would not be possible.
This work was supported by the small grants program from the Division of Medical Oncology, Mayo Clinic.
Disclosure Summary: The authors have nothing to disclose.
References
Author notes
Address all correspondence and requests for reprints to: Keith C. Bible, MD, PhD, Mayo Clinic, 200 First Street SW, Rochester, Minnesota 55905. E-mail: [email protected].
