


Five to 10% of patients with differentiated thyroid cancers (DTC) develop invasive and/or distant metastatic disease that is marginally improved with standard therapies. Prognosis is poor for patients with anaplastic thyroid cancer, with a median survival of 3–5 months. We suggest that a paradigm shift is necessary in the treatment of advanced cases.
We hypothesized that a T-cell response is generated in advanced thyroid cancer and may be a viable therapeutic target.
Primary DTCs were analyzed by quantitative RT-PCR (n = 92) for expression of CD3, CD8, forkhead box (Fox)-P3, programmed death (PD)-1, PD-1 ligand-1, and PD-1 ligand-2 and biopsied for cellular analysis by flow cytometry (n = 11). Advanced pT4 cases (n = 22) and metastases (n = 5) were analyzed by immunohistochemistry.
The study was conducted at the University of Colorado Hospital.
Thyroid cancer patients undergoing thyroidectomy or completion surgery for advanced disease between 2002 and 2013 participated in the study.
There were no interventions.
Immune markers were analyzed for association with disease severity.
Immune markers were commonly expressed at the RNA level. PD-L1 was higher (P = .0443) in patients with nodal metastases. FoxP3+ (P < .0001), PD-1+CD8+ (P = .0058), and PD-1+CD4+ (P = .0104) T cells were enriched in DTC biopsies. CD8+ and FoxP3+ T cells were detected by immunohistochemistry in all pT4 tumors and a subset of metastases. PD-1+ lymphocytes were found in 50% of DTCs. PD-L1 was expressed by tumor and associated leukocytes in 13 of 22 cases, and expression was more diffuse in anaplastic thyroid cancer (P = .0373). BRAFV600E mutation was associated with higher frequencies of tumor-associated lymphocytes (P = .0095) but not PD-L1 expression.
PD-1 checkpoint blockades may have therapeutic efficacy in patients with aggressive forms of thyroid cancer.
PD-1 checkpoint blockades may have therapeutic efficacy in patients with aggressive forms of thyroid cancer.
Whereas most patients with differentiated thyroid cancers (DTCs) respond well to standard therapies, 10% of patients develop invasive disease and 5% develop distant metastases (1). Lenvatinib, now approved as standard of care, achieved a 63.2% partial response and extended progression-free survival by 14.7 months, but only 1.5% attained a complete response (2). Although these data are encouraging, tyrosine kinase inhibitors as monotherapies are not curative. Furthermore, 1% of patients develop anaplastic thyroid cancer (ATC). The prognosis for these patients is poor, even with current treatment strategies, with a median survival of 3–5 months (1). Patients with progressive forms of thyroid cancer could benefit from novel adjuvant therapies, including immune-targeted approaches.
Our previous analysis of primary tumors from patients with DTCs identified CD4+CD25+ forkhead box (Fox)-P3+ regulatory T cells (Tregs) as a significant component of tumor-associated lymphocytes (TAL), and increased frequencies of Tregs correlated with higher degree of lymph node metastases (3). Similarly, Gogali et al (4) found that Tregs were elevated in both benign nodules and DTCs compared with blood, and a subtle increase in frequency was observed in stage II-IV compared with stage I. In regionally metastatic DTCs, Tregs were elevated in tumor-involved lymph nodes (TILN) compared with uninvolved nodes and were associated with recurrent disease (5).
Further characterization of T cells from TILN revealed that programmed death-1 (PD-1)+ T cells were enriched in a subset of patients (5, 6). Expression of PD-1, an inhibitory checkpoint molecule, is associated with T-cell exhaustion in chronic viral infection and cancer (7–13). Ligation of PD-1 by PD-1 ligand-1 (PD-L1) and PD-1 ligand 2 (PD-L2) contributes to the cessation of the T-cell response (14). PD-L1 is overexpressed by many types of tumors and has been associated with poor prognosis in some epithelial cancers (15, 16). Aberrant PD-L2 aberrant expression has also been reported in cervical carcinoma (17–19). In regionally metastatic DTC, PD-1+ T cells displayed evidence of antigen recognition and exhaustion and were variably compromised in their ability to produce cytokines ex vivo (5, 6). Surprisingly, the proliferative capacity was largely maintained, suggesting that exhaustion may be incomplete. Flow cytometry analysis of tumors isolated from TILN revealed that PD-L1 was expressed to varying degrees by 9 of 10 samples tested. Of interest, Tregs were elevated in all TILN, even in the absence of PD-1+ T cells, suggesting that both Tregs and T-cell exhaustion impede tumor elimination (6). The role of PD-1 and the immune response in locally invasive and distantly metastatic DTC remains to be determined.
ATC occurs in a small subset of patients and, given its highly metastatic nature, often does not yield surgical samples. Consequently, the data on the immune response in ATC is sparse. Tumor-associated macrophages (TAMs) and immature dendritic cells (iDC) have been identified in archived ATC surgical samples (20–24). TAMs were found at increased levels in more aggressive ATC compared with poorly differentiated thyroid cancer (PDTC) and DTC and commonly constitute greater than 50% of the tumor mass in ATC (21, 23). TAM in ATC expressed CD163 and displayed no or very few intracytoplasmic phagocytic materials, suggesting an M2 phenotype (21). The phenotype of lymphocytes in ATC has not yet been studied.
To further characterize the role of Tregs and T-cell exhaustion in primary DTC, we analyzed the expression levels of CD3, CD8, FoxP3, PD-1, PD-L1, and PD-L2 in a large population of banked primary DTC using standard quantitative RT-PCR (qRT-PCR). In a subset of these patients, we obtained fresh fine-needle biopsies (FNB) of primary tumors for analysis by flow cytometry. To investigate the immune modulation in more aggressive thyroid cancers, we performed immunohistochemistry on a collection of archived advanced DTC, PDTC, ATC, and metastatic tumors.
Materials and Methods
Patients, sample collection, and disease parameters
DTC, PDTC, and ATC patients undergoing primary thyroidectomy and neck dissection or secondary surgeries for advanced disease at the University of Colorado Hospital between 2002 and 2013 were selected. Sample collection was performed following internal review board approval. Peripheral blood mononuclear cell (PBMC) isolation and FNB of postsurgical tumor tissue were performed as previously described (5). For RNA analysis, a section of each tumor was centrally dissected and snap frozen for long-term storage at −80°C in our tumor bank. Successful sampling of the tumor was confirmed by hematoxylin and eosin analysis of the tissue specimen. Archived formalin-fixed, paraffin-embedded (FFPE) surgical specimens were used for immunohistochemistry (IHC) analyses. Original pathology reports provided tumor type, size, invasion, and extent of lymph node metastases. Evidence of distant metastases were determined from clinic notes, imaging, and pathological data where available. Standard American Joint Committee on Cancer (sixth edition) tumor node metastasis scoring was used for staging (25). Original hematoxylin and eosin stainings from the pathology archive were reanalyzed to assess the presence and degree of lymphocytic infiltration in normal thyroid tissue (lymphocytic thyroiditis [LT]) and in association with the tumor (TAL).
Patient characteristics for all analyses are summarized in Table 1. Patients in the qRT-PCR study (n = 92) included 38 classical PTC, 22 follicular variants of PTC, and 32 mixed PTC and follicular variant of papillary thyroid carcinoma (FVPTC) morphology. Tall cell (n = 6), Hurthle cell (n = 12), and solid (n = 5) and columnar (n = 1) variants were present in low frequencies. The 11 patients in our FNB study included four FVPTC cases, one of which had Hurthle cell features, one mixed PTC and FVPTC morphologies, and six classical PTC, one of which included a solid variant.
Clinical Summary of Patients
| qRT-PCR (n = 92) | Flow Cytometry (n = 11) | IHC (n = 22) | |
|---|---|---|---|
| Female to male ratio | 64:28 | 9:2 | 12:10 |
| Agea | 46 ± 15 | 40 ± 15 | 61 ± 18 |
| DTC | 92 (100) | 11 (100) | 12 (55) |
| PDTC | 0 | 0 | 2 (9) |
| ATC | 0 | 0 | 8 (36) |
| Thyroiditis (LT) | 37 (40) | 6 (55) | 5 (23) |
| Tumor sizea | 2.3 ± 1.8 | 1.8 ± 1. 5 | 5.0 ± 2.4b |
| ET invasion | 35 (38) | 4 (36) | 22 (100) |
| pT1 | 40 (43) | 5 (45) | 0 |
| pT2 | 11 (12) | 2 (18) | 0 |
| pT3 | 38 (42) | 2 (18) | 0 |
| pT4 | 3 (3) | 2 (18) | 22 (100) |
| pNX | 3 (3) | 2 (18) | 3 (14) |
| pN0 | 51 (55) | 2 (18) | 2 (9) |
| pN1 | 38 (41) | 7 (64) | 17 (77) |
| EN invasion | 19 (21) | 0 | 8 (36) |
| M1c | 0 | 0 | 12 (55)d |
Abbreviations: EN, extranodal; ET, extrathyroidal.
Mean age or tumor size (centimeters) ± SD.
Primary tumor size; thyroiditis was unknown for two patients.
Metastases were either suspected by imaging or confirmed by pathology.
Metastases were observed in five DTC, two PDTC, and four ATC cases.
pT4 tumors from primary (n = 17) or completion (n = 5) thyroidectomies (n = 22; 12 DTC, eight ATC, and two PDTC) and nonlymph node metastases (n = 6 from five patients; tibia and left knee [DTC], one sternum [PDTC], one vertebrae [follicular thyroid carcinoma], one lung [PDTC], one strap muscle [DTC)] were identified from the pathology archive between 2002 and 2013. Treatment with bevacizumab or pazopanib was noted prior to tissue sampling for the tibia/left knee and vertebral metastases, respectively. In all other cases, no prior tyrosine kinase inhibitors were noted. These patients were distinct from those that provided samples for q-RT-PCR and FNB. Expression of BRAFV600E in the pT4 cases was determined by Sanger sequencing of FFPE cores as previously described (26). One case was not analyzed due to prior decalcification of the sample.
Determination of thyroiditis and tumor-associated lymphocytes
The extents of LT and TAL were assessed as previously published (5). In the IHC analysis, TAL ranged from none (one PDTC and two ATCs) to minimal (<10 lymphocytes; two DTCs, one PDTC, two ATCs) to mild (10–100 lymphocytes; three DTCs, one ATC) to moderate (>100 lymphocytes; five DTCs, one ATC) to severe (large aggregates with germinal center formation [two DTCs and two ATCs]). Patients with moderate to severe lymphocytic infiltration in the normal tissue were considered positive for LT (Table 1). The presence or absence of LT was indeterminate in two pT4 cases with evident TAL because the tumor had overtaken the normal thyroid tissue.
Frozen tumor processing, RNA isolation, and qRT-PCR
Frozen tumor tissue was cut using a cryostat, placed into Trizol with a 5-mm stainless steel bead (QIAGEN), and homogenized (QIAGEN tissue lyser). RNA was isolated with chloroform and the RNeasy kit (QIAGEN). cDNA was synthesized from total RNA (1 μg) using the high-capacity c-DNA reverse transcription kit (ABI-P/N 4368814). TaqMan gene expression assay primers were purchased from Invitrogen (numbers Hs01062241, Hs00174762, Hs01085834, Hs01550088, Hs01125301, Hs0105777). The TaqMan probes were 5′labeled with 6-carboxyfluorescein. Real-time PCRs (Prism 7900 sequence detector; PE Applied Biosystems Inc) were carried out in duplicate and included standard curve, test samples, no-template, and no reverse transcription controls. Human PBMCs were used to generate the standard curve for CD3, CD8, PD-1, and FoxP3; and the thyroid cancer cell line, BCPAP, was used for PD-L1 and PD-L2. Expression of each target was normalized to corresponding 18s rRNA (PE Applied Biosystems Inc; P/N 4308310). 293T cells were used as a negative control for CD8 (0 pg/ng 18S), PD-L1 (6.0 pg/ng 18S), and PD-L2 (0 pg/ng 18S). BCPAP was used as a negative control for CD3 (0.25 pg/ng 18S), FoxP3 (4.7 pg/ng 18S), and PD-1 (4.4 pg/ng 18S).
Flow cytometry
Staining and analysis were performed as previously published in FNB from lymph nodes (5). Gating strategies were determined with PBMCs. Anti-CD3-alexafluor-700 (UCHT1), anti-CD4-fitc (RPA-T4), anti-FoxP3-PE (PCH101), anti-interferon-γ (IFNγ) PerCP-Cy5.5 (4S.B3), and anti-CLTA-4-biotin (14D3) were purchased from eBioscience. Anti-PD-1-AF647 (EH12.1) and anti-CD25-APC-Cy7 (M-A251) were purchased from BD Pharmingen. Anti-CD8-Pacific Orange (MHCDO830) was purchased from Invitrogen. PD-L1 and PD-L2 expression in 293T transfectants was verified by flow cytometry (anti-PD-L1; eBioscience [MIH1]; anti-PD-L2, Biolegend [24F.10C12]).
Immunohistochemistry
Tissue sections (4 μm) were deparaffinized and rehydrated using standard protocols. Antigen retrieval was performed in citrate buffer (10 mM trisodium citrate [Sigma[, 0.05% Tween 20 [Sigma], pH 6) for CD8, PD-1, FoxP3, and PD-L2 or Tris-EDTA buffer (10 mM Tris Base [Sigma], 1 mM EDTA [Sigma], 0.05% Tween 20, pH 9) for PD-L1 detection in a decloaking chamber (15 min, 110°C; Biocare Medical). Tissues were incubated with H2O2 (3%; 30 min) followed by a serum block and stained with species control IgG in parallel to anti-CD8 (Vector Labs; VP-C324, 1:100), anti-PD-1 (Abcam; ab52587, 5 μg/mL), anti-FoxP3 (eBioscience; PCH101, 1.25 μg/mL), or anti-PD-L1 (Spring Bioscience; SP142, 0.77 μg/mL) or anti-PD-L2 (Biolegend; MIH18, 2 μg/mL) overnight at 4°C. Staining was detected with species-specific, horseradish peroxidase-conjugated ImmPress reagent kits and ImmPact diaminobenzidine (Vector Labs). Tissues were counterstained with Mayer's hematoxylin (Sigma-Aldrich) and mounted (Cytoseal-XYL; Thermo Scientific). Staining intensity was scored on a 1+ to 3+ scale, and the percentage of positive cells among total lymphocytes or tumor cells was estimated (1 = < 1%, 2 = 1%–10%, 3 = 11%–33%, 4 = 34%–66%, 5 = 67%–100%). Allred scores (intensity + percentage positive) were generated for comparison between samples (27). CD8, FoxP3, and PD-1 stains were optimized using tonsil tissue. PD-L1 and PD-L2 staining protocols were optimized using 293T transfectants (Lipofectamine 2000; Life Technologies). Anti-CD8 staining was imaged using an Aperio Scanscope AT2 at an optical resolution of ×20 and a digital resolution of 0.5 μm per pixel. Tumor regions of interest were annotated using the Aperio ImageScope application and analyzed for positive stain using an Aperio colormetric thresholding algorithm.
Statistical analysis
To determine statistical significance, we used the Mann-Whitney nonparametric, two-tailed t test or Fisher's exact test. Correlations were assessed using the nonparametric Spearman test. The level of statistical significance was calculated by a two-tailed analysis with 95% confidence. To ensure significance in our flow cytometry analyses (based on Poisson statistics), a minimum of 100 events were collected in the populations of interest.
Results
qRT-PCR analysis of immune markers in primary DTC
To investigate the role of Tregs and T-cell exhaustion in primary thyroid tumors, we obtained 92 frozen tissue samples from our thyroid tumor bank. CD3 and CD8, FoxP3, PD-1, PD-L1, and PD-L2 expression varied significantly among samples. No association was observed between the expression of CD3, CD8, FoxP3, PD-1, PD-L1, or PD-L2 and tumor size (Figure 1A). PD-L1, but not the other targets, was slightly elevated on average in patients with regional lymph node metastasis (ie, pN1; Figure 1B). CD3, CD8, FoxP3, PD-1, and PD-L2 were expressed higher on average in patients with LT (Supplemental Figure 1). This is not surprising because the level of tumor-infiltrating and surrounding lymphocytes would likely increase as a result of LT. Of interest, PD-L1 levels were not significantly different between the two groups, perhaps suggesting that the tumor itself contributes to PD-L1 expression. To determine whether the low-level expression of RNA for PD-L1 was indicative of protein expression, we assessed PD-L1 expression by IHC in FFPE specimens from nine patients who contributed frozen specimens for our qRT-PCR analysis (Figure 1C). Two of three samples that had low levels of PD-L1 expression by RNA (52.8, 53.7, and 54.4 pg per 18S) were positive for PD-L1 protein, as detected by IHC (allred score = 3, 0, and 3, respectively), suggesting that even the low-level PD-L1 RNA expression may be physiologically relevant. PD-L1 expression was detected by IHC in all six tumors that had intermediate or high levels of RNA expression; however, the expression level detected by IHC did not correlate directly with RNA levels. This could be explained by tissue heterogeneity in the tumor sampling and/or inconsistent translation of PD-L1 transcript. These data suggest that T-cell infiltration is common in primary DTC. The presence of FoxP3 expression in these samples may be indicative of Treg infiltration, which could impede any ensuing immune response. Furthermore, these studies suggest that the PD-1/PD-L1/PD-L2 checkpoint pathway is expressed in DTC.
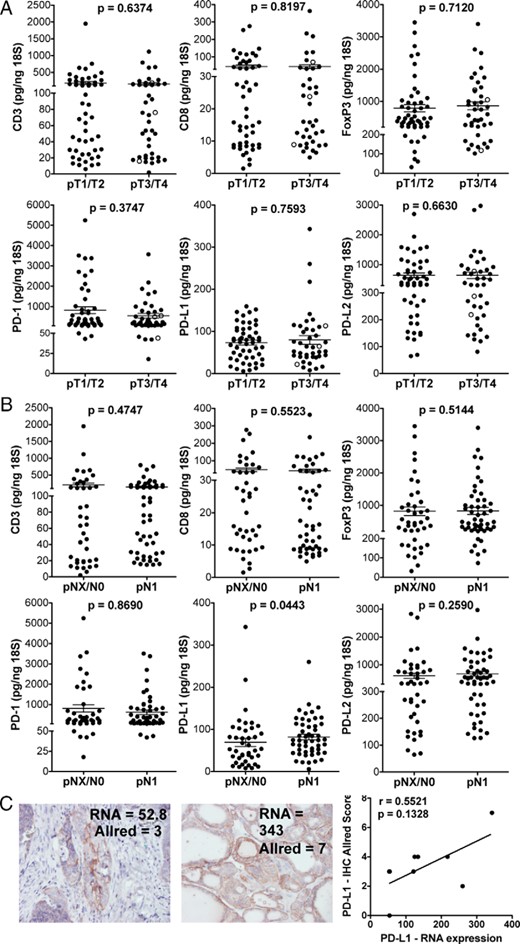
RNA expression analysis of tumor-infiltrating T cells and the PD-1 checkpoint pathway in DTC.
RNA expression of CD3, CD8, FoxP3, PD-1, PD-L1, and PD-L2 in DTC sample was determined by qRT-PCR. A, Patient samples were grouped according to tumor size. pT4 patients are shown as open circles among pT1, pT2, and pT3 patients (filled circles). B, Expression was compared in patients with (N1) and without (NX/NO) lymph node metastases. Mean ± SEM is shown. With the exception of one sample that displayed a value for PD-L1 less than 6.0 pg/ng 18S; all other samples expressed the targets at levels higher than that observed in our negative controls. C, Representative images of PD-L1 protein detection by immunohistochemistry is shown in DTC samples that displayed low and high relative levels of PD-L1 mRNA. Spearman correlation analysis of PD-L1 mRNA and protein expression (n = 9) was performed.
Detection of Tregs and PD-1+ T cells in surgical DTC samples by flow cytometry
To verify our qRT-PCR results at the cellular level, we obtained FNBs from surgical specimens after thyroidectomy. Lymphocytes from 11 tumor biopsies and matched PBMCs were analyzed by flow cytometry. As shown in Figure 2A, FoxP3+CD25+CTLA-4+ Tregs were consistently elevated in DTC compared with PBMCs. In line with these findings, the ratio of CD8 to Treg was reduced in DTC compared with PBMCs. PD-1+ CD4+ and CD8+ T cells were also elevated in DTC (Figure 2B). The frequencies of Tregs and PD-1+ T cells were similar in the tumors with and without concurrent thyroiditis (data not shown). In this small sample set, no association was observed between Treg or PD-1+ T cell frequency and tumor size, invasion, or lymph node metastases (data not shown). Future studies are necessary to determine the functional relevance of PD-1 expression by DTC-associated T cells. These data confirm that T cells, including the CD8+, CD4+ Tregs, and PD-1+ populations, are commonly found infiltrating the primary thyroid tumors, even in more aggressive (pT4) cases.
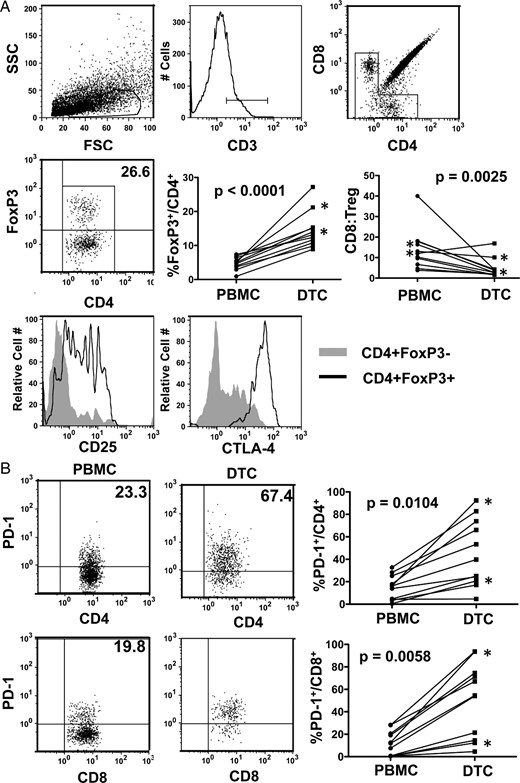
Characterization of T-cell subsets in DTC.
A, FNBs from primary DTC and matched peripheral blood samples were analyzed by flow cytometry. CD3+ T lymphocytes were further gated by CD4 and CD8 expression. Tregs were identified as FoxP3+CD4+ and assessed for CD25 and CTLA-4. The percentages of FoxP3+ Tregs in the total CD4+ T cell population and the ratios of CD8 to Treg (percentage CD8/CD3 to percentage FoxP3/CD3) were compared between blood (PBMCs) and DTC. FSC, forward scatter; SSC, side scatter. B, CD4+ and CD8+ T cells were assessed for PD-1 expression in PBMC and DTC. Asterisks designate pT4 patients.
Immunohistochemical analysis of CD8, FoxP3, PD-1, PD-L1, and PD-L2 in advanced DTC and ATC
To more thoroughly assess tumor-associated T cells in aggressive DTC and ATC cases, we identified 22 patients over the last 10 years with archived thyroidectomy specimens that were graded as pT4. Six DTC metastases, archived from five different patients, were also analyzed. Nineteen of the primary tumors were determined by pathological assessment to contain TAL, four of which were confirmed to also have concurrent thyroiditis (Table 1 and Supplemental Table 1). One of the remaining three patients had LT in the absence of TAL. CD8+ and FoxP3+ lymphocytes were evident infiltrating the tumor in all 19 cases (Figure 3). PD-1 expression was less uniform, occurring only in six DTC samples (20%), and PD-1+ cells were confined to peritumoral (TAL) or distal lymphoid aggregates (TAL/LT; Figure 3B and Supplemental Table 1). TAL was detected by histological analysis in two of five metastases and included CD8+ (n = 2) and FoxP3+ (n = 1) lymphocytes (Figure 3A). PD-1+ cells were not identified in this small sampling of metastases. Quantitative scanning of all pT4 tumors revealed that CD8+ T cell frequencies ranged from 173 to 1497 cells/mm2. Of note, CD8 detection in the five metastatic DTC tumors ranged from 40 to 687 CD8+ cells/mm2 (Figure 3D, open circles).
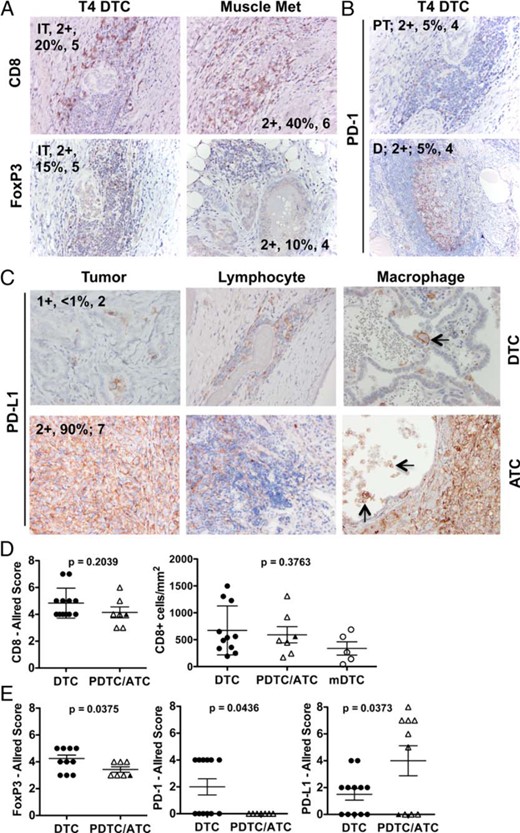
Immunohistochemical analysis of tumor-associated T cells and the PD-1 checkpoint pathway and advanced pT4 DTC and ATC.
Archived primary tumor samples and metastases were stained with antibodies specific for CD8, FoxP3, PD-1, and PD-L1. Intratumoral (IT), peritumoral (PT), and distal (D) lymphocytes were assessed for the expression of CD8, FoxP3 (A), and PD-1 (B). C, Representative PD-L1 expression is shown in the tumor and associated lymphocytes and macrophages. Arrows designate PD-L1+ macrophages. Macrophages were evident within ATC tumors but were difficult to distinguish, given the high level of PD-L1 staining on tumor cells. Staining intensity (ie, 2+), staining frequency (percentage of cells analyzed), and Allred score (1–8) is noted. D, Allred scores and Aperio quantification (cells per square millimeter) for CD8 staining are displayed. E, Allred scores for FoxP3 and PD-1 staining among lymphocytes and PD-L1 expression by the tumor are shown. DTC, black circles; PDTC, black triangles; ATC, open triangles; and DTC metastases (mDTC), open circles. Mean ± SEM is shown.
PD-L1 and PD-L2 expressions were assessed on both tumor cells and associated leukocytes in primary pT4 tumors and metastases (Figure 3, C and E). PD-L1 was expressed at similar intensities (1–2+) by 13 of 22 tumors. PD-L1 expression, when present, was largely focal in DTC but was more diffuse in the six positive ATC samples. PD-L1 was also expressed by intratumoral and peritumoral lymphocytes in 10 of the 13 tumors that were positive for PD-L1. Eight of 12 DTCs, two of two PDTCs, and five of eight ATCs showed evidence of PD-L1+ TAM, as identified by morphology (Figure 3C). All metastases were negative for PD-L1 expression. Patient-matched primary tumors were available from three of these patients, and all were negative for PD-L1 expression. Although PD-L2 was detected in the pT4 tumors assessed by qRT-PCR (Figure 1), PD-L2 protein was not expressed by the tumor or associated leukocytes in this sample set. Verification of PD-L1 and PD-L2 IHC is shown in Supplemental Figure 2.
BRAFV600E mutation status and immune markers in advanced DTC and ATC
The BRAFV600E mutation is present in 50% and 25% of DTC and ATC cases, respectively (28). In addition to its oncogenic activity, BRAFV600E signaling has been shown to modulate the immune response (29–31). We characterized our panel of advanced DTC and ATC cases for the presence of the BRAFV600E mutation and investigated whether mutation status was associated with the frequency and/or phenotype of TAL and expression of PD-L1 (Supplemental Table 1). As shown in Figure 4, higher levels of TAL were seen on average in patients with BRAFV600E positive DTC or ATC; however, no significant association was observed between the mutation status and expression of PD-L1 or the frequency of infiltrating CD8+, FoxP3+, and PD-1+ lymphocytes.
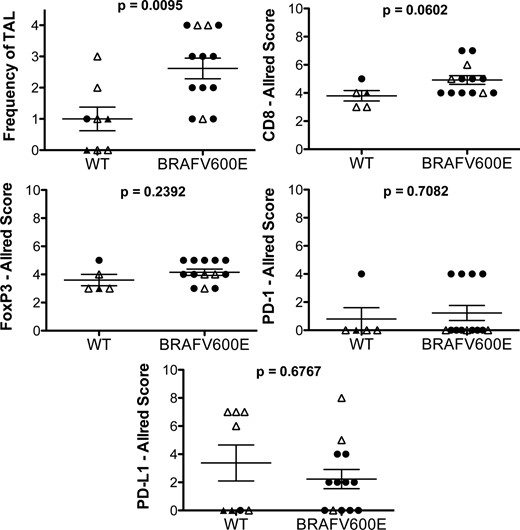
BRAFV600E mutation and immune phenotype.
BRAFV600E mutation and wild-type (WT) pT4 tumors were compared for the level of TAL, relative frequency of CD8+, FoxP3+, and PD-1+ lymphocytes, and PD-L1 expression by the tumor. TAL was scored as follows: 0, none; 1, minimal; 2, mild, 3, moderated; and 4, severe.
Discussion
Recent successes of anti-PD-1/PD-L1 checkpoint inhibitors have reinvigorated the field of cancer immunotherapy (32–37). Response rates have ranged from 13% to 37% in patients with progressive cancers in whom multiple lines of therapy have failed. Posttrial analyses have attempted to define molecular markers that correlate with tumor regression. Initial studies with novilumab (anti-PD-1; Bristol Myers) found that response was associated most strongly with the expression of PD-L1 by the tumor and did not significantly correlate with infiltrating lymphocytes (19, 37). PD-1 was expressed by tumor-infiltrating lymphocytes in 7 of 10 of responders and 9 of 18 nonresponders and did not significantly correlate with a clinical response (19). In contrast, response to pembrolizumab (anti-PD-1; Merck) was strongly associated with a high frequency of CD8+ or PD-1+ T cells either at the invasive margin or infiltrating the tumor and, to a lesser degree, expression of PD-L1 (38).
Our results revealed that PD-L1 is often expressed by pT4 thyroid cancers (61%) and is highly expressed in a subset of patients with ATC. Detection of PD-L1 protein was successful, even in samples with relatively low RNA expression (∼50 pg/ng 18S). These data suggest that PD-L1 is likely expressed at the protein level by at least 64% (59 of 92 samples ≥ 50 pg/ng 18S; Figure 1) of all DTC samples. A previous IHC study suggested that PD-L1 was expressed by greater than 80% of DTCs (39). These data should be interpreted with caution, however, because staining was cytoplasmic and controls were not shown. Another recent study found that 9 of 17 DTC samples (53%) expressed PD-L1 (30). The staining in this study was also largely cytoplasmic and the appropriate negative controls were not reported.
PD-1+ lymphocytes were identified in six pT4 DTC cases by IHC, RNA expression of PD-1 was evident in all three pT4 DTC cases analyzed (44, 493, and 546 pg per 18S), and PD-1+ CD4+ and CD8+ T cells were enriched in both pT4 DTC cases analyzed by flow cytometry. Although additional studies are necessary to determined whether PD-1 is a sign of functional exhaustion in these primary thyroid tumors, we would predict that PD-1 is expressed after exposure to tumor antigen and is likely associated with the up-regulation of other inhibitory molecules (ie, Tim-3) and reduced capacity for cytokine production. Most notably, intratumoral CD8 infiltration was evident in all primary pT4 tumors and at least two of five metastases. Response to pembrolizumab in patients with melanoma was associated with CD8 infiltrate ranging from approximately 1000–8000 cells/mm2 (38). Although the physiological relevance of CD8+ T cell frequency (40–1497 cells/mm2) in thyroid cancer remains to be determined, these data suggest that an antitumor CD8+ T-cell response has been generated in patients with advanced DTC, which may be enhanced by anti-PD-1 therapy.
We predict that the ability of a patient to respond to a PD-1 blockade will depend not only on the presence of a CD8+ T-cell response and the involvement of the PD-1/PD-L1/PD-L2 inhibitory pathway but will also be limited by a suppressive tumor microenvironment. FoxP3+ lymphocytes were present in all pT4 primary tumors and one of the two metastases with evident TAL. Tregs have been shown to express both PD-1 and PD-L1, and blockade of PD-1/PD-L1 interactions is thought to inhibit the induction, maintenance, and function of Tregs (40–43). Thus, anti-PD-1 and anti-PD-L1 therapies may inhibit the suppressive effects of tumor-associated Tregs. TAMs and iDC have also been described in primary thyroid tumors (20, 22, 24, 44). Here we identified PD-L1+ TAM in 16 of 23 pT4 tumors (Figure 3C). Future clinical trials using PD-1 checkpoint blockades should include analyses of Tregs, TAM, and iDC as potential markers of response and/or resistance to therapy.
The success of anti-PD-1/PD-L1 therapies is also critically dependent on the ability of CD8+ T cells to recognize tumor antigens. Although thyroid cancer is thought of as having low mutation burden compared with other types of cancer, a number of mutations have been described that could be a source of neoantigens (28). Of interest, the thyroid is one of the most immunogenic organs in the body. The prevalence of autoimmune thyroiditis in the general population is approximately 5%–10%, and nearly 30% of the patients with DTC have thyroid autoantibodies. Thyroiditis is a common side effect in patients receiving checkpoint blockade therapies, suggesting that thyroid-specific T cells have escaped negative selection in a subset of patients (33, 37, 45). Although tumor antigens remain poorly characterized in thyroid cancers, it is likely that autoreactive T cells contribute to the antitumor response.
ATC samples were also infiltrated with CD8+ T cells and Tregs. Of interest, six of eight ATC samples display diffuse expression of PD-L1. PD-L1 is induced by IFNγ during an active immune response. Thus, it is possible that PD-L1 is expressed in response to the ensuing immune response. Alternatively, constitutive expression of PD-L1 may have been acquired during tumor escape and may not reflect the functionality of the ensuing immune response. Of note, both the MAPK and phosphatidylinositol 3-kinase/AKT signaling pathways are commonly activated by gene mutations in ATC and may drive PD-L1 overexpression (28, 46–48). We suggest that patients with ATC are viable candidates for anti-PD-1/PD-L1 therapies in combination with other chemotherapies that slow tumor growth.
Current trials involving the available checkpoint blockades are focused on combination therapies with other immune-modulating drugs, tumor vaccines, multitargeted tyrosine kinase inhibitors, and standard chemotherapies (eg, 4–1BB, LAG-3, Sipuleucel-T, lenvatinib, and pomalidomide). BRAF inhibitors are well studied in melanoma and thyroid cancer. BRAFV600E expression leads to the up-regulation of key genes involved in the innate immune response and may be associated with higher levels of immune-suppressive molecules, such as PD-L1 and IDO (29, 30). BRAFV600E expression in melanoma is thought to induce PD-L1 and PD-L2 expression by fibroblasts within the tumor microenvironment via an IL-1-dependent pathway (31). BRAFV600E inhibition enhanced the expression of potential tumor antigens and major histocompatibility complex (49–52). Furthermore, BRAF inhibition in patients and mouse models resulted in increased tumor-infiltrating T cells and elevated CD8 to Treg ratios (50, 53–55). In a mouse model of ATC, BRAFV600E inhibition with PLX4720 resulted in an increased infiltration of CD8+ T cells, myeloid cells, and B cells and the up-regulation of PD-L1 (56, 57). Combination PLX4720 and anti-PD-L1 treatment in this model reduced tumor burden significantly more than either single agent (56). In our analysis of advanced DTC and ATC cases, the BRAFV600E mutation was associated with increased TAL; however, the frequency of CD8+ T cells was not increased in mutant compared with wild-type tumors. Furthermore, Treg infiltration and PD-L1 expression were not associated with mutation status. The effects of vemurafenib on the immune response is actively under investigation in patients treated for advanced melanoma (NCT01942993). These studies may encourage the use of BRAF inhibitors in future combination therapies.
Lenvatinib is of particular interest for combination therapy in advanced DTCs, given its efficacy as a single agent. In addition to the direct effects of lenvatinib on tumor angiogenesis, vascular endothelial growth factor receptor inhibition may boost the ensuing antitumor immune response. Proangiogenic vascular endothelial growth factor (VEGF)-A is well documented in its ability to inhibit DC maturation and to support the generation of TAM and myeloid-derived suppressor cells (58–62). This immunosuppressive cellular network likely supports the induction and maintenance of Tregs through the production of IL-10 and TGFβ (63–65). Tregs also express vascular endothelial growth factor receptor, and the inhibition of VEGF activity has been shown to inhibit Treg proliferation (66). Furthermore, a recent study showed that VEGF-A and its receptors directly inhibit CD8+ T cells through the up-regulation of PD-1 and other inhibitory molecules (67). Trials are in development to investigate the efficacy of PD-1 inhibition in combination with lenvatinib.
Our data support the investigation of PD-1 checkpoint blockades in patients with advance thyroid cancer. Future clinical trials that use combination therapies to target both the tumor and the immune response may generate more durable responses in patients with aggressive tumors.
Acknowledgments
This work was supported by B.R.H. was supported by the Mary Rossick Kern and Jerome H. Kern Endowment in Endocrine Neoplasms Research; J.D.F. was supported by American Thyroid Association Thyroid Head and Neck Cancer Foundation (THANC) Grant 2009; American Cancer Society Institutional Research Grant 57-001-50; National Institutes of Health/National Center for Research Resources Colorado Clinical and Translational Science Institute Grant UL1 RR025780. This work was also supported in part by the Molecular Pathology and Flow Cytometry Shared Resources of Colorado's National Institutes of Health/National Cancer Institute Cancer Center Support Grant P30CA046934.
Disclosure Summary: The authors have nothing to disclose.
Abbreviations
- ATC
anaplastic thyroid cancer
- DTC
differentiated thyroid cancer
- FFPE
formalin-fixed, paraffin-embedded
- FNB
fine needle biopsy
- Fox
forkhead box
- FVPTC
follicular variant of papillary thyroid carcinoma
- iDC
immature dendritic cell
- IFNγ
interferon γ
- IHC
immunohistochemistry
- LT
lymphocytic thyroiditis
- PD-1
programmed death-1
- PD-L1
PD-1 ligand-1
- PD-L2
PD-1 ligand 2
- PDTC
poorly differentiated thyroid cancer
- qRT-PCR
quantitative RT-PCR
- TAL
of tumor-associated lymphocyte
- TAM
tumor-associated macrophage
- TILN
tumor-involved lymph nodes
- Treg
regulatory T cell
- VEGF
vascular endothelial growth factor.
