


Abstract
Glucocorticoids play a key role during intrauterine development in cellular growth and differentiation. Evidence suggests that exposure to inappropriate concentrations of glucocorticoids during sensitive developmental periods may produce alterations in physiological systems that impact obesity risk.
To elucidate the magnitude and stage-of-gestation–specific association of maternal cortisol concentrations during pregnancy with infant adiposity.
Sixty-seven mother–child dyads recruited in early pregnancy at university-based obstetric clinics in Southern California were followed with serial assessments from early gestation through birth until 6 months postnatal age. Maternal cumulative cortisol production was assessed over each of 4 consecutive days in early (≅13 weeks), mid (≅24 weeks), and late pregnancy (≅30 weeks) (5 saliva samples/d × 4 days × 3 trimesters = 60 saliva samples/subject). Infant body composition was serially assessed in newborns (at ∼25 days postnatal age) and at ∼6 months age with dual-energy X-ray absorptiometry imaging.
After adjusting for key prenatal, birth, and postnatal covariates, higher maternal cortisol during the early third trimester (conditioned on prior early and midgestation cortisol concentrations) was significantly associated with a greater change in infant percent body fat from 1 to 6 months of age [partial r (adjusted for covariates) = 0.379, P = 0.007], accounting for ∼14% of the variance in this measure of childhood obesity risk.
The present findings suggest a stage-of-gestation–specific effect of maternal cortisol on infant adiposity gain in early postnatal life and provide evidence in humans to support the role of glucocorticoids in fetal programming of childhood obesity risk.
Obesity represents one of the most urgent national and global health challenges because of its high prevalence and established health risks (1). Childhood obesity is a particularly grave concern because obese children are substantially more likely to be obese as adults (2) and to develop obesity-related disorders at earlier ages and of greater severity (3). Moreover, once established, obesity is extremely difficult to reverse, underscoring the critical importance of primary prevention.
Although the contribution of obesogenic exposures (e.g., suboptimal diet, physical inactivity) to the development of obesity is well established, the magnitude of this effect only partially accounts for obesity risk (4). There are, for example, large individual differences in susceptibility for weight gain and fat mass accretion upon exposure to an identical degree of excess energy (caloric) intake (5). The conventional paradigm posits that such individual susceptibility is largely attributable to genetic makeup; however, it is now increasingly evident there is a lot more to this tendency than genetic variation alone [in fact, currently identified genetic variants account for only a very modest proportion of variation in body mass index (BMI) (6)]. A rapidly growing and convergent body of epidemiological, clinical, and experimental evidence in humans and animals suggests that the origins of obesity can be traced, in part, to the intrauterine period of life (7), at which time the developing fetus responds to suboptimal conditions by producing structural and functional changes in cells, tissues, and organ systems (i.e., the concept of developmental, or fetal, programming of health and disease risk) (8).
In humans, adipogenesis, the process of adipocyte formation from stem cell precursors, occurs primarily during late fetal (third trimester of gestation) and early postnatal life (9), whereas the ability to form new adipocytes in adulthood is limited (9, 10). Several intrauterine conditions have been identified as risk factors for obesity and metabolic dysfunction in the offspring, including maternal obstetric complications (diabetes, hyperglycemia), maternal under- or overnutrition, unhealthy maternal behaviors such as smoking, and exposure to various forms of stress (11–13).
We and many others have suggested that glucocorticoids (GCs; cortisol in humans) may play a salient role in this process (7, 14–16). First, cortisol, the end product of activation of the hypothalamic-pituitary-adrenal axis, is known to play a key role in cellular differentiation and fetal growth (17) and exert a wide array of metabolic, endocrine, and immune effects (18). Second, the production, bioavailability, and intracellular activity of cortisol, one of the primary biomarkers of the physiologically stressed state, is altered by the same suboptimal conditions that have been shown to program obesity risk (19). Thus, although glucocorticoids play an essential role in normal growth and development, abnormal or inappropriate levels, particularly during sensitive periods, may induce permanent or long-term physiological changes associated with increased obesity risk in later life.
In animal models, fetal exposure to glucocorticoids has been experimentally modeled by administration of dexamethasone or by inhibiting 11 β-hydroxysteroid dehydrogenase (11β-HSD), an enzyme that regulates the interconversion between cortisol and its inactive metabolite cortisone, thereby protecting the fetus from maternal glucocorticoid overexposure. The offspring of these animals have been shown to exhibit increased adiposity and symptoms of the metabolic syndrome, including insulin resistance and glucose intolerance (20–22). In humans, placental corticotrophin-releasing hormone (CRH)—a hormone that stimulates fetal and maternal adrenal cortisol production during pregnancy in primates—is positively associated with increased central adiposity (23), as well as with increased catch-up growth velocity in early infancy (24), which, in turn, is associated with increased obesity risk in later life. Moreover, several animal models of stress induction in pregnant females have found that their offspring were heavier and exhibited greater adiposity (25–28), impaired glycemic control (25, 26, 28, 29), and increased food intake (27, 29). In humans, a history of prenatal stress exposure, maternal depression, maternal bereavement, or disaster-related maternal stress during pregnancy is associated with an increased risk of childhood obesity and type 2 diabetes (11, 12, 30), and in young adulthood with a higher BMI, increased percent body fat (%BF), insulin resistance, and an unfavorable lipid profile (13).
Yet, to date, no human study has prospectively investigated the association between maternal cortisol during pregnancy and infant adiposity. Thus, the primary aim of the current study was to examine the prospective association between maternal cortisol production in early, mid, and late gestation with change in infant body composition (percent fat mass) over the first 6 months of postnatal life. We used a state-of-the art ecological momentary assessment protocol to quantify cortisol production over time and across real-life (ecologically relevant) situations. Pregnant women collected saliva samples at five time points during each day on 4 consecutive days (2 weekdays and 2 weekend days) in early, mid, and late pregnancy (a total of 60 samples per woman across pregnancy), with electronic verification of time of day of collection of each sample (using the Medication Event Monitoring System® cap device). Based on the rationale discussed previously, and the consideration that the third trimester of gestation represents the period of maximal fetal fat accretion (9), we specifically hypothesized that the effects of maternal cortisol on infant adiposity would be most pronounced during the third trimester. We focused on change in percent fat mass over the early postnatal period of life as the primary outcome of interest because several studies suggest that infant growth velocity, and particularly the magnitude of increase in fat mass during early infancy, is among the most reliable and valid predictors of subsequent childhood obesity risk (31–33). We used dual-energy X-ray absorptiometry (DXA) whole-body imaging to quantify infant body composition (percent fat mass) at birth and 6 months postnatal age.
Methods
Study population
The study population was comprised of 67 mother–newborn dyads recruited from a population-based prospective cohort study at the University of California, Irvine, Development, Health, and Disease Research Program. Women with a singleton, intrauterine pregnancy were recruited in early gestation. Maternal exclusionary criteria were uterine anomalies, pre-existing major medical comorbidities (hypertension, infection, or diabetes), use of antenatal systemic corticosteroids, antenatal administration of GCs because of risk of preterm birth, and illicit drug use. Newborn exclusionary criteria were congenital malformations, chromosomal abnormalities, major perinatal complications, and preterm birth <34 completed weeks. The study was approved by the University of California, Irvine, Institutional Review Board, and written, informed consent was obtained from all mothers. The maternal and infant characteristics of the study population are presented in Table 1.
Maternal and Infant Characteristics
| Characteristics | N = 67 Mother–Infant Dyads |
|---|---|
| Maternal | |
| Age at delivery, mean ± SD, y | 27.33 ± 5.0 |
| Prepregnancy BMI | |
| Race/ethnicity | |
| Hispanic white | 33% |
| Non-Hispanic white | 49% |
| Non-Hispanic other, or multiple race | 18% |
| Presence of gestational diabetes | 6% |
| Parity (nulliparous) | 38% |
| Child | |
| Sex (females) | 52% |
| Gestational age at birth, mean ± SD, weeks | 39.2 ± 1.5 |
| Birth weight, mean ± SD, g | 3359 ± 598 |
| Age at newborn assessment, mean ± SD, d | 27 ± 11 |
| Age at 6-month assessment, mean ± SD, d | 195 ± 21 |
Cortisol sample collection protocol
Pregnant women collected saliva samples using a Salivette sampling device (Salimetrics, Carlsbad, CA) for the assessment of cortisol concentrations immediately and 30 minutes postawakening, and at 1200 hours, 1600 hours, and 2000 hours, for 4 consecutive days in early (13 ± 2.0 [mean ± standard deviation (SD)]-week gestation, T1), mid (24 ± 1.4-week gestation, T2), and late pregnancy (30 ± 1.2-week gestation, T3). Thus, each woman collected five saliva samples per day, on 12 days during pregnancy, resulting in a total of 60 samples per woman across pregnancy (see Fig. 1 for cortisol-sampling scheme). Because previous studies have shown there are weekend–weekday differences in the cortisol-awakening response (34), 2 weekend days and 2 weekdays were selected for sampling to capture a wide range of intraindividual variation in pregnant women’s cortisol levels. Exact time of saliva sampling was monitored using a Medication Event Monitoring System® (Aardex Group, Union City, CA). Subjects were instructed to refrain from eating and drinking during the first hour after awakening, and, after each saliva sample collection, to store the swab in a plastic tube labeled with the designated sampling time. Compliance with the saliva-sampling protocol was very high; only 2.1% of the 4080 samples (5 saliva samples/d × 4 days × 3 time points during pregnancy × 68 subjects) were not collected.
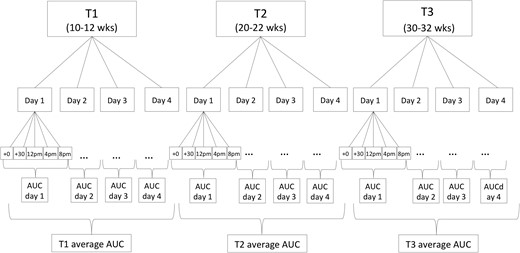
Cortisol-sampling scheme. Maternal salivary cortisol concentrations were assessed immediately and 30 minutes postawakening, and at 1200 hours, 1600 hours, and 2000 hours for 4 consecutive days in early, mid, and late pregnancy (30 ± 1.2 weeks gestation, T3).
For each sampling day, total cortisol output was estimated using the area under the curve (AUC) with respect to ground (35). AUCs were then adjusted for total time between the awakening sample and the last sample of the day [i.e., expressed as cortisol production per hour (μg/dL/h)]. Each of the 4-day AUCs was averaged and residualized for gestational age at collection (to account for effects of gestational age on cortisol production) for each of the three pregnancy assessments in early, mid, and late gestation.
Cortisol assay
Saliva samples were assayed to determine cortisol concentrations using a highly sensitive enzyme immunoassay (Salimetrics). Ten percent of the samples were run in duplicates. The assay has a lower limit of sensitivity of 0.007 μg/dL, a standard curve range from 0.012 μg/dL to 3.0 μg/dL, an average intra-assay coefficient of variation of 5.42%, and an average interassay coefficient of variation <10%.
Infant body composition
DXA imaging
To assess total body fat, a whole-body DXA scan was obtained using a Hologic Discovery Scanner (A, QDR 4500 series; Hologic, Bedford, MA) in pediatric scan mode. Calibration using Hologic’s anthropomorphic Spine QC Phantom was performed before each scan. During the scan, infants lay supine while sleeping, wearing only a disposable diaper and swaddled in a light cotton blanket. If the infant moved during the scan, a single repeat was performed. At the time of the newborn DXA assessment, children were, on average, 25.7 days old [mean (±11.6 SD) days]. This age was selected to allow for stabilization of fluid shifts in the newborn that occur in the first 2 to 3 weeks following birth (36). The second DXA assessment was conducted, on average, at 6 months of age [6.3 ± 0.46 mean (±SD) months]. To account for effects of ages at assessment, %BF was residualized for gestational age at birth and postnatal age at scan. Adiposity gain was defined as the difference between the age-adjusted ∼1-month %BF and ∼6-month %BF.
Newborn and infant anthropometry
At both the newborn (∼1-month) and 6-month DXA visits, infant weight and length were measured in triplicate by trained operators, and average values were computed. Infants were weighed without clothes or diaper on a calibrated Seca weight scale to the nearest 0.01 kg. Infant crown-to-heel length was measured to the nearest 0.1 cm using a Seca hard-surface measuring board.
Infant feeding
Infant feeding method (breast or formula) was assessed via maternal interviews at the newborn and 6-month DXA assessments. All babies were breastfed at the time of the newborn DXA assessment. To control for infant feeding status over the 6-month postnatal period, a variable was computed indexing whether the mother continuously breastfed her child until 6 months of age.
Maternal anthropometry, obstetric risk conditions, sociodemographic characteristics, and birth outcomes
Maternal sociodemographic characteristics (age, education, income, parity) were obtained via a standardized structured interview at the first pregnancy visit. Maternal prepregnancy BMI (weight kg/height m2) was computed based on prepregnancy weight abstracted from the medical record, and maternal height was measured at the research laboratory during the first pregnancy visit. Obstetric risk conditions during pregnancy, including presence of gestational diabetes, and birth outcomes (gestational age at birth and newborn birth weight) were abstracted from the medical record. In accordance with American Diabetes Association and American Congress of Obstetricians and Gynecologists guidelines, gestational diabetes diagnosis was made using a sequential model of universal screening with a 50-g 1-hour glucose challenge test, followed by a diagnostic 100-g 3-hour oral glucose tolerance test for women with a positive screening test.
Statistical analyses
Change in maternal cortisol AUCs from T1 to T3 was examined using repeated measure analysis of variance. Separate linear regression models were run to examine the association between maternal cortisol and the following outcomes: %BF at birth, %BF at 6 months of age, and change in %BF from 1 to 6 months of age. These outcomes were characterized from the DXA-based measures as well as from the weight-for-length–based measures.
To determine stage-of-gestation–specific effects of maternal cortisol on our primary outcome (infant adiposity), we used adjusted T2 and T3 cortisol AUC measures for the conditional effect of cortisol production in earlier gestation on cortisol production in subsequent stages of gestation. We suggest this approach is more valid than the simpler alternative of considering the unadjusted cortisol values at the different time points across gestation because the unadjusted values do not account for the observation that cortisol production at later time points in gestation is, in part, conditioned by cortisol production at earlier time points. Maternal cortisol production across the course of pregnancy exhibits three characteristics. First, the state of pregnancy produces a progressive and approximately linear increase in maternal cortisol production over gestation. The average cortisol AUCs in our study population in the late first (T1), midsecond (T2), and early third (T3) trimesters are 0.232 ± 0.122, 0.258 ± 0.099, and 0.317 ± 0.101 μg/dL/h (±SD), respectively, indicating a ∼1.37-fold increase from early to late gestation. Second, there is substantial between-subject variability in cortisol production at and across the 3 time points in early, mid, and later gestation (as evident from the aforementioned SD estimates relative to the means). Third, the cortisol measures at T1, T2, and T3 are not independent. There is substantial, but not complete, within-subject stability in cortisol production across gestation, with correlations ranging between r = 0.403 and 0.502 (all P values < 0.001). The intraclass coefficient of cortisol production across gestation (proportion of total variation in cortisol that is attributable to variation between subjects, or the extent to which measures on the same subject across time are correlated after accounting for the gestational age effect) is 0.418, indicating greater between-subject variability relative to within-subject across time (gestation) variability. This provides the basis for examining stage-of-gestation–specific effects of cortisol. The T1 cortisol AUC effect is interpreted as the effect of cortisol production in early gestation on infant adiposity. The T2 cortisol AUC effect is interpreted as the effect of cortisol production in midgestation accounting for cortisol production in early gestation on infant adiposity. And the T3 cortisol AUC effect is interpreted as the effect of cortisol production in late gestation, accounting for cortisol production in early and midgestation on infant adiposity.
All analyses accounted for the potential effects of key pregnancy, birth, and postnatal maternal and child characteristics, including an estimate of maternal sociodemographic status (annual total household income), prepregnancy BMI, parity, presence of gestational diabetes, infant birth weight, gestational age at birth, infant sex, and infant feeding status. Additional analyses stratified by infant sex were performed to examine whether effects differed in male and female infants. Diagnostics were performed to assess the validity of standard linear regression assumptions. No extreme departures from general assumptions were observed, and no observations were removed from the analysis. All statistical analyses were performed using SPSS v22 (IBM, Armonk, NY), and the statistical significance level was set at α = 0.05.
Results
As expected, maternal cortisol concentrations increased significantly across pregnancy [F(1.9; 138.3) = 82.7, P < 0.001; for change in average cortisol AUC from T1 to T3, see Table 2 for average cortisol concentrations at each time point].
Maternal Salivary Cortisol Values (in μg/dL, Mean ± SD) at Each Assessment Time Point; Concentrations for Each Time Point Are Averaged Across the 4-Day Assessment Period
| T1 (≅13-Week Gestation) | T2 (≅24-Week Gestation) | T3 (≅30-Week Gestation) | |
|---|---|---|---|
| Awakening | 0.404 (0.210) | 0.480 (0.200) | 0.519 (0.180) |
| +30 min after awakening | 0.490 (0.210) | 0.561 (0.218) | 0.645 (0.270) |
| 12 PM | 0.215 (0.130) | 0.257 (0.158) | 0.331 (0.134) |
| 4 PM | 0.151 (0.102) | 0.192 (0.144) | 0.236 (0.120) |
| 8 PM | 0.110 (0.096) | 0.125 (0.100) | 0.174 (0.124) |
Mean infant %BF (by DXA) at ∼1 month and at ∼6 months of age was 14.5 ± 4.8 (mean ± SD, range 2.2–22.6) and 32.4 ± 8.4 (range 16.8–48.4), respectively. The average change in %BF from 1 to 6 months of age was 17.9 ± 8.5% (range 1.2–48.5), indicating substantial interindividual variability in early postnatal fat gain. The ∼1-month %BF only modestly predicted %BF at 6 months of age (r = −0.257, P = 0.025).
The results of the multivariate regression analyses depicting prospective associations between maternal cortisol and infant body composition before and after adjustment for covariates are shown in Table 3. There was no significant relationship between the early gestation (T1) or midgestation (T2) cortisol measures with the infant body composition (% fat mass) measures. However, and consistent with our hypothesis, the late gestation (T3) maternal cortisol measure (i.e., maternal T3 cortisol conditioned upon T2 and T1 cortisol) was significantly and positively associated with the change in %BF from 1 to 6 months [partial r (adjusted for covariates) = 0.379, P = 0.007; see Fig. 2]. Specifically, a 1 SD unit increase in the maternal cortisol AUC measure at T3 was associated with a 4% change in %BF from 1 to 6 months. Although there was no effect on %BF at birth, higher maternal cortisol at T3 was significantly associated with higher %BF at 6 months (partial r = 0.274, P = 0.045).
Associations of Maternal Salivary Cortisol Concentrations in Early, Mid, and Late Gestation With Infant Adiposity Measures Before and After Adjusting for Covariates
| Unadjusted | Adjusteda | |||||
|---|---|---|---|---|---|---|
| %BF at Birth | %BF at 6 Months | Change in % BF From 0 to 6 Months | %BF at Birth | %BF at 6 Months | Change in % BF From 0 to 6 Months | |
| Maternal cortisol in early gestation (T1) | −0.040 | 0.158 | 0.174 | 0.036 | 0.054 | 0.040 |
| Maternal cortisol in midgestation (T2) adjusted for T1 cortisol | 0.013 | 0.081 | 0.086 | −0.096 | −0.003 | 0.053 |
| Maternal cortisol in late gestation (T3) adjusted for T1 and T2 cortisol | −0.115 | 0.187 | 0.359b | 0.129 | 0.274c | 0.379b |
Adjusted for maternal prepregnancy BMI, parity, presence of gestational diabetes during pregnancy, maternal socioeconomic status, infant birth weight, infant sex, and infant feeding status.
Significant correlations at P < 0.01.
Significant correlations at P < 0.05.
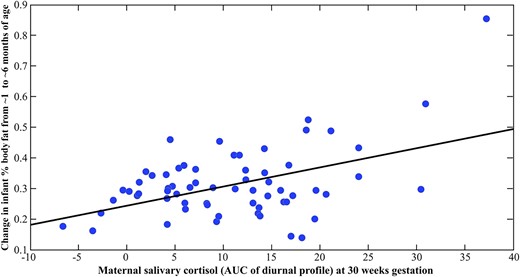
Scatterplot depicting the association between maternal salivary cortisol concentrations at 30 weeks gestation and change in infant %BF from 1 to 6 months of age. Change in infant %BF was residualized (adjusted) for prepregnancy BMI, parity, presence of gestational diabetes during pregnancy, maternal cortisol concentrations at 13 and 24 weeks gestation, infant birth weight, infant sex, and infant feeding status.
Analyses stratified by infant sex revealed that the effect of maternal T3 cortisol on change in %BF was present and of approximately similar magnitude in male (partial r = 0.487) and female (partial r = 0.424) infants.
Commonly used weight- and length-based proxy measures of infant adiposity (i.e., weight-for-length ratio) were only weakly associated with the direct DXA-based measures of infant adiposity (r values ranged between 0.21 and 0.42), and there were no statistically significant associations of any of the maternal cortisol measures in pregnancy with weight-for-length ratio at birth, at 6 months of age, or the change in weight-for-length-ratio from 0 to 6 months of age (all P values > 0.20; data not shown).
Discussion
The present findings link maternal cortisol in human pregnancy with infant adiposity in early postnatal life. Specifically, maternal cortisol production in the later stage of pregnancy (conditioned on prior early and midgestation cortisol concentrations) was positively associated with the magnitude of infant %BF change over the first 6 months of postnatal life. The effect was significant after adjusting for the effects of other established pregnancy, birth, and postnatal maternal and infant factors associated with infant adiposity. The effect was evident in female and male infants. The magnitude of the effect was substantial, with the maternal third-trimester cortisol measure independently accounting for ∼14% of the variance in infant body fat increase over the first 6 months of postnatal life. The potential clinical significance of this finding is underscored by the fact that several studies suggest that growth velocity, and particularly the increase in fat mass during early infancy, is among the most reliable predictors of childhood obesity risk (31–33).
Infant weight-for-length–based estimate of body composition was unrelated to any of the maternal cortisol in pregnancy measures (and only modestly to DXA-based measures). This finding underscores the importance, particularly in the context of fetal programming of childhood obesity, of using direct measures of infant body composition rather than relying on indirect proxy measures.
The observation that we found an effect of maternal cortisol concentrations on change in %BF from 0 to 6 months and on %BF at 6 months, but not on %BF at birth, suggests that in utero cortisol exposure may program adipose tissue development such that when exposed to ex utero energy substrate, adipocytes store a greater proportion of excess energy substrate as fat (rather than expend excess energy by heat production), which, in turn, suggests programming. One target of such programming may be mitochondrial function and regulation, which is essential for energy metabolism and energy balance. It has been shown that chronically elevated glucose levels damage mitochondria and mitochondrial DNA to alter energy metabolism [summarized in (37, 38)]. Cortisol, acting as a catabolic hormone, induces several processes leading to increased concentrations of blood glucose through the process of gluconeogenesis. It is, therefore, possible that the hormonal changes in the fetal compartment induced by elevated levels of cortisol in the maternal and fetal circulation could contribute to increased glucose concentration that downregulates mitochondrial efficiency, resulting in a higher propensity to store excess energy rather than expend it.
Converging evidence from animal and human studies suggests that glucocorticoid exposure during fetal development may promote adipogenesis. Glucocorticoids have both lipolytic and adipogenic effects, depending on the concentration, duration, and type of glucocorticoid exposure. Short-term administration of synthetic GC induces adipose tissue lipolysis (39, 40). However, prolonged exposure to GC promotes adiposity, as seen in patients with Cushing’s syndrome (41) or in those receiving treatment with synthetic glucocorticoids (42). During adipose tissue development, glucocorticoids stimulate the differentiation of adipose precursor cells and seem to enhance terminal differentiation of adipocytes, depending on the concentration of glucocorticoids and the presence of insulin (43, 44). A rodent study of adipogenesis that used both in vitro and in vivo glucocorticoid exposure reported that in vitro GC exposure induced an increase in the differentiation of preadipocytes to adipocytes in a dose-dependent manner, and that in vivo exposure (implantation of corticosterone pellets) produced greater visceral adiposity (45). Several porcine studies also have investigated the effects of hydrocortisone administration during fetal development. Hypophysectomized pig fetuses were treated with hydrocortisone, and the proportion of preadipocytes in cell cultures derived from these fetuses was double that of untreated fetuses (46). Furthermore, the responsiveness of preadipocytes to glucocorticoids increases progressively with fetal age (47), suggesting that the later stage of gestation—which also is the period in which fetal adipogenesis is at its peak—may be a particularly sensitive period for programming of adipocytes by glucocorticoid exposure. Consistent with this notion, we found an effect of maternal cortisol on infant adiposity during only the third trimester, and findings of two studies that showed that maternal CRH concentrations are associated with increased child obesity risk also report this effect during the late second and third trimesters (23, 24). Taken together, the literature supports our finding that exposure to inappropriate concentrations of glucocorticoids, particularly during the sensitive developmental window in later gestation, may contribute to higher adiposity and subsequent obesity risk.
Implicit in human studies of maternal cortisol in pregnancy, including this study, is the premise that cortisol levels in the maternal compartment are an indicator of fetal glucocorticoid exposure. This premise is supported by several plausible pathways (48), as follows: fetal exposure to maternal cortisol is regulated by the placental enzyme, 11β-HSD2, which oxidizes cortisol to its inactive form cortisone (49). Because placental 11β-HSD2 serves as only a partial barrier, some proportion of active maternal cortisol does pass through the placenta into the fetal compartment (50). Interestingly, many adverse intrauterine conditions that have been associated with impaired childhood obesity also have been associated with a downregulation of placental 11β-HSD2 activity, including maternal stress (51), infection (52), and proinflammatory cytokines (53). Another plausible pathway by which maternal cortisol can produce elevations in fetal cortisol is by stimulating and thereby increasing the production of placental CRH (54, 55), which is known to act on the fetal hypothalamic-pituitary-adrenal axis and stimulate adrenal steroid biosynthesis. Finally, a small number of human studies that have obtained paired maternal and fetal plasma samples during gestation (56), or paired maternal and cord blood samples at delivery (57), have reported significant correlations between maternal and fetal/newborn concentrations of cortisol.
Strengths of our present study include the prospective design with repeated measures of maternal cortisol over gestation (total of 60 samples per women), the assessment of free (biologically active) cortisol concentrations in saliva, and the assessment of infant adiposity with a reliable, validated method (DXA). Replication in an independent cohort is warranted, along with future studies that incorporate measures of metabolic function, mitochondrial activity, and differentiation between white and brown adipose tissue depots and also perform longitudinal follow-up to quantify changes in adiposity from birth into infancy to childhood and beyond, along with the concurrent characterization of other infant and child phenotypes of interest.
To conclude, greater maternal cortisol concentration in the early third trimester of gestation (conditioned upon cortisol in early and midgestation) was significantly associated with higher infant adiposity. Questions remain regarding the molecular mechanisms underlying this effect and the nature of potential interactions with other biological and environmental processes. However, the current finding represents an important advance because it adds evidence in humans to support the role of glucocorticoids in fetal programming of obesity risk.
Abbreviations:
- 11β-HSD
11 β-hydroxysteroid dehydrogenase
- AUC
area under the curve
- %BF
percent body fat
- BMI
body mass index
- CRH
corticotrophin-releasing hormone
- DXA
dual-energy X-ray absorptiometry
- GC
glucocorticoids
- SD
standard deviation.
Acknowledgments
This work was supported in part by US Public Health Service (National Institutes of Health) Grants R01 HD-065825, R01 HD-060628, and R21 DK-098765 (all to S.E. and P.D.W.), and University of California, Irvine, Institute for Clinical and Translational Science (CTSA Grant) UL1 TR000153.
Disclosure Summary: The authors have nothing to disclose.
References
Author notes
Address all correspondence and requests for reprints to: Sonja Entringer, PhD, Institute for Medical Psychology, Charité Universitätsmedizin Berlin, Luisenstrasse 57, 10117 Berlin, Germany. E-mail: [email protected].
