


Abstract
Insulin resistance and metabolic inflexibility are features of obesity and are amplified by fasting. Growth hormone (GH) secretion increases during fasting and GH causes insulin resistance.
To study the metabolic effects of GH blockade during fasting in obese subjects.
Nine obese males were studied thrice in a randomized design: (1) after an overnight fast (control), (2) after 72 hour fasting (fasting), and (3) after 72 hour fasting with GH blockade (pegvisomant) [fasting plus GH antagonist (GHA)]. Each study day consisted of a 4-hour basal period followed by a 2-hour hyperinsulinemic, euglycemic clamp combined with indirect calorimetry, assessment of glucose and palmitate turnover, and muscle and fat biopsies.
GH levels increased with fasting (P < 0.01), and the fasting-induced reduction of serum insulin-like growth factor I was enhanced by GHA (P < 0.05). Fasting increased lipolysis and lipid oxidation independent of GHA, but fasting plus GHA caused a more pronounced suppression of lipid intermediates in response to hyperinsulinemic, euglycemic clamp. Fasting-induced insulin resistance was abrogated by GHA (P < 0.01) primarily due to reduced endogenous glucose production (P = 0.003). Fasting plus GHA also caused elevated glycerol levels and reduced levels of counterregulatory hormones. Fasting significantly reduced the expression of antilipolytic signals in adipose tissue independent of GHA.
Suppression of GH activity during fasting in obese subjects reverses insulin resistance and amplifies insulin-stimulated suppression of lipid intermediates, indicating that GH is an important regulator of substrate metabolism, insulin sensitivity, and metabolic flexibility also in obese subjects.
Obesity is associated with insulin resistance and type 2 diabetes (1), and calorie restriction, which improves insulin sensitivity, remains a part of the treatment (2). Obesity also causes impaired metabolic flexibility, that is, the capacity to switch from glucose to fat utilization postabsorptively and vice versa during the postprandial period (3).
Growth hormone (GH) secretion is stimulated during fasting and activates lipolysis, which leads to insulin resistance (4–6). These actions are potentially favorable due to the indirect protein sparing effect (7). Obesity is associated with blunted GH secretion (8), which reverts after weight loss or drug-induced reduction of free fatty acid (FFA) levels (9, 10). There is also evidence to suggest that fasting-induced stimulation of GH secretion is reduced in obesity (11, 12).
This study was designed to test the hypothesis that GH secreted during fasting in obese subjects contributes to insulin resistance and metabolic inflexibility. To this end, we studied nine obese subjects during 72 hours fasting in the presence and absence of GH receptor (GHR) blockade with a specific GH antagonist (GHA). The experimental paradigm included assessment of glucose and lipid turnover before and after a hyperinsulinemic, euglycemic glucose clamp.
Methods
Subjects
Nine healthy overweight and obese men with a median age of 24 years (range, 20 to 32) and a mean body mass index of 30 ± 1.1 kg/m2 were included in the study, which was approved by the Central Denmark Region Scientific Ethics Committee (1-10-72-318-14) and conducted in accordance with the Declaration of Helsinki II and reported at http://www.clinicaltrials.gov (NCT02500095). Written consent was obtained from all subjects after appropriate deliberation time prior to oral and written information.
Study design
The subjects were studied on three occasions separated by at least 4 weeks in a randomized, placebo-controlled crossover design: (1) after an overnight fast (12 hours) (control), (2) after 72 hours fasting and placebo injections (fasting), and (3) after 72 hours of fasting in combination with administration of a GHA [pegvisomant (Somavert® 20 mg × 3)] (fasting plus GHA).
During fasting the subjects were allowed to drink tap water and refrained from physical exercise and alcohol 48 hours before onset of fasting. Each examination day lasted from 8:00 am (t = 0 minutes) until 2:00 pm (t = 360 minutes). Intravenous catheters were placed for infusions and blood sampling. One catheter was placed in a heated dorsal hand vein for sampling of arterialized blood. In the same arm, a catheter was placed in an antecubital vein for infusions.
Hyperinsulinemic, euglycemic clamp
The study consisted of a 4-hour basal period (t = 0 to 240 minutes) followed by a 2-hour hyperinsulinemic, euglycemic clamp (HEC; t = 240 to 360 minutes) as previously described (13). Insulin was infused at a rate of 40 mU/m2 body surface area/minute during the HEC (Insulin Actrapid; Novo Nordisk, Copenhagen, Denmark). Variable rates of 20% glucose infusion were used to clamp plasma glucose concentrations at ≈5 mmol/L according to plasma glucose measurements every 10 minutes. Acceptable steady-state glucose levels were achieved with coefficients of variation (%) during the last 30 minutes of the HEC of 4 (3 to 5) (control), 2 (1 to 3) (fasting), and 3 (2 to 5) (fasting plus GHA), respectively.
Indirect calorimetry
The respiratory quotient (RQ) and resting energy expenditure (REE) were estimated by indirect calorimetry (Oxycon Pro; CareFusion, Hoechberg, Germany) performed at t = 180 to 195 minutes and t = 315 to 330 minutes, respectively. Urine was collected from t = 0 to t = 240 minutes (basal period) and from t = 240 to t = 360 minutes (HEC) to measure urea content (14). The rates of glucose and lipid oxidation were estimated after correction for protein oxidation (15).
Glucose metabolism
Throughout the examination day, [3-3H]glucose (NEN Life Science Products, Boston, MA) was infused in a primed (20 μCi) continuous manner (0.12 μCi/minute). To minimize rapid dilution during the HEC, [3-3H]glucose was added to the infused glucose (100 μCi [3-3H]glucose/500 mL 20% glucose).
Glucose rate of appearance (Ra) and disappearance (Rd) were estimated by Steele’s equation (16). Endogenous glucose production (EGP) equals Ra under basal conditions, and EGP during the HEC was calculated by subtracting the mean glucose infusion rate (GIR) from glucose Ra. Nonoxidative glucose disposal (NOGD) was estimated as oxidative glucose disposal subtracted from Rd.
Urea tracer
A primed (309.6 mg) continuous [13C]urea infusion of 42 mg/hour was given and [13C]urea enrichment was measured using high-performance liquid chromatography (HPLC; RF2000 fluorescence detector, P680 pump, ASI-100, TCC100; Dionex, Amsterdam, The Netherlands) (17).
Palmitate tracer
Systemic palmitate flux was calculated using the isotope dilution technique with a constant infusion of albumin-bound [9,10-3H]palmitate (0.3 μCi/minute) (PerkinElmer, Mechelen, Belgium/Department of Clinical Physiology and Nuclear Medicine, Aarhus University Hospital, Aarhus, Denmark) from t = 180 to 240 minutes and t = 300 to 360 minutes. Measurements were done before the infusion and in triplicate during the last 30 minutes of the infusion period. Plasma palmitate concentration and specific activity were measured by HPLC using [2H31]palmitate as an internal standard, and palmitate flux (μmol/minute) was calculated as previously described (18).
Pegvisomant administration
Pegvisomant (Somavert® 20 mg) or placebo was injected subcutaneously thrice during fasting plus GHA: 72 hours prior to fasting, at the beginning of fasting, and after 48 hours of fasting. Pegvisomant was assayed as previously described (19).
Muscle and adipose tissue biopsy
Muscle and adipose tissue biopsies were obtained under sterile conditions using local anesthesia at t = 60 and t = 270 minutes. Muscle biopsies were obtained from m. vastus lateralis of the quadriceps muscle with a Bergström cannula, snap-frozen in liquid nitrogen, freeze-dried for 48 hours, and dissected free of fat and connective tissue under a stereomicroscope. Adipose tissue biopsies were sampled from the abdominal subcutaneous adipose tissue using a lipid suction technique and immediately washed free of blood and frozen in liquid nitrogen. All biopsies were stored at −80°C.
Western blotting
Approximately 5 mg of freeze-dried muscle tissue and 100 mg of adipose tissue were prepared for western blotting using the same protocol and equipment as previously described (20, 21). Membranes were initially incubated with phospho-specific antibodies. Subsequently, the antibodies were stripped off and the membranes were reblocked and reincubated with antibodies against nonphosphorylated protein. Antibodies against target proteins are listed in Supplemental Table 1.
Extraction of RNA and quantitative polymerase chain reaction for messenger RNA analysis
RNA was extracted using TRIzol (Gibco BRL/Life Technologies, Roskilde, Denmark) using a mixer mill. The polymerase chain reaction reactions were performed in duplicate using a LightCycler SYBR Green master mix in a LightCycler 480 (Roche Applied Science, Penzberg, Germany). The housekeeping gene, β2 microglobulin, was similar between all interventions in skeletal muscle tissue and adipose tissue. The primer sequences are listed in Supplemental Table 2 (22).
Blood analysis
Plasma glucose was immediately measured (YSI 2300 STAT Plus glucose analyzer; YSI, Burlington, VT). Serum samples were stored at −20°C and assayed in the same run after study completion. Insulin was analyzed using a commercial enzyme-linked immunosorbent assay kit (Dako, Glostrup, Denmark), as was C-peptide (ALPCO, Salem, NH), glycerol (Cayman Chemical, Ann Arbor, MI), and FFA (Wako Chemicals, Neuss, Germany). Serum cortisol concentrations were determined by enzyme-linked immunosorbent assay (DRG Diagnostics, Marburg, Germany), plasma glucagon concentrations using a radioimmunoassay (EMD Millipore, Darmstadt, Germany) and serum GH and insulin-like growth factor I (IGF-I) concentrations using chemiluminescence technology (IDS-iSYS human GH and IGF-I; Immunodiagnostic Systems, Boldon, UK). Serum concentrations of β-hydroxy β-methylbutyrate (HMB) and β-hydroxybutyrate (BHB) were measured using hydrophilic interaction liquid chromatography–tandem mass spectrometry (23). Plasma epinephrine and norepinephrine concentrations were measured by electrochemical detection following HPLC.
Liver spectroscopy
Intrahepatic lipid (IHL) was measured with 1H magnetic resonance spectroscopy as previously described (24, 25). For practical reasons, spectroscopy was performed after 48 hours of fasting during fasting and fasting plus GHA.
Statistics
Normally distributed data are presented as mean ± standard error (SE) or mean + confidence intervals (CIs). Nonnormally distributed data were logarithmically transformed and presented as geometric mean ± SE on a logarithmic scale on graphs or as geometric mean + CI in tables. All statistical analyses and graphs were made using Stata 13 (StataCorp, College Station, TX) and Sigmaplot 11 (Systat Software, San Jose, CA). Statistical comparisons between the study days were performed by a mixed effect two-way analysis of variance with repeated measures to detect possible main effects and interactions between interventions (control, fasting, and fasting plus GHA) and HEC and adjusted for the random order of interventions. Linear pairwise comparisons were performed post hoc to compare differences between interventions. P values of <0.05 were considered significant. Normal distribution was evaluated by inspection of Q-Q plots of the residuals from the mixed model. Unadjusted values are presented in tables and graphs. Correlation coefficients were estimated as Pearson correlation coefficient (r). Composite endpoints were calculated as summed z scores [(actual value − mean)/SD].
Results
The weight loss (kg) after fasting was 3.8 ± 0.6 (P < 0.01), which was comparable (P = 0.32) to the result after fasting plus GHA (4.5 ± 0.9; P < 0.01).
Serum levels of GH, pegvisomant, and IGF-I
Serum GH levels increased during fasting compared with control, and fasting plus GHA induced no additional increase in serum GH levels [Fig. 1(a) and 1(b)]. Circulating pegvisomant levels during fasting plus GHA were 1965 ± 244 µg/L (basal period) and correlated negatively with body mass index (r = −0.79; P = 0.02). Serum IGF-I levels decreased with fasting and the fasting-induced decrease in IGF-I was significantly accentuated by GHA [Fig. 1(c)]. The GHA-induced IGF-I reduction correlated positively with serum pegvisomant levels (r = 0.80; P = 0.01) [Fig. 1(d)].
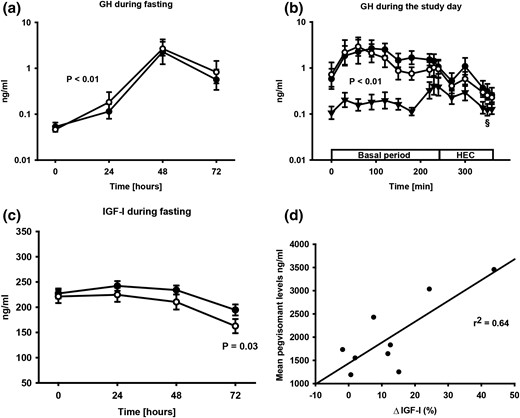
(a) Geometric mean ± SE. GH levels during fasting (●) and fasting plus GHA (○). (b) Geometric mean ± SE. GH levels on each study day consisting of a basal period and HEC. GH levels were elevated during fasting (●) and fasting plus GHA (○) compared with control (▲). §GH levels decreased during the HEC after fasting and fasting plus GHA (P < 0.01). (c) Mean ± SE. IGF-I levels during fasting (●) and fasting plus GHA (○). (d) Correlation between serum pegvisomant levels and the GHA-induced reduction in serum IGF-I levels (ΔIGF-I).
Glucose, lipid, and protein oxidation rates
REE during fasting was comparable to control, whereas fasting plus GHA was associated with increased REE as compared with control. REE did not change during the HEC in either study (Table 1). Urea turnover (μmol/kg/hour) did not change significantly with fasting, but was reduced after fasting plus GHA as compared with fasting [316 (252–380) (control) vs 323 (258–389) (fasting) vs 284 (200–368) (fasting plus GHA); fasting vs fasting plus GHA, P = 0.07]. Urinary nitrogen excretion rates and protein oxidation rates did not differ between the three experiments (Table 1). Serum urea levels (mmol/L), however, were lower during fasting plus GHA compared with fasting (4.9 ± 0.24 vs 5.2 ± 0.2; P = 0.045), but they were comparable with control (5.2 ± 0.3; P = 0.43). RQ decreased significantly and to the same degree after fasting and fasting plus GHA compared with control. The HEC failed to significantly increase RQ in either of the studies (P = 0.58) (Table 1). Fasting, irrespective of GHA, markedly decreased glucose oxidation concomitantly with increased lipid oxidation compared with control, and insulin stimulation during the HEC failed to significantly increase glucose oxidation and decrease lipid oxidation in either study (Table 1).
Circulating Hormones, Metabolites, and Oxidation Rates
| Control | Fasting | Fasting Plus GHA | ||||
|---|---|---|---|---|---|---|
| Basal | HEC | Basal | HEC | Basal | HEC | |
| Glucose, mmol/L | 5.2 (4.8–5.5) | 4.6 (4.4–4.9)a | 3.9 (3.6–4.2)b | 4.9 (4.7–5.1)a | 3.9 (3.6–4.2)c | 5.0 (4.8–5.1)a |
| Insulin, pmol/L | 43 (30–61) | 297 (231–382)a | 23 (17–30)b | 254 (177–364)a | 23 (15–34)c | 350 (267–460)a |
| C-peptide, pmol/L | 368 (258–479) | 264 (163–366)a | 177 (128–225)b | 252 (151–353)a | 224 (137–312)c | 305 (230–380)a |
| Glucagon, ng/L | 67 (45–90) | 48 (36–59)a | 93 (73–113)b | 58 (39–77)a,b | 85 (72–97)c | 48 (36–60)a |
| Cortisol, nmol/L | 86 (58–127) | 70 (49–101) | 91 (62–132)b | 119 (79–178)b | 86 (59–124) | 77 (55–107) |
| NE, pg/mL | 132 (88–175) | 159 (116–202) | 246 (134–358)b | 213 (150–275)b | 213 (130–296)d | 200 (136–263)d |
| EPI, pg/mL | 35 (25–48) | 47 (35–63)a | 43 (31–60) | 49 (39–61)a | 35 (25–47) | 44 (31–61)a |
| FFA, mmol/L | 0.38 (0.26–0.50) | 0.03 (0.01–0.06)a | 0.85 (0.73–0.97)b | 0.29 (0.19–0.39)a,b | 0.91 (0.75–1.1)c | 0.21 (0.1–0.32)a,d |
| Palmitate, μmol/L | 113 (78–148) | 18 (11–24)a | 327 (289–365)b | 101 (67–136)a,b | 316 (254–377)c | 81 (48–114)a,c |
| BHB, μmol/L | 37.3 (12.4–62.1) | 9.1 (2.1–16)e | 2137 (1486–2787)b | 1235 (807–1663)a,b | 2151 (1525–2778)c | 1066 (748–1383)a,c |
| HMB, μmol/L | 1.85 (1.46–2.24) | 1.62 (1.33–1.91)a | 4.74 (3.79–5.70)b | 4.0 (3.36–4.65)a,b | 4.57 (3.53–5.61)c | 3.82 (2.98–4.65)a,c |
| REE, kcal/d | 1793 (1573–2013) | 1818 (1638–1999) | 1837 (1619–2056) | 1816 (1609–2022) | 1922 (1745–2099)d | 1909 (1734–2085)d |
| RQ | 0.84 (0.79–0.89) | 0.88 (0.81–0.94) | 0.76 (0.73–0.78)b | 0.73 (0.71–0.76)b | 0.76 (0.72–0.79)c | 0.76 (0.70–0.82)c |
| POX, mg/kg/min | 0.82 (66–98) | 0.77 (0.62–0.91) | 0.75 (0.60–0.90) | 0.69 (0.44–0.94) | 0.75 (0.67–0.83) | 0.78 (0.62–0.93) |
| GOX, mg/kg/min | 1.1 (0.58–1.57) | 1.54 (0.73–2.36) | 0.24 (−0.1 to 0.54)b | −0.01 (−0.26 to 0.23)b | 0.24 (−0.23 to 0.70)c | 0.34 (−0.47 to 1.16)c |
| NOGD, mg/kg/min | 0.11 (−0.44 to 0.65) | 1.56 (0.31–2.81)a | 0.68 (0.36–1.0)f | 1.61 (1.25–2.0)a,f | 0.68 (0.32–1.0) | 1.41 (0.47–2.35)a |
| LIPOX, mg/kg/min | 0.47 (0.23–0.72) | 0.34 (0.02–0.66) | 0.93 (0.78–1.09)b | 1.03 (0.82–1.24)b | 1.02 (0.78–1.26)c | 0.95 (0.61–1.29)c |
| UNSR, g/d | 18 (14–22) | 17 (14–20) | 16 (13–18) | 14 (10–19) | 16 (14–18) | 16 (13–19) |
All values are presented as (geometric) mean (95% confidence interval) in the basal period and the HEC. P values are based on post hoc statistics.
Abbreviations: EPI, epinephrine; GOX, glucose oxidation; LIPOX, lipid oxidation, NE, norepinephrine; POX, protein oxidation; UNSR, urinary nitrogen excretion rate.
P < 0.01 for basal period vs HEC.
P < 0.01 for control vs fasting.
P < 0.01 for control vs fasting plus GHA.
P < 0.05 for control vs fasting plus GHA.
P < 0.05 for basal period vs HEC.
P < 0.05 for control vs fasting.
Insulin sensitivity and glucose turnover
The glucose infusion rate (GIR) during the HEC was significantly reduced after fasting compared with control [Fig. 2(a)]. This was associated with reduced glucose Rd [Fig. 2(b)]. The fasting-induced insulin resistance was abrogated by GHA administration predominantly owing to significant suppression of EGP during HEC (P = 0.003) [Fig. 2(c)], whereas Rd only increased insignificantly in response to GHA (P = 0.18) [Fig. 2(b)]. One subject was excluded from the analysis of the GIR and glucose tracer metabolism due to a non–steady-state at the end of the HEC because the coefficient of variation of this subject’s GIR was 0.69, which was well above the mean and upper CI (0.09 [0.04–0.15]). Fasting was associated with increased basal and insulin-stimulated NOGD, which was slightly less pronounced after fasting plus GHA (Table 1).
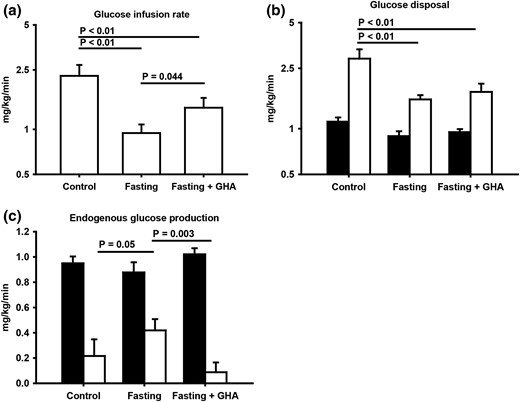
(a) Geometric mean ± SE for glucose infusion rate during the HEC. (b) Geometric mean ± SE glucose disposal in the basal period (filled bar) and during the HEC (open bar). (c) Mean ± SE endogenous glucose production in the basal period (filled bar) and during the HEC (open bar).
Glucose, insulin, and counterregulatory hormones
Fasting was associated with reduced (25% to 50%) circulating levels of glucose, insulin, and C-peptide without a detectable independent effect of GHA (Tables 1 and 2). Basal glucagon levels increased with fasting (≈40%), but less so (≈27%) after fasting plus GHA (P = 0.11). The insulin-stimulated decline in glucagon levels was less pronounced during fasting as compared with fasting plus GHA (Table 1). Fasting, but not fasting plus GHA, was associated with elevated basal cortisol levels (Table 1). Norepinephrine levels in plasma increased significantly in response to fasting with and without GHA (Table 1).
Circulating Hormones and Metabolites During the 72 h Fasting
| 0 h | 24 h | 48 h | 72 h | |||||
|---|---|---|---|---|---|---|---|---|
| Fasting | Fasting Plus GHA | Fasting | Fasting Plus GHA | Fasting | Fasting Plus GHA | Fasting | Fasting Plus GHA | |
| Glucose, mmol/L | 5.3 (4.8–5.8) | 5.4 (4.7–6.2) | 5.0 (4.8–5.3) | 5.2 (5.0–5.4) | 4.1 (3.9–4.4) | 4.2 (3.9–4.4) | 4.0 (3.7–4.3) | 3.9 (3.6–4.3) |
| FFA, mmol/L | 0.14 (0.05–0.23) | 0.14 (0.09–0.19) | 0.50 (0.41–0.58) | 0.48 (0.35–0.61) | 0.67 (0.51–0.83) | 0.81 (0.60–1.04) | 1.12 (0.90–1.34) | 1.28 (1.06–1.50) |
| BHB, μmol/L | 15.8 (11.4–20.3) | 17.1 (8.0–26.2) | 120 (71–170) | 123 (70–176) | 1192 (748–1636) | 1186 (672–1699) | 2327 (1598–3056) | 2268 (1659–2876) |
| Insulin, pmol/L | 185 (103–334) | 161 (97–269) | 48 (36–63) | 48 (33–70) | 27 (21–35) | 33 (25–44) | 31 (22–45) | 34 (26–46) |
| C-peptide, pmol/L | 1023 (603–1443) | 1013 (748–1278) | 314 (224–404) | 356 (263–450) | 185 (135–235) | 230 (151–310) | 213 (149–277) | 254 (162–346) |
Serum concentrations of pertinent hormones and metabolites during fasting and fasting plus GHA presented as (geometric) mean (95% confidence interval).
Lipid intermediates and palmitate turnover
Fasting was associated with significantly elevated basal levels of FFA (≈130%), BHB (≈570%), and HMB (≈150%) compared with control, which was not significantly modified by GHA. The HEC induced a decrease in lipid intermediates relative to the basal period in all studies. However, fasting was associated with elevated absolute levels of lipid intermediates during the HEC compared with control (Tables 1 and 2). The reduction in FFA levels (ΔFFA) during the HEC was more pronounced during fasting plus GHA (0.70 ± 0.08 mmol/L) compared with control (0.35 ± 0.05 mmol/L; P < 0.01) and fasting (0.56 ± 0.08 mmol/L; P = 0.06). The relative FFA reduction (%) during the HEC was also higher after fasting plus GHA (75 ± 5) compared with fasting (64 ± 6; P = 0.01) [Fig. 3(a)]. The relative reduction in BHB (%) was also increased during fasting plus GHA compared with fasting (52 ± 5 vs 42 ± 4; P = 0.05).

(a) Mean ± SE reduction (%) in FFA from the basal period to the HEC. (b) Mean ± SE for glycerol levels in the basal period (filled bar) and the HEC (open bar). (c) Mean ± SE palmitate fluxes in the basal period (filled bar) and the HEC (open bar). (d) Mean ± SE expression of glycerol channels in adipose tissue in the basal period. AQP7, aquaporin 7.
Fasting plus GHA was associated with increased basal levels of glycerol as compared with fasting and control [Fig. 3(b)].
Palmitate concentrations and fluxes increased with fasting and decreased during the HEC in all experiments (P < 0.01), but the absolute levels were higher during fasting compared with control [Table 1; Fig. 3(c)]. Overall, GHA did not influence palmitate concentrations or fluxes compared with fasting alone.
Intrahepatic lipid content
The amount of IHL (%) was comparable on the 3 study days [5.5 ± 2.2 (fasting) vs 5.0 ± 1.8 (fasting plus GHA) vs 5.7 ± 1.2 (control); P > 0.3].
GH signaling
Muscle tissue
STAT5b phosphorylation (pSTAT5) indicative of GHR activation was detected in five subjects during fasting and, surprisingly, also in three subjects after fasting plus GHA. In each case this was preceded by elevations in endogenous GH levels. Pegvisomant levels were identical among subjects with and without pSTAT5 during GHR blockade (P = 0.84). CISH and SOCS1/3 genes are transcribed upon STAT5 activation. CISH messenger RNA (mRNA) levels were unchanged during fasting compared with control (P = 0.78) but elevated during fasting plus GHA compared with control (P = 0.02). SOCS1/3 mRNA levels did not differ significantly between the three studies (data not shown). IGF-I gene expression was unchanged during fasting and fasting plus GHA compared with control (data not shown).
Adipose tissue
Fasting and fasting plus GHA were associated with pSTAT5 expression in four and three subjects, respectively. Serum pegvisomant levels in these three subjects did not differ from those subjects without pSTAT5 expression (P = 0.9). CISH mRNA levels were higher during fasting and fasting plus GHA compared with control (P = 0.03; P = 0.02). Composite endpoint analysis of CISH and SOCS1/3 demonstrated an increased expression of these GH-responsive genes after fasting compared with control (P < 0.01) without an independent effect of GHA (P = 0.77). In the basal period, IGF-I mRNA levels were lower after fasting and fasting plus GHA compared with control (P < 0.01; P = 0.01).
Regulation of lipolysis
Adipose tissue
Lipolytic activity in adipose tissue is stimulated in particular by activation of the β-adrenergic receptors and inhibited by insulin (26). The mRNA levels of the inhibitory regulators of lipolysis PDE3B and G0S2 were significantly decreased after fasting and fasting plus GHA compared with control (P < 0.01), whereas the mRNA levels of PTEN, which inhibits insulin signaling, were significantly increased after fasting (P < 0.01) and fasting plus GHA (P = 0.01) compared with control. Neither GHA nor HEC exhibited an independent impact on mRNA levels of G0S2, PDE3B, or PTEN (data not shown).
Protein expression of glycerol channels (aquaporin 7) in adipose tissue was comparable after all three interventions [Fig. 3(d)].
Discussion
In the present study we investigated the impact of endogenous GH on substrate metabolism during fasting in obese human subjects by means of a specific GHA. With this approach we recorded elevated endogenous GH levels in response to fasting, and we obtained sizable serum levels of the GHA concomitantly with a substantial reduction of serum IGF-I, indicative of suppressed GH activity. The GHA also abrogated fasting-induced insulin resistance predominantly via suppression of EGP. Finally, GHA was accompanied by more pronounced insulin-induced suppression of circulating lipid intermediates. Taken together, our study indicates that fasting-induced GH elevations contribute to insulin resistance and metabolic inflexibility in obese subjects.
The insulin antagonistic effects of GH in human subjects are extensively documented, especially in studies involving exogenous GH administration (4, 5, 27). Our observation that GHA primarily impacted EGP is in accordance with data in acromegaly, where pegvisomant is a licensed indication (28), and elevated EGP in active acromegaly is also reversed by curative surgery (29). In this context it is noteworthy that GHA in the present study was accompanied by elevated glycerol levels in the absence of changes in neither the expression of aquaporin 7 in adipose tissue nor lipolysis, both of which are compatible with reduced hepatic glycerol uptake (30–33). This could imply reduced hepatic gluconeogenesis from glycerol during fasting plus GHA, which fits the observation of reduced EGP. Additionally, the borderline decrease in ureagenesis during fasting plus GHA could reflect decreased hepatic gluconeogenesis from amino acids. Fasting in the presence of GHA was also associated with a reduced elevation in glucagon and cortisol, both of which stimulate gluconeogenesis (34).
In contrast to previous observations, IHL did not change during fasting (25) and was also not impacted by GHA. This is somewhat unexpected because GHA increases IHL in acromegaly, whereas GH reduces IHL in both human and mouse studies (35).
The impact of GHA on peripheral insulin sensitivity was less pronounced in our study, but in accordance with an earlier study in lean subjects where GHA did not impact peripheral insulin sensitivity during a short-term fast (36). Alternatively, we have previously shown that continued GH replacement in GH-deficient adults during 42.5 hours fasting primarily induces peripheral insulin resistance (37). The possible explanations for the discrepant results are several. First, the insulin infusion dose was higher in the latter study, which may have completely suppressed EGP and thus obviated a potential GH effect. Second, it is conceivable that GH blockade in obese subjects elicits different effects as compared with those observed after discontinuation of GH replacement in hypopituitary patients. Third, it is possible that our GHA model mainly suppressed hepatic GHR activation, which could explain the reduction in serum IGF-I levels and the suppression of hepatic glucose output. We did obtain serum pegvisomant levels close to those observed during pegvisomant treatment of acromegaly (38), which translates into symptom relief indicative also of peripheral GH blockade (39, 40). More intriguingly, we demonstrated evidence of pSTAT5 in muscle and adipose tissue during GHA indicative of GHR signaling. In indirect support of this, we did not record unequivocal suppression of STAT5-inducible target genes such as CISH, SOCS, and IGF-I in adipose tissue and skeletal muscle in response to GHA. Fasting per se, however, was associated with increased expression of both CISH and SOCS genes. It is also possible that pSTAT5 during GHA was induced by GH-independent mechanisms, because this signaling pathway can be activated by other cytokine receptors (41). Taken together, it remains to be investigated whether our current pegvisomant dose regimen preferentially blocked hepatic GHR and whether this can be overcome by increasing the dose or duration of administration.
Our study was also designed to illuminate the impact of GH on metabolic flexibility, which is of particular relevance in obese subjects (3). It has been shown that GH substitution reduces metabolic flexibility in GH-deficient patients during fasting (37). We did not record a significant effect of GHA on the oxidation rates of either fat or glucose before and after the HEC, but we did record that GHA was associated with more pronounced suppression of circulating lipid intermediates during the HEC, which is compatible with GH-induced metabolic inflexibility during fasting in obese subjects.
To elucidate the molecular mechanisms underlying fasting-induced lipolysis in obesity, we measured the expression of genes involved in antilipolysis. In accordance with previous data (42), the expression of G0S2, a known inhibitor of lipolysis, was reduced during fasting. The same was documented as regards the gene expression of PDE3B, which is an insulin-regulated suppressor of lipolysis (43). This was associated with increased expression of PTEN, which is a negative regulator of insulin signaling through phosphatidylinositol 3-kinase (44). In the present study, GHA exhibited no independent effect on the expression of these genes during fasting. It remains to be investigated whether this lack of effect is due to insufficient GH blockade in adipose tissue or other factors.
We have previously shown that GH-induced insulin resistance in GH-deficient patients during fasting is accompanied by stimulation of lipid oxidation and preservation of nitrogen (7), which can be considered a beneficial adaptation to fasting (4). In this context, it could be hypothesized that the reduced GH secretion in obesity (8), which also applies to fasting (12), aggravates protein loss during fasting or even calorie restriction. However, it is also possible that blunted GH levels in obesity represent a compensatory mechanism to protect against further impairment of insulin sensitivity. In the present study, we did not record significant changes in protein metabolism, and it remains to be investigated whether more intensified suppression of GH activity perhaps in combination with extended fasting or calorie restriction would impact on fat and protein metabolism. It is also noteworthy that our data stem from young obese males and therefore do not necessarily apply to females or subjects with a lean body composition. Nevertheless, our experimental study has demonstrated that endogenous GH is a significant determinant of substrate metabolism and insulin sensitivity in obese subjects.
Abbreviations:
- BHB
β-hydroxybutyrate
- CI
confidence interval
- EGP
endogenous glucose production
- FFA
free fatty acid
- GH
growth hormone
- GHA
growth hormone antagonist
- GHR
growth hormone receptor
- GIR
glucose infusion rate
- HEC
hyperinsulinemic, euglycemic clamp
- HMB
β-hydroxy β-methylbutyrate
- HPLC
high-performance liquid chromatography
- IGF-I
insulin-like growth factor I
- IHL
intrahepatic lipid
- mRNA
messenger RNA
- NOGD
nonoxidative glucose disposal
- pSTAT5
STAT5b phosphorylation
- Ra
rate of appearance
- Rd
rate of disappearance
- REE
resting energy expenditure
- RQ
respiratory quotient
- SE
standard error.
Acknowledgments
We thank Kirsten Nyborg Rasmussen, Elsebeth Hornemann, Lisa Buus, Helle Zibrandtsen and Annette Mengel of Medical Research Laboratories, Aarhus University Hospital, for excellent technical assistance.
This study was supported by Danish Council for Independent Research Grant DFF-4004-00304 and by Novo Nordisk Foundation Grant NNF-13OC0007869. This study was also supported in part by unrestricted research grants from the Novo Nordisk Foundation.
Clinical trial registry: ClinicalTrials.gov no. NCT02500095 (registered 10 July 2015).
Disclosure Summary: M.H.P. has received lecture fees from Pfizer. J.O.L.J. has received lecture fees and unrestricted research grants from Pfizer. The remaining authors have nothing to disclose.
References
Author notes
Address all correspondence and requests for reprints to: Morten Høgild Pedersen, MD, Department of Endocrinology and Internal Medicine, Aarhus University Hospital, Norrebrogade 44, 8000 Aarhus C, Denmark. E-mail: [email protected].
