


Abstract
Tumor angiogenesis is determined by host genetic background rather than environment. Germline single nucleotide polymorphisms (SNPs) of the vascular endothelial growth factor (VEGF) pathway have demonstrated prognostic value in different tumors.
Our main objective was to test the prognostic value of germline SNPs of the VEGF pathway in nonadvanced differentiated thyroid cancer (DTC). Secondarily, we sought to correlate analyzed SNPs with microvessel density (MVD).
Multicenter, retrospective, observational study.
Four referral centers.
Blood samples were obtained from consecutive DTC patients. Genotyping was performed according to the TaqMan protocol, including 4 VEGF-A (−2578C>A, −460T>C, +405G>C, and +936C>T) and 2 VEGFR-2 (+1192 C>T and +1719 T>A) SNPs. MVD was estimated by means of CD34 staining.
Rate of recurrent structural disease/disease-free survival (DFS). Difference in MVD between tumors from patients with different genotype.
Two hundred four patients with stage I–II DTC (mean follow-up, 73 ± 64 months) and 240 patients with low- to intermediate-risk DTC (mean follow-up, 70 ± 60 months) were enrolled. Two “risk” genotypes were identified by combining VEGF-A SNPs −2578 C>A, −460 T>C, and +405 G>C. The ACG homozygous genotype was protective in both stage I–II (odds ratio [OR], 0.08; 95% confidence interval [CI], 0.01 to 1.43; P = 0.018) and low- to intermediate-risk (OR, 0.14; 95% CI, 0.01 to 1.13; P = 0.035) patients. The CTG homozygous genotype was significantly associated with recurrence in stage I–II (OR, 5.47; 95% CI, 1.15 to 26.04; P = 0.018) and was slightly deleterious in low- to intermediate-risk (OR, 3.39; 95% CI, 0.8 to 14.33; P = 0.079) patients. MVD of primary tumors from patients harboring a protective genotype was significantly lower (median MVD, 76.5 ± 12.7 and 86.7 ± 27.9, respectively; P = 0.024).
Analysis of germline VEGF-A SNPs could empower a prognostic approach to DTC.
Incidence of differentiated thyroid cancer (DTC) is increasing worldwide (1) and thus is a relevant public health concern. Despite the steps forward in the knowledge of prognostic implications of tumor-specific genetic alterations (2), DTC prognostication is strongly limited by low specificity. This mainly hampers the management of nonadvanced disease, including a wide and heterogeneous range of patients with DTC, who usually achieve remission after thyroid ablation (surgery with or without radioiodine) but may develop recurrence. Vascularization has been associated with prognosis in different tumors (3). Efficiency of the angiogenic process mainly depends on the patient’s genetic background rather than environmental exposure (4), and this suggests that hereditary traits affecting angiogenesis may have a role in cancer evolution.
Because vascular endothelial growth factor (VEGF) A and its receptor VEGF receptor (VEGFR)-2 are the main regulators of the angiogenic process (5), recent cancer research has assessed the possible prognostic value of the genetic variability of these genes. In particular, many germline VEGF-A single nucleotide polymorphisms (SNPs) demonstrated an association with clinical outcome in different tumors (6–12). Importantly, prognostic significance greatly varied not only according to ethnicity and tumor type, as expected, but also on the basis of disease stage (13). Among hundreds of SNPs identified so far throughout the human VEGF-A gene, those with significant prognostic impact were located in regulatory regions, thus suggesting that the effect on cancer evolution was related to transcriptional or posttranscriptional regulation. Among these SNPs, those located in the promoter/5′ untranslated regions are believed to affect gene expression through the elimination/creation of transcription-factor binding sites (14), whereas those identified in the 3′ untranslated region likely act at the posttranscriptional level through the modulation of messenger RNA stability (Table 1.).
Localization, Minor Allele Frequency, Demonstrated/Putative Function, Biological Implications, and Association with Cancer Prognosis of Analyzed Polymorphisms
| SNPs per Gene | Region | MAF | Demonstrated/Putative Function | Preclinical Data on Functional Implicationsa | Prognostic Value in Cancera |
|---|---|---|---|---|---|
| VEGF-A | |||||
| −2578 C>A (rs699947) | Promoter | 0.324 | Gene expression through modification of TFBS | Homozygous minor AA genotype associated with lower VEGF-A production in an in vitro model of PBMC (18) | Colorectal (6), Kidney (7) |
| −460 T>C (rs833061) | Promoter | 0.369 | Gene expression through modification of TFBS | No preclinical data available | Gynecological (8, 11), Lung (12) |
| +405 G>C (rs2010963) | 5′ UTR | 0.326 | Gene expression through modification of TFBS | Homozygous minor CC genotype associated with lower VEGF-A production in an in vitro model of PBMC (14) | Colorectal (6), Breast (10), Gynecological (11), Lung (12) |
| +936 C>T (rs3025039) | 3′ UTR | 0.133 | Posttranscriptional regulation through modulation of mRNA stability | No preclinical data available | Colorectal (6, 13) |
| VEGFR-2 | |||||
| +1192 C>T (rs2305948) | Coding region | 0.152 | Ligand affinity through amino acid substitution within the extracellular domain (297V>I) | Combination of the minor alleles T and A (codifying for the VEGFR-2 IQ variant) associated with the lowest VEGF-A–binding efficiency in an in vitro model of HEK293 cells (17) | Colorectal (15) |
| +1719 T>A (rs1870377) | Coding region | 0.211 | Ligand affinity through amino acid substitution within the extracellular domain (472H>Q) | Diffuse large B-cell lymphoma (16) |
Abbreviations: MAF, minor allele frequency; PBMC, peripheral blood mononuclear cell; TFBS, transcription factor binding site; UTR, untranslated region.
Values in parentheses are reference citations.
To date, data on the possible effect of VEGFR-2 SNPs on cancer prognosis are poor (15, 16), but significant associations have been reported with several nonneoplastic conditions (17). This led to the identification of 2 nonsynonymous SNPs, the 1192 C>T (rs2305948) and the 1719 T>A (rs1870377), which are located in the coding region and determine amino acidic substitutions (297V>I and 472H>Q, respectively) within the extracellular domain. Importantly, functional analysis has demonstrated that exchange of these residues decreases the binding efficiency to VEGF-A (17) (Table 1). The primary objective of the current study was to test the prognostic value of germline SNPs of the VEGF pathway in homogeneous populations with nonadvanced DTC. The secondary objective was to determine correlation between the analyzed SNPs and microvessel density (MVD).
Patients and Methods
Patients and samples
We performed a multicenter retrospective study involving 4 neighbor centers from Naples, Italy (University Federico II, INT Pascale, Second University, and Cardarelli hospitals). The study was approved by the ethics committees of each included center, and informed consent was obtained from each patient before enrollment.
Inclusion criteria were as follows: (a) histologic diagnosis of DTC at local pathology review and (b) diagnosis and follow-up performed entirely at a single institution. The exclusion criterion was age younger than 18 years. Blood samples were obtained from consecutive DTC patients at postsurgical follow-up at the involved centers. Clinicopathologic data had been prospectively collected according to recommendations in each center. Patients were classified according to both the American Joint Committee on Cancer (AJCC)/Union for International Cancer Control (UICC) (I/II/III/IVa, b, c) and the American Thyroid Association (ATA) (low/intermediate/high risk) systems. Data on clinical outcome were obtained by consulting the files and, if necessary, by interviewing the attending physician or the patient. Follow-up data were last updated in December 2015 for all included patients.
Polymorphisms
Six SNPs were included in the analysis: −2578 C>A (rs699947), −460 T>C (rs833061), +405 G>C (rs2010963), and +936 C>T (rs3025039) for the VEGF-A gene and +1192 C>T (rs2305948) and +1719 T>A (rs1870377) for the VEGFR-2 gene. SNP selection was based on (a) previous documentation and characterization, (b) previous publications attesting to the possible effect on protein function and (c) previous data on the effect on cancer prognosis. Data on localization, minor allele frequency, and demonstrated/putative functional effect; preclinical data on functional implications, and data on association with cancer prognosis are summarized in Table 1.
DNA extraction and genotyping
DNA was extracted and purified from peripheral blood according to the manufacturer’s protocol by using a QIAamp tissue kit (Qiagen, Hilden, Germany). DNA concentration was determined by means of NanoDrop® (Thermo Scientific, Wilmington, DE) ND-1000 spectrophotometer, and samples were diluted to 10 ng/μL. SNP genotyping was carried out according to the TaqMan® genotyping protocol (StepOnePlusTM, Applied Biosystems, Foster City, CA) with 20-ng DNA template. For each analyzed SNP, existing and established TaqMan® genotyping assays were used. A positive control, previously verified by sequencing, was used for confirming homozygous genotypes. We used a 96-well plate. For overall quality assurance, 10% of analyzed samples were randomly selected, and analysis was performed in triplicate. Genotype concordance was ≥99%.
Clinical management, study group selection, and outcome assessment
Although this was a multicenter study, patients came from the same geographic area and clinical management was homogeneous. All patients with tumors ≥1 cm were treated with total thyroidectomy; those with tumors <1 cm (microcarcinomas) had near-total thyroidectomy. Lymphadenectomy was performed in the case of clinically involved lymph nodes with therapeutic intent (central and/or lateral dissection) and in patients who had pT3/pT4 tumor (lesions >4 cm and/or with extrathyroidal extension) without evident lymph node involvement with prophylactic intent (central compartment). Postsurgery radioiodine ablation was performed in all patients with the exception of those with unifocal microcarcinomas (pT1a according to the AJCC/UICC classification). Preparation and treatment procedures were in accordance with dedicated guidelines from the Society for Nuclear Medicine and Molecular Imaging and the European Association of Nuclear Medicine (19, 20).
After thyroid ablation, patients underwent thyroid-stimulating hormone suppressive therapy. During follow-up, patients were subjected to clinical (neck palpation), biochemical (basal/stimulated [Tg] and Tg antibodies [AbTg] levels), and instrumental (neck ultrasonography) examinations every 6 months. During follow-up, patients showing measurable basal or stimulated Tg, suspicious neck ultrasonography findings, or both were advised to have morphological or functional imaging, or both, including computed tomography or 18-fluorodeoxyglucose positron emission tomography. All ultrasonographically suspicious nodules ≥1 cm in diameter underwent fine-needle aspiration, and Tg in the aspirate was measured.
The study groups were selected after stratification based on the AJCC/UICC and the ATA systems, which provide different prognostic estimations: risk of disease-related death and persistent/recurrent disease, respectively (21). Therefore, analysis was performed on 2 partially overlapping cohorts extracted from the same source population. These include AJCC/UICC stage I–II, involving all patients age <45 years and those age ≥45 years with intrathyroidal tumors ≤4 cm in size and ATA low to intermediate risk, including patients without gross extrathyroidal extension (pT4a–b) and without metastatic disease.
Patients were considered to have achieved remission after thyroid ablation when the basal/stimulated Tg was <1 ng/mL, AbTgs were negative, neck US did not show suspicious finding, and other studies performed for clinically indicated reasons showed no pathologic findings. Patients achieving remission who developed new biochemical evidence of disease (measurable basal/stimulated Tg and/or increased AbTg) without any morphologic finding were considered to have biochemical recurrence, whereas those developing new structural evidence of disease (with or without biochemical alterations) were considered to have structural recurrence.
Because biochemical recurrence occurs in structural disease in only 20% of cases (22), this condition was not considered for the outcome analysis. Therefore, structural recurrence events were used for the assessment of disease-free survival (DFS), defined as the length of time between the achievement of disease remission after thyroid ablation (surgery with or without radioiodine treatment, as previously described) and the development of any morphologic evidence of disease or the last follow-up visit for disease-free patients. However, all patients showing biochemical relapse were subjected to a minimum follow-up of 18 months to exclude the progression from biochemical to structural disease. Therefore, the endpoints of the study were the rate of recurrent structural disease and, when survival analysis was performed, DFS.
MVD analysis
MVD was assessed by calculating the number of microvessels per X200 field. MVD was analyzed on 63 formalin-fixed, paraffin-embedded samples from our study population of patients with nonadvanced DTC. Tissue blocks were cut in 4-μm-thick sections and processed for immunohistochemistry. Antibodies against CD34 (clone QBEnd/10, Ventana Medical Systems, Tucson, AZ), which had been previously associated with outcome in DTC (23) and with VEGF-A levels in different tumor types (24), were used. Staining was performed by using the Ventana BenchMark XT automated immunostainer with the Ventana ultraView diaminobenzidine tetrahydrochloride kit for detection. As described by Weidner et al. (25), the 3 areas with the highest concentration of stained microvessels were selected by means of low magnification (×40). Vessel counting was then performed at high magnification (×200), and the average number from the selected areas was considered. Stained endothelial cells or endothelial cell clusters that were separated from adjacent vessels, tumor cells, or connective tissue elements were considered as single countable microvessels.
Statistical analysis
A χ2 test was applied for assessing Hardy-Weinberg equilibrium. Each SNP was analyzed as a 3-group categorical variable in accordance with the reference model (homozygous common variant vs heterozygous vs homozygous minor variant) and by grouping in accordance with the dominant (homozygous common variant vs heterozygous plus homozygous minor variant) and recessive (homozygous common variant plus heterozygous vs homozygous minor variant) models. In case of minor homozygous genotype frequency ≤10%, analyses were performed exclusively by means of dominant model. A χ2 test and analysis of variance t test were used for comparing categorical and continuous variables, respectively. Odds ratios (ORs) were calculated as described by Altman (26). Survival analyses for DFS were performed according to the Kaplan-Meier method, and the log-rank test was used to test for differences between groups. Estimates of allelic frequencies and haplotype analysis were performed by means of Haploview software (Broad Institute, Cambridge, MA). Accuracy of genotypes as prognostic markers was assessed according to the following formula: the positive predictive value (PPV) was true positive/(true positive + false positive) and the negative predictive value (NPV) was true negative/(false negative + true negative) (27). Binary logistic regression analysis was applied for adjusting genotypes with significant association with clinical outcome at univariate analysis for selected conventional clinicopathologic factors. The differences in MVD between tumors from patients with different genotype were determined by the Mann-Whitney U test. All tests were 2-sided, and P values <0.05 were used for considering an association of statistical significance.
Results
Study cohort
Overall, blood samples were obtained from 249 patients (46 men and 203 women) between October 2013 and October 2015. The overall population mainly included patients with nonadvanced DTC, with a smaller proportion of AJCC/UICC stage III/IV (18%) and ATA high-risk (3.6%) patients. Study groups consisted of 204 AJCC/UICC stage I–II and 240 ATA low to intermediate risk DTC patients. Mean duration of follow-up was 73 ± 64 months (mean, 6.1 years) and 70 ± 60 months (mean, 5.8 years), respectively. Baseline clinicopathologic features as well as clinical outcome of the overall population and each of the study groups are reported in Table 2.
Clinicopathologic and Prognostic Features of the Overall Population and Each Study Group
| Clinicopathologic Features | All (n = 249) | AJCC/UICC Stage I–II (n = 204) | ATA Low to Intermediate Risk (n = 240) |
|---|---|---|---|
| Median age at diagnosis, range (y) | 43 (15–74) | 40 (15–74) | 42 (15–74) |
| Age ≥ 45 y at diagnosis, n/n (%) | 111/249 (44.6) | 66/204 (32.4) | 104/240 (43.3) |
| Male/female patients, n/n (%/%) | 46/203 (18.5/81.5) | 37/167 (18.1/81.9) | 45/195 (18.7/81.3) |
| Patients with PTC/patients with FTC, n/n (%/%) | 225/24 (90.4/9.6) | 186/18 (91.2/8.8) | 218/22 (90.8/9.2) |
| Aggressive histologya n/n (%) | 41/231 (17.7) | 32/186 (17.2) | 38/222 (17.1) |
| Median primary tumor size (range) (cm) | 1.2 (0.4–8.5) | 1.2 (0.4–7) | 1.2 (0.4–8.5) |
| Multifocality, n/n (%) | 62/233 (26.6) | 45/190 (23.7) | 59/236 (25) |
| Extrathyroidal extension, n/n (%) | 63/225 (28) | 36/182 (19.8) | 56/217 (25.8) |
| Lymph node metastasis, n/n (%) | 68/224 (30.4) | 48/204 (23.5) | 63/240 (26.3) |
| Distant metastasis, n/n (%) | 6/249 (2.4) | 0/204 (0) | 0/240 (0) |
| AJCC/UICC stage I/II/III/IV, n/n/n (%/%/%) | 189/15/25/20 (75.9/6/10/8) | NA | NA |
| ATA group, low-intermediate/high, number, n/n (%/%) | 118/122/9 (47.4/49/3.6) | NA | NA |
| Recurrent biochemical disease, yes/no/uncertain, n/n/n (%/%/%) | 43/198/8 (17.3/79.5/3.2) | 32/166/6 (15.7/81.4/2.9) | 43/192/5 (17.9/80/2.1) |
| Recurrent structural disease, yes/no/uncertain, n/n/n (%/%/%) | 35/206/8 (14.1/82.7/3.2) | 26/172/6 (12.8/84.3/2.9) | 32/203/5 (13.3/84.6/2.1) |
| Site of recurrence, cervical lymph nodes/distant metastases, n/n (%/%) | 28/7 (80/20) | 23/3 (88.5/11.5) | 28/4 (87.5/12.5) |
Abbreviations: FTC, follicular thyroid cancer; NA, not applicable; PTC, papillary thyroid cancer.
Favorable histology includes classic, follicular, Warthin-like, and Hurtle-cell variants of papillary thyroid cancer; unfavorable histology includes tall-cell, diffuse sclerosing, and solid variants of papillary thyroid cancer and follicular thyroid cancer.
Genotype frequencies and association with clinicopathologic factors
SNPs were successfully genotyped in all patients. Allele frequencies (Supplemental Table 1) were consistent with those reported by the National Center for Biotechnology Information SNP database for the white population. Furthermore, they were highly similar to those detected in a cohort of healthy controls from the same geographic area (n = 178; data not shown). Genotype frequencies conformed to Hardy-Weinberg equilibrium for all SNPs (P > 0.05). Associations between genotypes and clinicopathologic factors were not evident.
Genotypes and association with clinical outcome
As reported in Table 2, clinical outcome was uncertain for 6 AJCC/UICC stage I–II patients and 5 ATA low- to intermediate-risk patients. Therefore, correlation analysis between genotypes and structural recurrence included 198 and 235 patients for the AJCC/UICC stage I–II and the ATA low- to intermediate-risk groups, respectively. Results are reported in Table 3. Minor homozygous genotypes of the VEGF-A SNPs −2578 C>A and −460 T>C (AA and CC, respectively) were significantly associated with reduced risk of recurrent structural disease in both stage I–II (OR, 0.08 [95% confidence interval (CI), 0.01 to 1.43; P = 0.018]; OR, 0.08 [95% CI, 0 to 1.37; P = 0.016]) and ATA low- to intermediate-risk (OR, 0.14 [95% CI, 0.01 to 1.13; P = 0.035]; OR, 0.14 [95% CI, 0.01 to 1.09; P = 0.031], respectively) patients.
Relationship between VEGF Pathway Polymorphisms and Recurrent Structural Disease in AJCC/UICC Stage I–II and ATA Low- to Intermediate-Risk DTC Patients
| Variable | AJCC/UICC Stage I–II | ATA Low to Intermediate Risk | ||||||
|---|---|---|---|---|---|---|---|---|
| Recurrence, n (%) | No Recurrence, n (%) | OR (95% CI) | P Value | Recurrence, n (%) | No Recurrence, n (%) | OR (95% CI) | P Value | |
| VEGF-A rs699947 | ||||||||
| CC | 11 ( 14.3) | 65 (84.4) | 1 (reference) | 0.058 | 14 (15.6) | 75 (83.3) | 1 (reference) | 0.108 |
| CA | 15 (16.1) | 76 (81.7) | 1.16 (0.55–2.71) | 17 (15.3) | 92 (82.9) | 0.98 (0.45–2.13) | ||
| AA | 0 (0) | 31 (91.2) | 0.09 (0.01–1.58) | 1 (2.6) | 36 (92.3) | 0.14 (0.01–1.17) | ||
| Dominant model (CCa vs CA+AA) | 0.82 (0.35–1.91) | 0.659 | 0.75 (0.35–1.6) | 0.461 | ||||
| Recessive model (CC+CAa vs AA) | 0.08 (0.01-1.43) | 0.018 | 0.14 (0.01-1.13) | 0.035 | ||||
| VEGF-A rs833061 | ||||||||
| TT | 11 (14.5) | 64 (84.2) | 1 (reference) | 0.053 | 14 (15.7) | 74 (83.1) | 1 (reference) | 0.098 |
| TC | 15 (16.1) | 76 (81.7) | 1.14 (0.49–2–67) | 17 (15.3) | 92 (82.9) | 0.97 (0.45–2.11) | ||
| CC | 0 (0) | 32 (91.4) | 0.09 (0–1.51) | 1 (2.5) | 37 (92.5) | 0.14 (0.01–1.12) | ||
| Dominant model (TTa vs TC+CC) | 0.8 (0.34–1.86) | 0.617 | 0.73 (0.34–1.56) | 0.428 | ||||
| Recessive model (TT+TCa vs, CC) | 0.08 (0–1.37) | 0.016 | 0.14 (0.01–1.09) | 0.031 | ||||
| VEGF-A rs2010963 | ||||||||
| GG | 7 (10.4) | 56 (83.6) | 1 (reference) | 0.417 | 7 (8.7) | 70 (87.5) | 1 (reference) | 0.170 |
| GC | 16 (15.8) | 83 (82.2) | 1.54 (0.59–3.99) | 21 (17.5) | 97 (80.8) | 2.16 (0.87–5.37) | ||
| CC | 3 (8.3) | 33 (91.7) | 0.72 (0.17–3) | 4 (10) | 36 (90) | 1.11 (0.3–4.04) | ||
| Dominant model (GGa vs GC+CC) | 1.31 (0.52–3.29) | 0.565 | 1.87 (0.77–4.56) | 0.158 | ||||
| Recessive model (GG+GCa vs CC) | 0.54 (0.15–1.93) | 0.346 | 0.66 (0.21–2) | 0.464 | ||||
| VEGF-A rs3025039b | ||||||||
| CC | 19 (12.1) | 133 (84.7) | 1 (reference) | 0.633 | 25 (13.6) | 155 (84.2) | 1 (reference) | 0.826 |
| CT+TT | 7 (14.9) | 39 (83) | 1.25 (0.49–3.20) | 7 (12.5) | 48 (85.7) | 0.9 (0.36–2.22) | ||
| VEGF-R2 rs2305948b | ||||||||
| CC | 19 (11.7) | 139 (85.3) | 1 (reference) | 0.36 | 24 (12.8) | 160 (85.1) | 1 (reference) | 0.626 |
| CT+TT | 7 (17.1) | 33 (80.5) | 1.55 (0.6–3.99) | 8 (15.4) | 43 (82.7) | 1.24 (0.52–2.95) | ||
| VEGF-R2 rs1870377b | ||||||||
| TT | 13 (10.6) | 107 (87) | 1 (reference) | 0.235 | 17 (11.6) | 127 (87) | 1 (reference) | 0.308 |
| TA+AA | 13 (16) | 65 (80.2) | 1.64 (0.71–3.76) | 15 (16) | 76 (80.9) | 1.47 (0.69–3.12) | ||
Subgroup considered as reference for the assessment of the OR.
Polymorphisms analyzed exclusively by means of dominant model because of a minor homozygous genotype frequency ≤10%. Boldface indicates significant P values.
Haplotype analysis
On the basis of genotype analysis, haplotype analysis was focalized on VEGF-A SNPs. Three common haplotypes with frequency >10% were defined, including −2578C, −460T, +405C (named CTC); −2578A, −460C, +405G (named ACG); and −2578C, −460T, +405G (named CTG) (linkage disequilibrium between VEGF-A SNPs are reported in Supplemental Table 2). Haplotypes frequencies were similar in stage I–II and ATA low- to intermediate-risk patients (CTC, 41.6 and 40.9% , respectively; ACG, 39.3 and 39.4%, respectively; CTG, 18.3 and 19.5%, respectively) and were also consistent with those reported for other white populations (28). The ACG haplotype conferred protection in both stage I–II (OR, 0.22; 95% CI, 0.11 to 0.46; P = 0.05) and ATA low- to intermediate-risk (OR, 0.51; 95% CI, 0.27 to 0.97; P = 0.005) patients. By contrast, the CTG haplotype conferred risk for structural recurrence in both stage I–II (OR, 2.6; 95% CI, 1.31 to 5.17; P = 0.036) and ATA low- to intermediate-risk (OR, 1.93; 95% CI, 1.02 to 3.67; P = 0.039) patients.
Combined genotypes and association with clinical outcome
Haploview determines the likelihood of the individual haplotypic phase and cannot provide markers useful for clinical practice. Therefore, we decided to test the prognostic effect of the combination of ACG and CTG haplotypes in a recessive model. As expected, the ACG homozygous genotype (ACG+/+) offered a protective effect against structural recurrence in both stage I–II (OR, 0.08; 95% CI, 0.01 to 1.43; P = 0.018) and ATA low- to intermediate-risk (OR, 0.14; 95% CI, 0.01 to 1.13) patients. By contrast, the CTG homozygous genotype (CTG+/+) was significantly associated with a higher rate of structural recurrence in stage I–II (OR, 5.47; 95% CI, 1.15 to 26.04) patients and was also slightly deleterious in ATA low- to intermediate-risk patients (OR, 3.39; 95% CI, 0.8 to 14.33; P = 0.079). Survival analysis further confirmed this result, showing that the ACG+/+ and the CTG+/+ genotypes were associated with higher and lower DFS, respectively (even if the CTG+/+ did not achieve statistically significant prognostic value in ATA low- to intermediate-risk patients) (Fig. 1). The absence of a statistically significant prognostic power for CTG+/+ genotype in the ATA low- to intermediate-risk group was attributable to the small number of patients carrying the genotype (9 of 235), but the trend of association with worse prognosis was clear.
![Kaplan-Meier analysis of disease-free survival according to ACG+/+ and CTG+/+ genotypes. Analysis was performed on stage I–II [ACG+/+ (A) and CTG+/+ (B)] and ATA low- to intermediate-risk [ACG+/+ (C) and CTG+/+ (D)] DTC patients.](https://oup.silverchair-cdn.com/oup/backfile/Content_public/Journal/jcem/102/2/10.1210_jc.2016-2555/2/m_jc.2016-2555f1.jpeg?Expires=1747872154&Signature=dKfBPJk-maBg455NkTe76a0EM7ahp1uf68jijmOlg7xClOxZ20SG4YbLt85ZR7AZXn89rGvqExPpE2vV1g5-tbe~rV9W8xMvH98QCW9zgNU39AIY~qAyubscnhiE5BvRFiok2zkXNiViXMEkEIFx-uSYZ63tKWbOpcmUlIOU3x0EAWAlwo76XxuLNfNNqTpro1ex6vjAsmldZNIgLuJBC4LrAvsPtSQ0DseiA129oglFSbrrGww868wm1LsM8p4OJtWakVibks4gMPcVIhM4ySol8SliGoHufSLQMycXQe6Z1rV-anNnXJCUMpeBqgD7WPqp80ul4zdOpS2OuIvTdQ__&Key-Pair-Id=APKAIE5G5CRDK6RD3PGA)
Kaplan-Meier analysis of disease-free survival according to ACG+/+ and CTG+/+ genotypes. Analysis was performed on stage I–II [ACG+/+ (A) and CTG+/+ (B)] and ATA low- to intermediate-risk [ACG+/+ (C) and CTG+/+ (D)] DTC patients.
PPV and NPV of ACG+/+ and CTG+/+ genotypes for disease recurrence
The 2 genotypes showed remarkable NPVs in both subgroups. Particularly, the NPVs of ACG+/+ were 84.4% (95% CI, 78.03% to 89.57%) and 84.3% (95% CI, 78.52% to 89.11%) in stage I–II and ATA low- to intermediate-risk patients, respectively; the NPVs of CTG+/+ were 87.9% (95% CI, 82.48% to 92.21%) and 87.2% (95% CI, 82.09% to 91.24%), respectively. The PPVs of the ACG+/+ genotype were null for stage I–II patients (0%; 95% CI, 0 to 11.22%) and very low for low- to intermediate-risk patients (2.7%; 95% CI, 0.07% to 14.16%). In contrast, the CTG+/+ genotype showed acceptable PPVs: 42.8% (95% CI, 9.9% to 81.59%) in stage I–II patients and 33.3% (95% CI, 7.40% to 70.07%) in low- to intermediate-risk patients.
Multivariate models in ATA low- to intermediate-risk patients
Because the ATA classification can predict persistent/recurrent disease, which is the primary endpoint of this study, we assessed the independent prognostic effect of ACG+/+ genotype, the only genotype demonstrating a statistically significant association with recurrent structural disease, by using 3 multivariate models: Model 1 adjusted for tumor size and multifocality, considered prognostic factors in low-risk disease; model 2 adjusted for extrathyroidal extension and lymph node metastasis, considered prognostic factors in intermediate-risk disease; and model 3 adjusted for age at diagnosis, which is a very critical factor for prognosis with possible effect on angiogenesis efficiency. As reported in Table 4, the ACG+/+ genotype retained its protective effect only when adjusted for tumor size and multifocality (OR, 0.12; 95% CI, 0.01 to 0.98; P = 0.048), whereas prognostic significance was lost after adjustment for extrathyroidal extension and lymph node metastasis (OR, 0.31; 95% CI, 0.03 to 2.69), as well as age at diagnosis (OR, 0.15; 95% CI, 0.02 to 1.14; P = 0.068).
Multivariate Models Including the ACG+/+ Genotype and Conventional Clinicopathologic Features of DTC
| ATA Low to Intermediate Risk | Unadjusted Univariate Model | Adjusted Multivariate Model 1 | Adjusted Multivariate Model 2 | Adjusted Multivariate Model 3 | ||||||
|---|---|---|---|---|---|---|---|---|---|---|
| Recurrence, n (%) | No Recurrence, n (%) | OR (95% CI) | P Value | Adjusted OR (95% CI) | Adjusted P Value | Adjusted OR (95% CI) | Adjusted P Value | Adjusted OR (95% CI) | Adjusted P Value | |
| VEGF-A genotype | ||||||||||
| AC G+/+ | 1 (2.7) | 36 (97.3) | 0.15 (0.02–1.13) | 0.035 | 0.12 (0.01–0.98) | 0.048 | 0.31 (0.03–2.69) | 0.293 | 0.15 (0.02–1.14) | 0.068 |
| Other genotypes | 31 (15.7) | 167 (84.3) | 1 (reference) | 1 (reference) | 1 (reference) | 1 (reference) | ||||
| Sex | ||||||||||
| Male | 7 (15.9) | 36 (81.8) | 1.29 (0.52–3.23) | 0.573 | ||||||
| Female | 25 (12.9) | 167 (86.1) | 1 (reference) | |||||||
| Age at diagnosis | ||||||||||
| <45 y | 20 (14.7) | 113 (83.1) | 1 (reference) | 0.617 | 1 (reference) | 0.572 | ||||
| ≥45 y | 12 (12.9) | 89 (85.6) | 0.76 (0.35–1.64) | 0.8 (0.36–1.73) | ||||||
| Histologya | ||||||||||
| Favorable | 19 (10.3) | 162 (88) | 1 (reference) | 0.052 | ||||||
| Unfavorable | 8 (21.1) | 28 (73.7) | 2.43 (0.97–6.1) | |||||||
| Tumor sizeb | ||||||||||
| Microcarcinoma | 3 (3.3) | 86 (95.6) | 0.14 (0.04–0.47) | <0.0001 | 0.18 (0.05–0.64) | 0.008 | ||||
| Macrocarcinoma | 29 (10.3) | 117 (78) | 1 (reference) | 1 (reference) | ||||||
| Multifocality | ||||||||||
| Yes | 13 (22) | 44 (74.6) | 3.74 (1.59–8.78) | 0.001 | 3.9 (1.59–9.57) | 0.003 | ||||
| No | 12 (7.2) | 152 (91) | 1 (reference) | 1 (reference) | ||||||
| Extrathyroidal extension | ||||||||||
| Yes | 12 (21.4) | 43 (76.8) | 3.7 (1.52–8.98) | 0.002 | 2.18 (0.74–6.37) | 0.153 | ||||
| No | 11 (6.8) | 146 (90.7) | 1 (reference) | 1 (reference) | ||||||
| LN metastasisc | ||||||||||
| N1 | 14 (22.2) | 48 (76.2) | 3.61 (1.21–10.74) | 2.68 (0.85–8.45) | 0.092 | |||||
| N0 | 5 (7.5) | 62 (92.5) | 1 (reference) | 0.015 | 1 (reference) | |||||
Model 1: ACG+/+ genotype adjusted for tumor size and multifocality. Model 2: ACG+/+ genotype adjusted for extrathyroidal extension and LN metastasis. Model 3: ACG+/+ genotype adjusted for age at diagnosis.
Abbreviation: LN, lymph node.
Favorable histology includes classic, follicular, Warthin-like, and Hurtle-cells variants of papillary thyroid cancer; unfavorable histology includes tall-cell, diffuse sclerosing, and solid variants of papillary thyroid cancer and follicular thyroid cancer.
Categorization as microcarcinoma and macrocarcinoma was used for the analysis.
Patients not subjected to cervical lymphadenectomy (Nx) have been excluded from the analysis. Boldface indicates significant P values.
MVD analysis
Of 63 patients with available tissue blocks, 31 carried the CTC+/+ genotype, 30 the ACG+/+, and 2 the CTG+/+. Therefore, statistical analysis of differential MVD between the protective ACG+/+ and the deleterious CTG+/+ genotype was not feasible. Nevertheless, we show in Figure 2(A) the anecdotal comparison between 2 patients carrying the ACG+/+ and the CTG+/+ genotype, clearly showing higher MVD in the latter. Furthermore, comparison between the ACG+/+ and other genotypes was performed. As shown in Figure 2(B), MVD detected in primary tumors from patients with ACG+/+ was significantly lower than that in tumors from patients carrying other genotypes (median MVD, 76.5 ± 12.7 and 86.7 ± 27.9, respectively; P = 0.024).
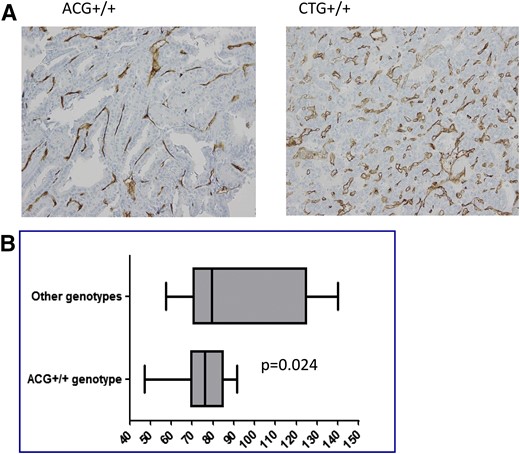
(A) Anecdotal comparison of primary tumor MVD, as estimated by CD34, between 2 DTC patients carrying the ACG+/+ and the CTG+/+ genotypes. High magnification, ×200. (B) Comparison of MVD, as estimated by CD34, in primary tumors from DTC patients carrying the ACG+/+ vs other genotypes. Analysis performed by means of the Mann-Whitney U test. Median, ranges, and confidence intervals are reported for each group.
Discussion
Despite the large number of studies assessing the relationship between germline SNPs of the VEGF system and phenotype of different forms of cancer (29), data on the association with DTC are poor. To date, only 1 case-control study, involving a set of VEGF-A SNPs, has provided some insights into the correlation between genetic variation of the VEGF pathway and clinicopathologic features of DTC. Nevertheless, results were inconclusive because statistically significant findings were evident only in men (30).
This study evaluated a relationship between germline polymorphisms of the VEGF-pathway and clinical outcome of DTC. Given that studies on other cancer types have demonstrated that the prognostic value of SNPs of the VEGF-system was stage dependent (13) and that the biological role of VEGF-A in tumor angiogenesis seems to be overcome by other angiogenic factors in late stages (31), we decided to focus on patients with nonadvanced disease to perform a more proper analysis. Nevertheless, current risk stratification of DTC is not univocal and this hampers the distinction between “early” and “advanced” disease. Indeed, the AJCC/UICC system, representing the mainstay of DTC staging, has been shown to predict mortality but not persistent/recurrent disease; this led to the development of alternative prognostic systems specifically assessing the risk of persistence/recurrence, including the ATA (21). Therefore, we chose to provide readers a double picture of nonadvanced DTC by stratifying the source population according to both the AJCC/UICC and the ATA systems. By doing so we aimed to reinforce possible significant results derived from our analysis.
On the basis of single SNPs and haplotypes analysis, we constructed “risk” genotypes by combining VEGF-A SNPs −2578 C>A, −460 T>C, and +405 G>C, which were in linkage disequilibrium, according to a recessive model. In particular, ACG+/+ and CTG+/+ genotypes were predictive of structural recidivism, with the former being protective and the latter deleterious. To provide more exhaustive information about prognostic effect of the identified markers, we performed multivariate regression analysis on the subgroup of ATA low to intermediate risk by adjusting the ACG+/+ genotype, the only one that achieved statistical significance, according to 3 different models (described previously). Notably, the protective effect shown in univariate analysis was retained after adjustment for tumor size and multifocality but was no longer significant when extrathyroidal extension and lymph node metastasis were used as covariates. This suggests that angiogenesis may have a relevant biological role, thus affecting DTC evolution and prognosis in the early phase, when the tumor is still confined to the thyroid. Unfortunately, given the large sample size required for SNP association studies (32), it was not feasible to confirm this hypothesis by a separate analysis of ATA low-intermediate-risk patients. Of note, prognostic significance was also lost after adjustment for age at diagnosis, which may be explained by the fact that tumor angiogenesis is an age-dependent process (33).
To determine consistency between prognostic effect of VEGF-A genetic variation and angiogenic process, we compared MVD between primary tumors from patients with different genotypes. We demonstrated that tumors from patients carrying the protective ACG+/+ genotype were less vascularized than those from patients with other genotypes, thus providing biological linkage between prognostic effect and angiogenic activity.
Analysis of marker accuracy revealed considerable NPV for both genotypes, whereas only CTG+/+ demonstrated acceptable PPV. Of note, PPVs displayed by CTG+/+ in both cohorts (42.8% and 33.3% for AJCC/UICC stage I–II and ATA low to intermediate risk, respectively) were higher than those reported for BRAFV600E (25%) in the largest meta-analysis available to date (18). Therefore, the CTG+/+ genotype may represent a powerful molecular tool for identifying nonadvanced DTC patients who will develop structural recurrence, and it may significantly improve the current prognostic approach, which is limited by the low specificity. Unfortunately, conclusive information about the actual biological relevance, and therefore prognostic effect, of VEGF-A SNPs −2578 C>A, −460 T>C, and +405 G>C could not be obtained in our study, which is based on a SNP-candidate approach. In particular, gene-throughput association studies are needed to exclude the possibility other SNPs or genetic markers, in linkage disequilibrium with those reported in the present analysis, may be associated with prognosis, and in vitro and in vivo studies are required to confirm differential biological effects for each polymorphic variant.
Nevertheless, some speculations can be proposed. Given that the SNP +405 G>C provides its common G allele to both the protective and the deleterious genotype, a relevant biological role should be excluded for it. Consistent with the protective effect shown in our analysis, the AA genotype of −2578 C>A has been associated with decreased production of VEGF-A in an in vitro model of peripheral blood mononuclear cells, implying that it determines reduced gene expression (34). Although preclinical data on functional implications related to the −460 T>C SNP are not available, lowered serum VEGF-A levels have been reported for patients with colorectal cancer who carry the common T allele (35); this was not consistent with our results, in which the allele was part of the deleterious genotype.
On the basis of these data, SNP −2578 C>A seems to be the most feasible candidate to play an actual biological role in DTC-related angiogenesis, thus affecting prognosis. Furthermore, elimination and creation of transcription-factor binding sites related to this SNP have been carefully described (36), thus allowing further biological insights. In particular, the AA genotype is associated with the loss of any binding site for the dimer hypoxia-inducible factor-1 (HIF-1)α/β, which represents the main mediator of hypoxia-induced VEGF-A production (37). This produces a dramatic change as VEGF-A expression, the main regulator of the angiogenic process, becomes independent from HIF-1–mediated hypoxia. Notably, HIF1-α overexpression has been associated with molecular and morphologic changes leading to disease progression (such as the epithelial-mesenchymal transition) and to aggressive pathologic features (including advanced stage and lymph node metastases) in DTC, and this suggests a relevant role for HIF-1–mediated hypoxia in disease progression of such tumor types (38, 39). This is consistent with the protective role demonstrated for the AA genotype, wherein VEGF-A expression, and therefore angiogenesis, related to HIF-1–mediated hypoxia is hampered by the absence of binding sites within the promoter.
In conclusion, our analysis led to the identification of stable and easily accessible prognostic markers in nonadvanced DTC. Given that molecular prognostication of DTC is predominantly based on tissue markers, the identification of nontissue prognosticator is crucial because accessibility of tumor samples is not always possible. Furthermore, a different mutational status may occur in metastatic sites as compared with the primary tumor, thus hampering tissue-based molecular characterization. Although this is a pivotal study and further validation is required by means of a larger series, analysis of germline VEGF-A SNPs represents a promising tool for empowering prognostic stratification of DTC.
Abbreviations:
- AbTg
thyroglobulin antibodies
- AJCC
American Joint Committee on Cancer
- ATA
American Thyroid Association
- CI
confidence interval
- DFS
disease-free survival
- DTC
differentiated thyroid cancer
- MVD
microvessel density
- NPV
negative predictive value
- OR
odds ratio
- PPV
positive predictive value
- SNP
single nucleotide polymorphism
- Tg
thyroglobulin
- UICC
Union for International Cancer Control
- VEGF
vascular endothelial growth factor
- VEGFR
vascular endothelial growth factor receptor
Acknowledgments
I thank Professor Massimo Santoro for his help. We also acknowledge the Umberto Veronesi Foundation for granting V.M. with a postdoctoral Fellowship award for 2017.
Disclosure Summary: The authors have nothing to disclose.
References
Author notes
Address all correspondence and requests for reprints to: Vincenzo Marotta, MD, PhD, IOS & COLEMAN Srl, Centro Direzionale, isola E/3 80143, Naples, Italy. Email: [email protected].
