


Abstract
Graves disease (GD) is a common autoimmune disease triggered by genetic predisposition and environmental factors. However, the mechanisms of interaction between genetic and environmental factors contributing to the development of GD remain unknown.
We aimed to identify GD susceptibility variants and genes on Xq21.1 locus and interpret the contribution of interaction between genetic predisposition on Xq21.1 and environmental factors to GD.
We performed refining study on Xq21.1 in a 2-stage study and carried out expression quantitative trait locus analysis of the best association signal with GD.
A total of 4316 GD patients and 4374 sex-matched controls were collected from the Chinese Han population by cooperation with multiple hospitals.
We identified that rs3827440 or its linkage single nucleotide polymorphisms (SNPs) were probably the causal variant in the Xq21.1 locus, with the most substantial association with GD in our combined cohorts (P = 2.45 × 10⁻¹⁵). The genotypes of rs3827440 were correlated with the expression of ITM2A in monocytes and peripheral blood mononuclear cells (PBMCs) from healthy volunteers. Notably, the expression of ITM2A in monocytes after lipopolysaccharide (LPS) and interferon-γ (INF-γ) stimulation showed substantial difference among the volunteers that carried different genotypes of rs3827440 (P = 9.40 × 10⁻⁷ and P = 1.26 × 10⁻⁵ for 24 hours’ LPS and INF-γ stimulation, respectively). Moreover, ITM2A expression was significantly decreased in PBMCs from untreated GD patients than that from controls.
The results suggest that ITM2A might be a susceptibility gene for GD in the Xq21.1 locus, and environmental factors, such as viral and bacterial infections, probably contribute to GD pathogenesis by interacting with the risk SNP rs3827440 mediating the regulation of ITM2A expression.
Graves disease (GD) is a common and complex autoimmune disease caused by interaction of genetic factors and environmental triggers (1). The prevalence of GD in the Chinese Han population is approximately 0.25% to 1.0% with a strong female preponderance, consistent with that of many other autoimmune diseases (2,3). However, the reason that GD is more prevalent among women is unknown. A reasonable explanation is that genes located on the X-chromosome may be contributed to the development of GD. Studies have reported that the Xp11 region is associated with autoimmune thyroid disease in the United Kingdom population and that transcription levels of the forkhead box P3 gene (FOXP3) in Xp11 are associated with susceptibility to autoimmune thyroid disease in the Caucasians but not in the Japanese and Chinese Han populations (4–6).
In our previous genome-wide association study (GWAS), we confirmed 4 GD-associated loci previously reported and identified 2 susceptibility loci in the Chinese Han population (7). Another extension of this study identified 5 GD risk loci (8). In the extension study, rs5912838, located between the immune receptor G protein–coupled receptor 174 gene (GPR174) and integral membrane protein 2A gene (ITM2A), was identified as an important association signal on Xq21.1 in the Chinese Han population. ITM2A, but not GPR174, escaping X-chromosome inactivation, was arbitrarily considered a susceptibility gene for GD (8). Moreover, rs3827440, a nonsynonymous single nucleotide polymorphism (SNP) in GPR174 highly linked with rs5912838 on Xq21.1, has been identified associated with GD in 2 independent studies. One was performed in a Caucasian population and the other was in another group of the Chinese Han population (9,10); moreover, rs3827440 was also found to be associated with autoimmune Addison disease in a UK cohort (11). Therefore, the Xq21.1 region was considered a susceptibility locus to GD, but the susceptibility of SNPs or genes in this region is controversial.
Infections by Yersinia enterocolitica (YE), hepatitis C virus (HCV), and Epstein-Barr virus (EBV) have been frequently cited as major environmental triggers of GD (12–16). However, many of the individuals infected by YE, HCV, or EBV were not suffering from GD; this may be explained by their interaction with different genetic predispositions. Although the interaction between genetic predisposition and environmental factors contributed to the pathogenesis of GD, the evidence supporting the hypothesis was scarce.
Most recently, Fairfax et al. investigated correlation of SNP genotypes in the whole genome with the levels of gene transcription in monocytes recruited from 432 healthy Europeans under lipopolysaccharide (LPS), interferon-γ (IFN-γ) stimulation, or naïve state (17). They found many gene expressions and their responses to LPS or IFN-γ stimulation showed substantial difference among subjects carrying different SNP genotypes (cis-expression quantitative trait locus [cis-eQTL] genes) (17). The identification of functional regulatory variants and associated modulated genes is key to interpreting GWAS findings and establishing how genes are associated with disease (18). The levels of LPS and IFN-γ are increased in humans when infected by bacteria or viruses; therefore, those findings by Fairfax et al. laid the foundation for our investigation into the role of interaction between genetic and environmental factors, such as infections, in the pathogenesis of GD.
In the current study, we performed refining study on Xq21.1 in a large-scale sample of cohorts including 4316 GD patients and 4374 controls and identified rs3827440 (PCombined = 2.45 × 10⁻¹⁵) was the best SNP associated with GD on Xq21.1. Interestingly, the levels of ITM2A expression in monocytes after either LPS or IFN-γ stimulation showed substantial difference among the individuals who carried distinct genotypes of rs3827440. Moreover, the transcription levels of ITM2A in peripheral blood mononuclear cells (PBMCs) were down-regulated in untreated GD patients when compared with those of controls. These findings suggest that environmental triggers, such as infection, indicated by LPS or IFN-γ stimulation, probably contribute to the development of GD by interacting with risk variant rs3827440, mediating the regulation of ITM2A expression.
Materials and Methods
Subjects and sample collection
All subjects in the current study were from the Chinese Han population by cooperation with multiple hospitals in China (19). This program was approved by the local institutional review board. As previously reported, 1536 patients with GD and 1516 sex-matched controls were recruited in the initial GWAS stage (7). Next, an additional 2874 GD patients and 2906 sex-matched controls were collected for the replication study. Diagnosis of GD was based on the principles previously reported (7). Genomic DNA of all subjects was extracted from peripheral blood leukocytes by using FUJIFILM QuickGene-610 system (Kurabo Biomedical, Tokyo, Japan).
Genotyping and quality control
GWAS was performed by Illumina Human660-Quad Bead Chips in the Chinese National Human Genome Center (Shanghai, China). We then obtained the imputed SNPs by performing imputation analysis on IMPUTE2 based on the 1000 Genomes Project (June 2011) (20). All of the genotyped and imputed SNPs were filtered by stringent quality control. SNPs with a Hardy-Weinberg equilibrium P > 1 × 10⁻⁶ and missing call rates ≤0.05 and minor allele frequency > 0.01 were included, and the SNPs with sex inconsistencies and cryptic relatedness were excluded (8). In the replication stage, SNP genotyping was performed by TaqMan SNP Genotyping Assay on ABI Vii Real-Time polymerase chain reaction (PCR) system.
SNP selection and sample size calculation
According to the results in the GWAS stage, we defined the chromosomal region by HapMap recombination rates, GWAS data, and linkage disequilibrium information (21). Then we found 272 SNPs with PGWAS ≤ 1 × 10⁻⁴ (Supplemental Table 1). By using Haploview, these 272 SNPs could be captured by 9 tag SNPs with r2 > 0.8; tag SNPs were genotyped in the second replication stage. To detect the genome-wide substantial difference of the genotyped SNPs at 80% power, the sample size in the replication stage was calculated by QUANTO (version 1.2.4). In the current study, we therefore included 4316 GD patients and 4374 controls in the combined stage.
The correlation analysis of eSNPs for ITM2A and GD-associated SNPs
eQTL analysis was performed in the eQTL gene database established by Fairfax et al. (17). In brief, they detected the genotype of 609,704 SNPs and transcriptome data in 432 healthy Europeans. The monocytes were separated from PBMCs by magnetic-activated cell sorting (Miltenyi). Monocytes separated from 432 individuals were treated by 20 ng/ml INF-γ or 20 ng/ml LPS for 24 hours, respectively. After quality control, the data from 367 samples stimulated by 20 ng/ml INF-γ and 322 individuals treated with 20 ng/ml LPS were further analyzed in the study by Fairfax et al. Moreover, monocytes from 261 individuals were stimulated by 20 ng/mL LPS for 2 hours (17). Data across all 4 conditions were available from 228 individuals, permitting cross-treatment comparison (17). By searching the cis-eQTL database, we investigated the expression SNPs (eSNPs) for P2RY10, GPR174, and ITM2A in the GD susceptibility locus Xq21.1. Furthermore, the association of these eSNPs with Graves disease was analyzed based on our GWAS data.
PBMCs and real-time PCR
Blood samples (100 mL) were donated by 191 healthy Chinese Han volunteers and 56 untreated GD patients for gene expression analysis. The blood samples of 56 GD patients were collected when these patients were first diagnosed with GD and did not receive any treatment before. PBMCs were collected by using Ficoll according to the manufacturer’s instructions. The rs3827440 and rs5912838 genotypes among the 191 healthy volunteers were determined by TaqMan SNP Genotyping Assay on an ABI Vii Real-Time PCR system. Expression of the target genes in PBMCs was determined by quantitative real-time PCR. The relative expressions of genes of interest were calculated by the comparative cycle threshold (CT) method, and GAPDH was used as an internal reference. The ΔCT values for AA and CC of each individual were calculated by doubling the ΔCT values obtained for AA or CC. The ΔCT value for AC was regarded as AA or CC, and each ΔCT value was determined by the ΔCT value obtained for AA or CC average plus the AC actual ΔCT value. We used the same primer sequences for ITM2A and GPR174 as previously reported (8).
Statistical analysis
SNPs in chromosome X in the GWAS stage were analyzed by using logistic regression in PLINK and adding sex as a covariate (22). In the replication and combined cohorts, tag SNPs were also analyzed by logistic regression analysis. Forward and 2-locus logistic regression analyses were performed to determine the independent effect and main effect of an individual SNP by combining the R software package and PLINK (23). Genome-wide P value plot was determined by the R package, and the regional plots were generated by SNAP version 2.2 software and modified by the R software package.
Results
Refining association study in the Xq21.1 region for GD in the Chinese Han Population
In our previous study, 1536 GD cases and 1516 sex-matched controls were genotyped at 657,366 SNPs using Illumina Human660-Quad BeadChips at the GWAS stage (8,9). After stringent quality control, 486,049 SNPs in 1442 GD cases and 1468 sex-matched controls were analyzed (8,9) (Table 1). In the initial GWAS stage, rs5912838 (PGWAS = 4.15 × 10⁻⁸; odds ratio [OR], 1.37; 95% confidence interval [CI], 1.22 to 1.53) on GPR174-ITM2A at Xq21.1 exhibited the most important difference in our genotyped SNPs (8). An approximate 990-kb region on Xq21.1 covering rs5912838 was separated by 2 recombination hotspots (the recombination rate of the right hotspot was >40%; the rate of the left hotspot was about 20%), and this region included 3 annotated genes: P2RY10, GPR174, and ITM2A [Fig. 1(A)]. Using our previous GWAS data, we analyzed the genotyped and imputed SNPs on Xq21.1 by logistic regression analysis. Fourteen genotyped SNPs and 258 imputed SNPs with PGWAS ≤1 × 10⁻⁴ were identified in this linkage disequilibrium block (Supplemental Table 1).
Sample Set Descriptions
| Genotyping Stage | Disease State | No. | Sex Ratio (M/F) | Age |
|---|---|---|---|---|
| GWAS | GD | 1442 | 335/1107 | 39 ± 14 |
| Control | 1468 | 359/1109 | 45 ± 9 | |
| Replication | GD | 2874 | 379/2495 | 40 ± 14 |
| Control | 2906 | 555/2351 | 46 ± 15 | |
| Combined | GD | 4316 | 714/3602 | 39 ± 14 |
| Control | 4374 | 914/3460 | 45 ± 13 |
Abbreviations: F, female; M, male.
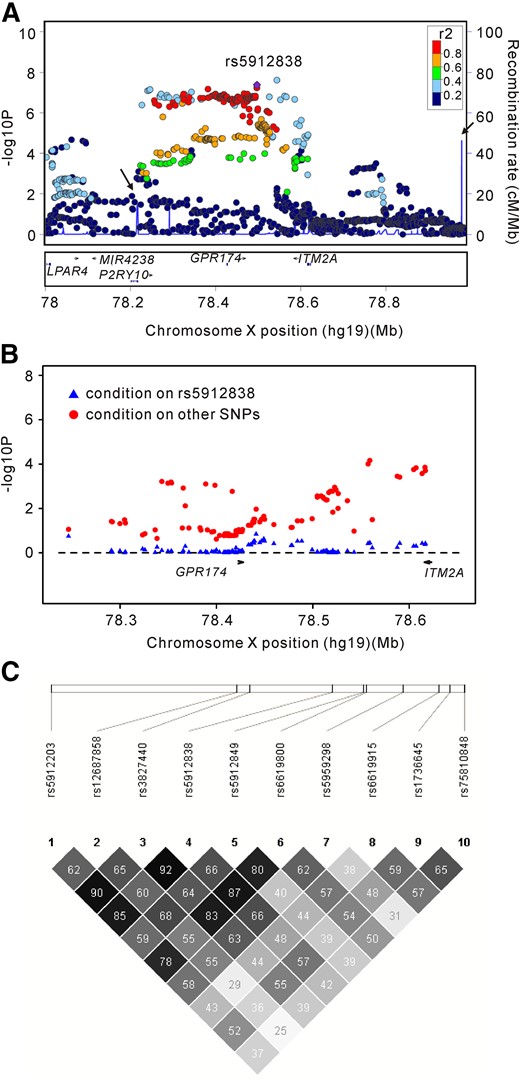
Regional plots of association results, logistic regression analysis, and linkage disequilibrium block analysis. (A) The GD-associated SNPs in the Xq21.1 region in the GWAS stage. The color of each SNP dot reflects its r2 value, with the top genotyped SNP, rs5912838, represented by the purple dot. (B) Two-locus logistic regression for rs5912838 on Xq21.1 in the GWAS stage. P values of the other SNPs on Xq21.1 after conditioning on rs5912838 are represented by blue triangles. P values of rs5912838 after conditioning on the other SNPs are represented by red dots. (C) Linkage disequilibrium block analysis for the 10 selected SNPs. Values shown are the r2 values between 2 SNPs.
Our previous study demonstrated that rs5912838, located approximately in the 350-kb region on Xq21.1, was the signal most strongly associated with GD. In the current study, rs5912838 was again the signal most significantly associated with GD among the 272 SNPs evaluated by 2-locus conditional logistic regression analysis [Fig. 1(B)]. In addition, rs1751107 (PGWAS = 2.28 × 10⁻⁶; OR, 1.31; PForward, 0.0078) was indicated an independent signal associated with GD by forward logistic regression analysis.
To further refine the causal SNPs associated with GD on Xq21.1, we selected 9 tagSNPs, which were able to capture the 272 SNPs with PGWAS ≤ 1 × 10⁻⁴ in this locus (r2 > 0.8), for genotyping in the replication stage in a cohort of 2874 GD patients and 2906 controls (Supplemental Table 2). Rs5912838 and rs3827440 were also selected for genotyping because they were previously reported to be significantly associated with GD in the Chinese Han population (8,9). Among these 11 selected SNPs, rs3827440 was in high linkage with rs5912838, rs6619800, and rs5912203 (r2 > 0.8) [Fig 1(C)], and rs1736642 was excluded because of a failed probe synthesis; thus, 10 SNPs in this locus were further genotyped in the replication stage. After quality control, rs3827440 was the best association signal with GD in the replication stage (PReplication = 4.40 × 10⁻¹¹; OR, 1.29; 95% CI, 1.20 to 1.39). Meanwhile, in the combined database with 4316 GD cases and 4374 controls, rs3827440 was confirmed as having the most substantial association (PCombined = 2.45 × 10⁻¹⁵; OR, 1.30; 95% CI, 1.22 to 1.39) (Table 2). Additionally, rs1736645 exhibited the second strongly association signal (PCombined = 5.00 × 10⁻¹³; OR, 1.27; 95% CI, 1.19 to 1.36) after excluding rs3827440 and its highly linked SNPs, rs5912203 and rs5912838.
Association Results of Tag SNPs on Xq21.1 in the 2-Stage Population
| GWAS (1442 vs 1468) | Replication (2874 vs 2906) | Combined (4316 vs 4374) | |||||||||||||||
|---|---|---|---|---|---|---|---|---|---|---|---|---|---|---|---|---|---|
| SNP | Chr. Position | Risk Allele | Case (RAF) | Control (RAF) | P | OR | 95% CI | Case (RAF) | Control (RAF) | P | OR | 95% CI | Case (RAF) | Control (RAF) | P | OR | 95% CI |
| rs5912203 | 78258106 | T | 0.63 | 0.56 | 3.47 × 10⁻⁷ | 1.34 | 1.20–1.50 | 0.63 | 0.57 | 1.31 × 10⁻¹⁰ | 1.28 | 1.19–1.39 | 0.63 | 0.57 | 8.50 × 10⁻¹⁵ | 1.30 | 1.21–1.39 |
| rs12687858 | 78416403 | C | 0.72 | 0.67 | 1.87 × 10⁻⁵ | 1.30 | 1.15–1.46 | 0.72 | 0.67 | 7.27 × 10⁻⁸ | 1.25 | 1.15–1.35 | 0.72 | 0.67 | 8.21 × 10⁻¹¹ | 1.26 | 1.18–1.35 |
| rs3827440 | 78426988 | T | 0.63 | 0.56 | 1.64 × 10⁻⁷ | 1.35 | 1.21–1.51 | 0.63 | 0.57 | 4.41 × 10⁻¹¹ | 1.29 | 1.20–1.39 | 0.63 | 0.57 | 2.45 × 10⁻¹⁵ | 1.30 | 1.22–1.39 |
| rs5912838 | 78497118 | A | 0.64 | 0.56 | 4.15 × 10⁻⁸ | 1.37 | 1.22–1.53 | 0.64 | 0.58 | 1.44 × 10⁻⁹ | 1.26 | 1.17–1.36 | 0.64 | 0.58 | 1.69 × 10⁻¹⁴ | 1.29 | 1.21–1.38 |
| rs5912849 | 78524009 | A | 0.66 | 0.60 | 8.45 × 10⁻⁶ | 1.29 | 1.15–1.44 | 0.65 | 0.62 | 1.56 × 10⁻⁴ | 1.16 | 1.07–1.25 | 0.65 | 0.61 | 3.08 × 10⁻⁸ | 1.20 | 1.13–1.29 |
| rs6619800 | 78526120 | A | 0.61 | 0.53 | 1.60 × 10⁻⁷ | 1.35 | 1.21–1.51 | 0.59 | 0.54 | 6.62 × 10⁻⁷ | 1.21 | 1.12–1.30 | 0.59 | 0.53 | 6.94 × 10⁻¹² | 1.25 | 1.17–1.34 |
| rs5959298 | 78557332 | A | 0.71 | 0.65 | 6.44 × 10⁻⁵ | 1.27 | 1.13–1.43 | 0.70 | 0.66 | 1.12 × 10⁻⁵ | 1.20 | 1.10–1.29 | 0.70 | 0.66 | 1.35 × 10⁻⁸ | 1.22 | 1.14–1.31 |
| rs6619915 | 78587587 | A | 0.50 | 0.44 | 2.62 × 10⁻⁵ | 1.27 | 1.14–1.42 | 0.50 | 0.45 | 7.22 × 10⁻⁷ | 1.21 | 1.12–1.30 | 0.50 | 0.45 | 3.91 × 10⁻¹¹ | 1.24 | 1.17–1.33 |
| rs1736645 | 78597195 | C | 0.60 | 0.54 | 4.44 × 10⁻⁶ | 1.30 | 1.16–1.46 | 0.61 | 0.55 | 6.93 × 10⁻⁹ | 1.25 | 1.16–1.35 | 0.61 | 0.55 | 5.00 × 10⁻¹³ | 1.27 | 1.19–1.36 |
| rs75810848 | 78609329 | C | 0.49 | 0.43 | 1.47 × 10⁻⁵ | 1.29 | 1.15–1.44 | 0.49 | 0.44 | 1.87 × 10⁻⁶ | 1.20 | 1.11–1.29 | 0.49 | 0.44 | 4.76 × 10⁻¹⁰ | 1.23 | 1.15–1.31 |
Abbreviations: Chr., chromosome; RAF, risk allele frequency. Bold type indicates 2 independent GD-associated SNPs.
To further determine the causal variants for GD in this region, we performed forward regression analysis based on the combined database. Consequently, rs3827440 (PForward = 0.001) was found to be an independent GD-associated signal after excluding its highly linked SNPs, rs5912838, rs6619800, and rs5912203. Meanwhile, rs1736645 (PForward = 0.009) seems to be another independent variant associated with GD on Xq21.1. Moreover, the regression models of all tag SNPs in this region could be improved at the level of P < 0.05 by rs3827440 using 2-locus conditional logistic regression analysis (Supplemental Fig.). However, all SNPs except rs1736645 (P = 0.012) could not improve the regression models at the level of P < 0.05 if rs3827440, as the best marker in the Xq21.1 region, was put into these models (Supplemental Fig.). All of these data indicated that rs3827440 or its highly linked SNPs were probably the best variants in the Xq21.1 region for the susceptibility to GD.
The effects of rs3827440 on GPR174 and ITM2A expression in monocytes and PBMCs
Rs3827440 was a nonsynonymous SNP in GPR174 and was located near the 3′-untranslated region of ITM2A (distance, 196 kb); thus, the correlation of GPR174 and ITM2A expression in monocytes or PBMCs with rs3827440 was further investigated. Interestingly, through cis-eQTL analysis using transcriptome data from the monocytes of 432 Caucasian individuals, we found that the expression level of ITM2A in monocytes was correlated with rs3827440 (P = 2.48 × 10⁻⁴; Table 3) (17). Rs3827440 showed no eQTL effect on the expressions of P2RY10 and GPR174, which were also located in the susceptibility locus of GD Xq21.1. We then evaluated allele-specific effects of rs3827440 on the expression of ITM2A and GPR174 in PBMCs from 191 healthy volunteers. The results showed that the rs3827440 genotype was correlated with the expression of ITM2A in PBMCs (P = 0.008), but not with that of GPR174 (P = 0.114) [Fig. 2(A)]. It has been reported that rs5912838, highly linked to rs3827440 (r2 = 0.92), was the best GD-associated signal on Xq21.1 (8). We also detected the allele-specific effects of rs5912838 on ITM2A expression and found that the genotypes of rs5912838 were also correlated with the expression of ITM2A in PBMCs (P = 0.008) [Fig. 2(B)]. These data suggested that rs3827440 or its linked SNPs probably contributed the susceptibility to GD by regulating the expression of ITM2A.
Stimulated-eQTL Results of ITM2A and GWAS
| SNP | SNP Pos. | P GWAS | P LPS2 | P LPS24 | P IFN24 | P Naïve Value | Min. Dataset |
|---|---|---|---|---|---|---|---|
| rs5912724 | 78305516 | 4.39 × 10⁻⁷ | NA | 2.11 × 10⁻⁴ | 1.42 × 10⁻³ | 2.70 × 10⁻³ | LPS24 |
| rs5912792 | 78425636 | 1.61 × 10⁻⁷ | 8.94 × 10⁻³ | 9.40 × 10⁻⁷ | 1.26 × 10⁻⁵ | 2.48 × 10⁻⁴ | LPS24 |
| rs3810712 | 78426471 | 1.85 × 10⁻⁷ | 8.69 × 10⁻³ | 1.19 × 10⁻⁶ | 2.06 × 10⁻⁵ | 3.32 × 10⁻⁴ | LPS24 |
| rs3810711 | 78426488 | 1.61 × 10⁻⁷ | 8.94 × 10⁻³ | 9.40 × 10⁻⁷ | 1.26 × 10⁻⁵ | 2.48 × 10⁻⁴ | LPS24 |
| rs3827440 | 78426988 | 1.64 × 10⁻⁷ | 8.94 × 10⁻³ | 9.40 × 10⁻⁷ | 1.26 × 10⁻⁵ | 2.48 × 10⁻⁴ | LPS24 |
| rs5912838 | 78497118 | 4.15 × 10⁻⁸ | 6.87 × 10⁻³ | 2.04 × 10⁻⁶ | 3.20 × 10⁻⁵ | 2.64 × 10⁻⁴ | LPS24 |
| rs5959298 | 78557332 | 6.44 × 10⁻⁵ | 1.43 × 10⁻³ | 1.49 × 10⁻⁴ | 3.08 × 10⁻³ | NA | LPS24 |
| rs1751107 | 78601102 | 2.28 × 10⁻⁶ | 4.90 × 10⁻⁵ | NA | 2.74 × 10⁻⁴ | 2.59 × 10⁻⁴ | LPS2 |
Abbreviations: Naïve, monocytes without LPS or IFN treatment; P IFN-γ 24 value, P value of monocytes treated with IFN-γ for 24 hours; P LPS2 value, P value of each SNP-regulated ITM2A gene expression in monocytes treated with LPS for 2 hours; P LPS24 value, P value of monocytes treated with LPS for 24 hours; Pos., position. Bold type indicates 2 independent GD-associated SNPs.
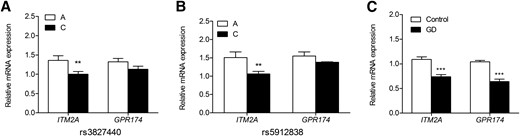
Association of the transcription levels of ITM2A and GPR174 and rs3827440 and rs5912838. (A) The transcription level of ITM2A but not GPR174 was regulated by susceptibility SNP rs3827440 in PBMCs from healthy individuals (TT, n = 51; TC, n = 60; CC, n = 78). (B) The transcription level of ITM2A but not GPR174 was regulated by susceptibility SNP rs5912838 in PBMCs from healthy individuals (AA, n = 74; AC, n = 59; CC, n = 55). (C) Transcription levels of ITM2A and GPR174 in PBMCs from 56 untreated GD patients were significantly decreased compared with that in 191 healthy individuals PBMCs. Data are presented as the mean ± standard error of the mean. **P ≤ 0.01; ***P ≤ 1 × 10⁻⁶. Statistical analysis was performed by 1-way analysis of variance. mRNA, messenger RNA.
Environmental factors: viral and bacterial infections contributed to GD by interacting with the susceptibility gene ITM2A
Cumulating evidence has shown that infections by bacteria and viruses are the major environmental triggers for GD, but little is known about the mechanisms (12–16). Most recently, the cis-eQTL database developed by Fairfax et al. (19) collected the results regarding the correlation of SNP genotypes with the transcriptome in monocytes after LPS and IFN-γ stimulation recruited from 432 healthy Europeans (19). Monocytes mediate innate immune responses in humans and may be activated by LPS and IFN-γ after infection. In the current study, we found that the rs3827440 genotypes were correlated with the expression of ITM2A in both monocytes and PBMCs. Thus, it is tempting to assume that the interaction between infections and risk variant rs3827440 contributed the susceptibility to GD by regulating expression of ITM2A in monocytes, which is a susceptibility gene for GD in the Xq21.1 region. Notably, by searching the cis-eQTL database, among the 3 annotated genes on Xq21.1, P2RY10, GPR174, and ITM2A, only ITM2A expression in monocytes was found to be regulated by SNPs in this region. We identified 63 SNPs on Xq21.1 correlated with ITM2A expression in monocytes after LPS and IFN-γ stimulation with different genotypes. SNPs that affect gene expression were referred to as eSNPs. Among these 63 eSNPs, 50 SNPs were included in our GWAS data after quality control, but only 8 SNPs were associated with GD at the level of PGWAS ≤ 1 × 10⁻⁴ (Fig. 3; Table 3; Supplemental Table 3). Moreover, compared with the correlations among these 8 eSNPs and ITM2A expression in the monocytes without LPS or IFN-γ stimulation, the correlations between these eSNPs with ITM2A expression in monocytes stimulated by LPS or IFN-γ for 24 hours were dramatically strengthened indicated by the smaller P value (Table 3). Interestingly, rs3827440, as well as its highly linked SNPs such as rs5912838, rs5912724, rs5912792, rs3810712, and rs3810711 (r2 > 0.9; Supplemental Table 4), showed the most substantial correlation with ITM2A expression in monocytes stimulated by LPS and IFN-γ for 24 hours (Table 3). Conversely, only rs1751107 was most significantly associated with ITM2A expression in monocytes after LPS stimulation for 2 hours. Among these 8 eSNPs associated with GD, rs5959298, conditioned by rs3827440 in the combined cohort of our results, did not affect ITM2A expression under naïve state (Table 3). Interestingly, we also found that ITM2A and GPR174 expression was dramatically decreased in PBMCs from untreated GD patients compared with PBMCs from control subjects (P = 4.73 × 10⁻⁷ for ITM2A and P = 4.36 × 10⁻¹⁰ for GPR174, respectively) [Fig. 2(C)].
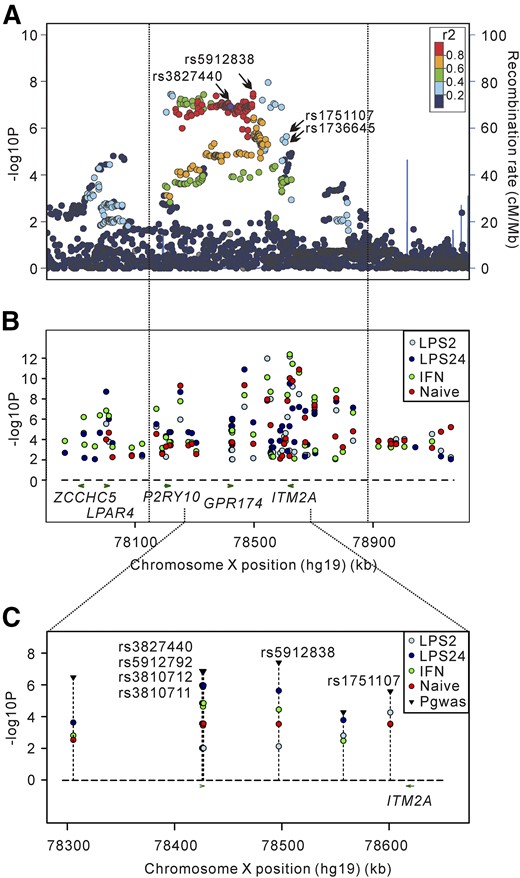
Regional plots of association results of GWAS and stimulus-specific eQTLs of ITM2A. (A) GD-associated SNPs in the Xq21.1 region in the GWAS stage; rs3827440, rs5912838, rs1736645, and rs1751107 are shown as indicated by the arrows. (B) Total eQTL results of ITM2A on Xq21.1. The P values of 63 eSNPs regulating ITM2A expression in monocytes with or without LPS or IFN-γ stimulation. (C) The effect of 8 GD-associated SNPs with PGWAS ≤ 1 × 10⁻⁴ on the expression of ITM2A in monocytes with or without LPS or IFN-γ treatment. PGWAS of each SNP is shown as a black reverse triangle. LPS2, monocytes stimulated with 20 ng/mL LPS for 2 hours; LPS24, monocytes stimulated with 20 ng/mL LPS for 24 hours; IFN-γ, monocytes stimulated with 20 ng/mL IFN-γ for 24 hours; naïve, monocytes without any treatment.
Discussion
Previous studies have provided evidence that Xq21.1 is a susceptibility locus for GD in the Chinese Han population (8). Here, by using our GWAS data and tag SNP strategy, we performed a refining study to identify GD susceptibility SNPs and genes in this region; we found that rs3827440 was the best SNP in the Xq21.1 region with the most important association with GD (P = 2.45 × 10⁻¹⁵). The possible causal SNP rs3827440 on Xq21.1 was a nonsynonymous SNP in GPR174, and its genotypes were reported to be associated with GPR174 messenger RNA levels in PBMCs (9). However, in the current study, the transcription level of ITM2A but not GPR174 in PBMCs from volunteers without thyroid disease was regulated by the different alleles of rs3827440 and its linked SNP rs5912838. Moreover, by searching the cis-eQTL database, ITM2A expression in monocytes was found to be regulated by rs3827440 as well as its linkage SNPs such as rs5912838, rs5912724, rs5912792, rs3810712, and rs3810711. All the data suggested that rs3827440 and its high linkage SNPs probably contributed to the susceptibility to GD on Xq21.1 by regulating the expression of ITM2A, but not GPR174, in monocytes. More recently, GWAS have had provided more success in identifying genetic variants associated with GD. Before now, more than 20 loci were well-known as having a creditable susceptibility to GD (7,8,19,24). However, among the GD-associated genes in the non-MHC region, ITM2A showed a strong association with GD (OR, 1.30), similar to that of TSHR (OR, 1.35) and CTLA4 (OR, 1.30) in the Chinese Han population (7).
Viral and bacterial infections, especially YE, function as triggers in the pathogenesis of GD (12). YE outer membrane porin F protein shares cross-immunogenicity with a leucine-rich domain of thyroid-stimulating hormone receptor (TSHR) and is recognized by an antihuman TSHR antibody. Immunization of mice with YE outer membrane porin F protein can induce the secretion of TSHR autoantibodies (12,13). Moreover, HCV and EBV are the most important candidate viruses for autoimmune thyroid disease (25). Clinically, IFN therapy against HCV infection leads to autoimmune thyroiditis (26); however, the relationship between the previously mentioned mechanisms and the development of GD remains merely an attractive hypothesis. The connection, if any, between environmental triggers and genetic factors remains elusive.
As mentioned, Fairfax et al. established the cis-eQTL database that catalogues genetic variants in the whole genome that regulate messenger RNA expression in monocytes after LPS and IFN-γ stimulation. LPS is a well-known bacterial product, and virus infections induce an increase of cytokines, such as IFN in vivo. Both IFN and LPS activate the innate immune system, triggering activity in monocytes; thus, the cis-eQTL database provided an opportunity to investigate how infections, as environmental factors, trigger development of autoimmune diseases such as GD by interaction with genetic variants (18). Interestingly, we found that ITM2A expression in monocytes was regulated by 63 specific SNPs located on the Xq21.1 locus. Among these, 8 SNPs, including rs3827440 and rs1751107, were significantly associated with GD. Meanwhile, rs3827440, as well as its highly linked SNPs, showed the most substantial correlation with ITM2A expression in monocytes subjected to LPS and IFN-γ stimulation for 24 hours. Based on these data, we propose that the contribution of rs3827440 to GD susceptibility is most likely mediated by the response of ITM2A expression in monocytes subjected to LPS and IFN-γ stimulation. Therefore, we hypothesize that the interaction of infections, such as bacterial and viral infections, with genetic variants, such as rs3827440, affects the expression of susceptibility gene ITM2A in monocytes, contributing to the pathogenesis of GD.
ITM2A was identified as a target gene of GATA-3, which is critical for the development of CD4+ T helper (Th) cells, Th2 cell differentiation, regulatory T-cell function (27), and CD8+ cytolytic T-cell (Tc cell) activation (11), and homeostasis (28–31). ITM2A is induced during major histocompatibility complex–mediated positive selection of double-positive thymocytes (31,32). Peripheral naïve Th and Tc cells express a low level of ITM2A, which could be transiently induced after T-cell activation. Meanwhile, ITM2A expression is significantly higher in effector Th cells than in regulatory T cells (33,34). ITM2A overexpression in transgenic mice causes downregulation of CD8 in CD4+CD8+ double-positive thymocytes. Furthermore, ITM2A deficiency in mice results in an attenuated Th-cell–dependent humoral immune response and a partial defect in the transition from CD4+CD8dull to CD8 single-positive stage (28). Considering that GD is an autoimmune disease and that CD8+ T cells are diminished in both the peripheral and thyroid tissues of patients with GD, leading to an increase in the ratio of CD4+/CD8+ (35, 36), ITM2A is probably involved in the immunologic pathogenesis of GD.
In conclusion, the current study uncovered that rs3827440 was the best association signal with GD by conducting a refining study on Xq21.1 based on our previous GWAS data. Meanwhile, the levels of ITM2A expression in monocytes after LPS and IFN-γ stimulation showed substantial difference among healthy Europeans carrying different genotypes of rs3827440. These data suggest that ITM2A was probably a susceptibility gene to GD on Xq21.1 and also that environmental factors, such as viral and bacterial infections, likely contribute to GD pathogenesis by interaction with susceptibility SNP rs3827440 or its high linkage SNPs to regulate ITM2A expression in monocytes. This study reports that how genetic and environmental factors interact to contribute to the development of GD and provide evidence to interpret GWAS data.
Abbreviations:
- CI
confidence interval
- CT
cycle threshold
- EBV
Epstein-Barr virus
- eQTL
expression quantitative trait locus
- eSNP
expression SNP
- GD
Graves disease
- GWAS
genome-wide association study
- HCV
hepatitis C virus
- IFN
interferon
- LPS
lipopolysaccharide
- OR
odds ratio
- PBMC
peripheral blood mononuclear cell
- PCR
polymerase chain reaction
- SNP
single nucleotide polymorphism
- TSHR
thyroid-stimulating hormone receptor
- Th
T-helper
- YE
Yersinia enterocolitica
Acknowledgments
We are grateful to all volunteers who participated in this study.
This work was supported in part by the National Natural Science Foundation of China (Grants 81270863, 81430019, 81370888, 31571296, 81472177, 81270624, 81400776, and 31501015), Shanghai Municipal Commission of Health and Family Planning Outstanding Young Scholars (Grant XYQ2013086), Shanghai Science and Technology Committee Youth Sailing Program (Grant 14YF1411800), Natural Science Foundation of Jiangsu Province (Grant BK2012575), and Jiangsu Provincial Special Program of Medical Science (Grant BL2014027).
Author contributions: H.D.S., C.X.Z., and J.L. conceived and designed the project. X.P.Y., C.X.Z., and J.L. contributed to the project management. X.P.Y., F.F.Y., J.W., M.L., Y.R.M., F.S., and M.M.Z. contributed to the replication genotyping. F.F.Y., L.L.Z., and Y.R.M. took part in the statistical analysis and expression quantitative trait locus analysis. W.L., L.Q.X., J.Y.S, S.X.Z., and J.L. took part in the collection of clinical samples, extracted DNA, and undertook sample quality control. X.P.Y., H.D.S., and C.X.Z. wrote the manuscript.
Disclosure Summary: The authors have nothing to disclose.
References
Author notes
These authors contributed equally to this study.
Address all correspondence and requests for reprints to: Huai-Dong Song, MD, PhD, Department of Endocrinology and Molecular Biology, State Key Laboratory of Medical Genomics, Shanghai Institute of Endocrinology and Metabolism, Ruijin Hospital affiliated to Shanghai Jiaotong University School of Medicine, Shanghai 200025, China. Email: [email protected].
