


Abstract
In postmenopausal women, adipose tissue (AT) levels of estrogens exceed circulating concentrations. Although increased visceral AT after menopause is related to metabolic diseases, little is known about differences in estrogen metabolism between different AT depots.
We compared concentrations of and metabolic pathways producing estrone and estradiol in abdominal subcutaneous and visceral AT in postmenopausal women.
AT and serum samples were obtained from 37 postmenopausal women undergoing surgery for nonmalignant gynecological reasons. Serum and AT estrone, estradiol, and serum estrone sulfate (E1S) concentrations were quantitated using liquid chromatography-tandem mass spectrometry. Activity of steroid sulfatase and reductive 17β-hydroxysteroid dehydrogenase enzymes was measured using radiolabeled precursors. Messenger RNA (mRNA) expression of estrogen-converting enzymes was analyzed by real-time reverse transcription quantitative polymerase chain reaction.
Estrone concentration was higher in visceral than subcutaneous AT (median, 928 vs 706 pmol/kg; P = 0.002) and correlated positively with body mass index (r = 0.46; P = 0.011). Both AT depots hydrolyzed E1S to estrone, and visceral AT estrone and estradiol concentrations correlated positively with serum E1S. Compared with visceral AT, subcutaneous AT produced more estradiol from estrone (median rate of estradiol production, 1.02 vs 0.57 nmol/kg AT/h; P = 0.004). In visceral AT, the conversion of estrone to estradiol increased with waist circumference (r = 0.65; P = 0.022), and estradiol concentration correlated positively with mRNA expression of HSD17B7 (r = 0.76; P = 0.005).
Both estrone and estradiol production in visceral AT increased with adiposity, but estradiol was produced more effectively in subcutaneous fat. Both AT depots produced estrone from E1S. Increasing visceral adiposity could increase overall estrogen exposure in postmenopausal women.
In postmenopausal women, peripheral estrogen production plays a crucial role in regulating local and circulating estrogen concentrations (1–3). Estrone (E1) and 17β-estradiol (E2) levels in adipose tissue (AT) are several fold higher than in the circulation, reflecting active local estrogen synthesis in AT (4–6). Visceral more than subcutaneous obesity is related to chronic inflammation and AT dysfunction, which increase the risks for postmenopausal hormone receptor−positive breast cancer (7, 8) and metabolic disorders (9, 10).
Subcutaneous and visceral AT differ in terms of their adipokine profiles (7, 11), expression, and action of androgen- and glucocorticoid-converting enzymes on both adipocyte and whole tissue levels (12), suggesting that sex hormones in AT may regulate body fat distribution and local adiposity (7). Less is known about the differences in estrogen metabolism between different AT depots in women (6, 13–15).
E1, the predominant estrogen in postmenopausal women (16), is synthesized in peripheral tissues from the circulating androgen precursor androstenedione by aromatase (17). Another abundantly available circulating prohormone of active estrogens is estrone sulfate (E1S) (18). The steroid sulfatase (STS) enzyme, widely found in peripheral tissues (19), hydrolyzes E1S to E1. E1 is a weak estrogen and can bind to the estrogen receptor or be transformed into the biologically most potent estrogen, E2, by reductive 17β-hydroxysteroid dehydrogenase (17β-HSD) types 1, 7, and 12 (14, 20). 17β-HSD types 2, 4, 8, and 14 convert E2 to E1 (21). Together with aromatase, STS is thus a key enzyme in regulating bioavailability of active estrogens in peripheral tissues. We previously reported the hydrolysis of dehydroepiandrosterone sulfate (DHEAS) to dehydroepiandrosterone (15), but it is unclear whether STS hydrolyzes E1S to E1 in human AT.
Our aim was to compare estrogen concentrations and metabolic pathways producing E1 and E2 in subcutaneous and visceral AT in postmenopausal women. We investigated whether the STS enzyme converts E1S to E1 in postmenopausal AT and, in addition, studied the conversion of E1 to E2 by determining the activity of reductive 17β-HSD enzymes. Furthermore, we quantitated local estrogen concentrations in AT by liquid chromatography-tandem mass spectrometry (LC-MS/MS) and determined the relative messenger RNA (mRNA) expression levels of estrogen-metabolizing enzymes (STS; aromatase; 17β-HSD types 2, 7, and 12).
Materials and Methods
Subjects and study design
We collected abdominal subcutaneous and visceral AT samples from postmenopausal women (n = 37) undergoing laparoscopic or abdominal surgery for nonmalignant reasons at the Helsinki University Hospital, Department of Obstetrics and Gynecology. Surgery indications included uterine fibroids (n = 13), ovarian cysts (n = 15), uterine polyp (n = 1), partial/total prolapse of the uterus (n = 7), and diagnostic laparoscopy (n = 1). Women with endometriosis or women using systemic postmenopausal hormone therapy, oral contraceptives, or gonadotropin-releasing hormone agonists 4 weeks or less before the operation were excluded. Body mass index (BMI), waist/hip ratio, and waist circumference were recorded as measures of adiposity. Postmenopausal status was confirmed by measuring levels of follicle-stimulating hormone (≥26.7 IU/L for postmenopausal women, HUSLAB) and by date of last period (at least 6 months previously) (Table 1).
Clinical Characteristics
| Clinical Characteristics | n = 37 |
|---|---|
| Age, y | 61 (46–84) |
| BMI, kg/m2 | 26 (21–37) |
| Waist/hip ratio | 0.87 (0.74–1.05) |
| Waist circumference, cm | 92 (73–114) |
| Serum follicle-stimulating hormone, IU/L | 64 (34–188) |
| Serum SHBG, nmol/L | 56 (13–97) |
| Clinical Characteristics | n = 37 |
|---|---|
| Age, y | 61 (46–84) |
| BMI, kg/m2 | 26 (21–37) |
| Waist/hip ratio | 0.87 (0.74–1.05) |
| Waist circumference, cm | 92 (73–114) |
| Serum follicle-stimulating hormone, IU/L | 64 (34–188) |
| Serum SHBG, nmol/L | 56 (13–97) |
Data are expressed as median (range).
Abbreviation: SHBG, sex hormone−binding globulin.
Blood samples were obtained preoperatively, and serum was separated by centrifugation within 1 hour and stored at −80°C. In the operation theater, AT samples ranging between 500 mg and 5 g each were immediately snap-frozen in liquid nitrogen and stored at −80°C until analysis. In individual analyses, the number of samples varied between eight and 37 because of the restricted amount of AT obtained from each patient. The ethics committee of the Helsinki University Hospital accepted the study protocol, and the women gave their informed consent.
Quantification of E1 and E2 in AT and serum
Paired AT samples from an individual patient were analyzed within the same assay except for one patient. E1 concentration in AT was determined by LC-MS/MS as described (4), and interassay variations were 16% and 17% in nine consecutive assays (pooled male serum used as control; Sigma-Aldrich, St. Louis, MO; with 180 and 540 pmol/L of added exogenous E1). The mean recovery of tritium-labeled E1 used to correct for procedural losses was 75% for n = 18 determinations in six assays. For serum E1, 13C3-E1 (102.6 ± 0.1 μg/mL in methanol; IsoSciences LLC, King of Prussia, PA) was added as an internal standard (IS) followed by extraction and analysis by LC-MS/MS (4). The limit of quantification (LOQ) for E1 was 15 pmol/L.
For determination of E2 by LC-MS/MS, ∼200 mg of AT or 1 mL of serum was extracted and purified as described (22, 23) and diluted in 1 mL of methanol. An aliquot of 0.5 mL was evaporated to dryness and dissolved in 0.25 mL methanol/water [1:1, volume-to-volume ratio (v/v)] and further processed for E2 with LC-MS/MS as described for serum (15). In short, calibrators containing 25 to 1000 pmol/L of E2 were prepared in 50% methanol. An aliquot of 0.025 mL of 5 nmol/L 13C3-E2 (E-073 Cerilliant; Sigma-Aldrich) was added to all samples and calibrators as an IS before LC-MS/MS. E2 was detected with the following transitions: m/z 271.2 to m/z 145.2 and 183.0 and IS m/z 274.2 to m/z 148.2 in the negative ion mode. The LOQ for E2 in serum was 15 pmol/L and in AT was 20 pmol/L. Intra-assay variation for E2 was 9.5% (parallel determinations of eight visceral AT samples from one postmenopausal subject). Interassay imprecision for the E2 method was 11% for control serum in 12 consecutive assays and 22% and 5% for two female AT pools in eight and three consecutive assays, respectively. The mean extraction recovery using tritium-labeled E2([6,7-3H(N)], specific activity 1.48 TBq/mmol; Perkin Elmer, Waltham, MA) added to AT was 89% in six determinations; when using 13C3-E2 with deuterated E2 (D5-E2, D-5403; C/D/N Isotopes Inc., Pointe-Claire, QC, Canada) added to the samples before analysis by LC-MS/MS, the mean recovery of 13C3-E2 in AT was 89% in four determinations.
In the 40 to 300 pmol/L range of the E2 LC-MS/MS calibration curve, we compared the linearity of E2 determination in four ∼50-mg pieces and four ∼200-mg pieces of visceral AT from the same postmenopausal subject. The samples were homogenized in 1 mL of water, and 13C3-E2 was added as an IS, after which the samples were extracted and purified as described (22) and analyzed for E2 using LC-MS/MS. The calculated mean (standard deviation) concentrations of E2 were similar: 866 (139) pmol/kg AT and 897 (98) pmol/kg AT for 50-mg and 200-mg AT samples, respectively.
Quantification of E1S in serum
We added 50 μL of IS (D4-E1S, 50 nmol/L; C/D/N Isotopes Inc.) to serum (0.1 mL diluted in 1 mL of water) and to calibrators (0.1 mL; 0.2 to 50 nmol/L E1S; Sigma-Aldrich). After careful mixing, the samples were applied to solid phase cartridges (solid phase extraction; Oasis® HLB 1 cc, 30 mg; Waters, Ireland) that had been prewashed with 1 mL of methanol and 2 mL of water using vacuum equipment (VacMaster; Norlab Oy, Vantaa, Finland). The solid phase extraction sorbent was dried under vacuum before samples were collected with 0.5 mL of methanol. After evaporation, the residue was dissolved in 0.15 mL of 50% methanol.
We analyzed 10-µL sample extracts and calibrators with LC-MS/MS equipped with an API 4000 or 5500 triple-quadrupole mass spectrometer (AB Sciex, Concord, ON, Canada). When the API 5500 mass spectrometer was used, samples were diluted 10-fold with 50% methanol. Peripherals included an Agilent series 1200 HPLC system with a binary pump (Waldbronn, Germany). Separation was performed as described (15). The gradient was 0 to 1 minute 50% B, 1.5 minutes 100% B, 3.5 minutes 100% B, and 3.6 to 10 minutes 50% B. The column was directly connected to the electrospray ionization probe. E1S was detected in the negative mode with transitions: m/z 349.0 to m/z 268.9 and m/z 144.9 and with IS: m/z 353.0 to m/z 272.9. Data were processed with Analyst Software (Ver. 1.4.2; AB Sciex). Mass calibration and resolution adjustments were performed as described (16). The LOQ was 0.1 nmol/L. The relative recoveries of 10 spiked serum samples (<0.1 nmol/L of E1S) were 99% to 106% for 10 nmol/L of E1S. Interassay variation for serum E1S in 10 consecutive assays was 6.4% at 1.0 nmol/L, 7.8% at 2.1 nmol/L, 4.0% at 7.3 nmol/L, and 3.2% at 36.9 nmol/L.
STS activity assay
Tritium-labeled E1S ([6,7-3H(N)], specific activity 1.48 TBq/mmol; PerkinElmer) was purified in a 2.5 × 0.5 cm diethyl-aminoethyl ion exchanger column (24) (DEAE Sephadex A-25; Amersham Biosciences, Uppsala, Sweden). After evaporation, [3H]-E1S in 70% methanol was applied to the column, and unconjugated steroids and other impurities were eluted with 4.0 mL of 70% methanol. [3H]-E1S was eluted from the column and purified as previously described for [3H]-DHEAS (15).
Whole AT samples ∼200 mg were homogenized in 1 mL of 0.1 mol/L Tris-HCl (pH, 7.5) for 30 seconds with Ultra-Turrax (T8; IKA-Werke, Staufen, Germany). Purified [3H]-E1S in 100% ethanol was added to the tissue homogenates (a weighted mean of 5.2 × 10⁵ dpm, or 5.8 pmol per 200 mg AT). Incubation of [3H]-E1S in Tris-HCl was used as control. After a 3-hour incubation at +37°C, the mixture was extracted four times with 3.5 mL of diethyl ether/ethyl acetate (1:1, v/v), the [3H]-E1S−containing water phase was quick-frozen to separate it from the organic fraction, and the ether evaporated under nitrogen flow. The dry residues were dissolved in hexane/chloroform (2:1, v/v) and applied to a 0.5 × 5 cm Sephadex LH-20 chromatography column in three 0.3-mL aliquots. The column was washed with 9 mL of the same solvent to remove the lipophilic fraction, and [3H]-E1 was eluted with 5 mL of methanol. After evaporation to dryness, the [3H]-E1−containing fraction was dissolved in methanol, and the radioactivity was determined by liquid-scintillation counting (Rackbeta; Wallac, Turku, Finland). The value of the buffer control was subtracted as a blank from the tissue sample values. STS activity was expressed as [3H]-E1 (nmol) formed from [3H]-E1S per mass of AT (kg) per time of incubation (h).
Activity of 17β-HSD enzymes in converting E1 to E2
Whole AT samples of ∼200 mg were homogenized in 0.1 M of potassium phosphate buffer (pH, 7.4). The incubation mixture containing 75 nmol/L 13C3-E1 (IsoSciences LLC), 150 nmol/L E1 [1,3,5(10)-estratrien-3-OL-17-one; Steraloids, Newport, RI], and 3.7 mmol/L nicotinamide adenine dinucleotide phosphate, reduced form (Roche Diagnostics, Indianapolis, IN) was incubated for 3 hours at +37°C. Incubation of buffer alone or the reagent mixture without AT was used as controls. The incubation mixture was extracted and purified as described for the E1S activity assay and evaporated to dryness. After the addition of 1 mL of methanol, the mixture was separated into aliquots to which deuterated E2 in 50% methanol was added as an IS. After evaporation and addition of 0.125 mL of methanol, the samples were processed for determination of 13C3-E2 by LC-MS/MS. The value of the reagent controls without added AT was subtracted from the tissue sample values. The activity of reductive 17β-HSD enzymes was expressed as 13C3-E2 (nmol) formed from 13C3-E1 per mass of AT (kg) per time of incubation (h).
We added 10 µL of 10-nmol/L D5-E2 in 50% methanol (IS) to calibrators (0.125 mL; 10 to 1000 pmol/L 13C3-E2) and to samples. After the addition of 0.25 mL of water, 4 mL of diethyl ether, and 15 µL of 12.5% aqueous ammonia, the samples were mixed for 3 minutes. The organic layer was collected and transferred into another tube, mixed with 0.2 mL of water, and evaporated to dryness. The residue was dissolved in 0.1 mL of 50% methanol, and 50-µL aliquots of sample extracts and calibrators were analyzed with LC-MS/MS equipped with an API 5500 triple-quadrupole mass spectrometer and an Agilent series 1200 HPLC system. Separation was performed on a tandem column system with a Discovery HS F5-3 column (2.1 × 100 mm, 3 µm; Supelco, Bellefonte, PA) coupled with a SunFire C18 column (2.1 × 50 mm, 3.5 µm; Waters, Milford, MA). The mobile phase was a linear gradient consisting of 200 µmol/L ammonium fluoride (A) and methanol (B), at a flow rate of 0.3 mL/min. The gradient was 0 minutes 50% B, 4.5 minutes 100% B, 8 minutes 100% B, and 8.5 to 17 minutes 50% B. 13C3-E2 and IS were detected in the negative ion mode with transitions: m/z 274.2 to m/z 274.2 and m/z 186.1 and with IS: m/z 276.2 to m/z 276.2. The LOQ was 10 pmol/L.
Preparation of RNA and complementary DNA and quantification of mRNA
Frozen AT samples of 150 to 200 mg were homogenized in 1 mL of TRIzol. mRNA was isolated, purified, and reverse-transcribed into complementary DNA (cDNA) as described (22). Relative mRNA expression levels of STS, CYP19A1, HSD17B2, HSD17B7, and HSD17B12 were measured with real-time reverse transcription quantitative polymerase chain reaction (PCR) using the CFX384 Real-Time PCR Detection System (Bio-Rad, Hercules, CA) and Power SYBR Green PCR master mix (Applied Biosystems, ThermoFisher Scientific, Waltham, MA) with 5- to 20-ng template cDNA in a final reaction volume of 10 μL. PCR was carried out at 95°C for 2 minutes, 40 cycles of 95°C for 5 seconds and 60°C for 30 seconds, followed by melt curve analysis (65°C to 95°C, with 0.5°C increments for 5 seconds). A commercial primer was used for HSD17B2 (PrimerPCRTM PreAmp for SYBR® Green Assay: HSD17B2, Human; Amplicon context sequence: 16:82124555-82131740; Bio-Rad). The primer sequences for the other genes are listed in Wang et al. (22). The range of efficiency was from 90% to 114%. Normalization factors were calculated with the geometric mean of the reference genes, importin 8 (IPO8), lysine-specific demethylase 2B (KDM2B), and glyceraldehyde-3-phospate dehydrogenase (GAPDH) using the Qbase+ qPCR data analysis software (Biogazelle NV, Zwijnaarde, Belgium). For four patients, the relative mRNA expression level of HSD17B2 in subcutaneous AT was below the lowest point on the standard curve of control cDNA, and we therefore gave these patients a relative mRNA expression level equal to one-half that of the patient with the lowest reliably measured relative mRNA expression level.
Other analyses
Serum follicle-stimulating hormone and serum sex hormone−binding globulin (SHBG) were measured as described (5, 15). Circulating free E2 was used as an indicator of bioavailable E2, and the concentration was calculated using the equation Free E2 = [10(−0.003 × SHBG + 0.389) / 100] × E2, where E2 is the concentration of E2 in serum (nmol/L) and SHBG is expressed in nmol/L (25).
Statistical analysis
IBM SPSS Statistics 22.0 software was used for statistical analysis of data. Normality of variables was assessed using the Shapiro-Wilk test. The Wilcoxon signed rank test was applied for pairwise comparisons, and between-group differences were evaluated using the independent-samples Mann-Whitney U test for nonparametric variables. Data are expressed as median (interquartile range) or median (range) unless otherwise stated. Spearman nonparametric correlation was used for correlation analyses. The level of significance was P < 0.05.
Results
Estrogen concentrations in AT and in serum
E1 was the predominant estrogen in AT, and the concentration was higher in the visceral depot than in the subcutaneous depot (928 vs 706 pmol/kg AT) (Fig. 1). The concentration of E2 was similar in subcutaneous and visceral AT (57 vs 52 pmol/kg). The E2/E1 ratio in subcutaneous AT was higher than in visceral AT (0.08 vs 0.06; P = 0.008; n = 14).
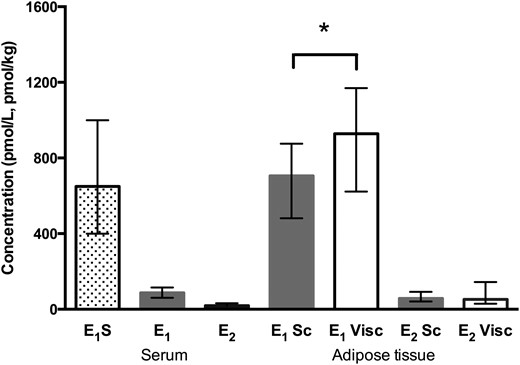
Estrogen concentrations in serum and subcutaneous (Sc) and visceral (Visc) AT. *P = 0.002, subcutaneous vs visceral AT (Wilcoxon signed rank test; n = 24). Serum E1S, n = 28; serum E1, n = 31; serum E2, n = 29. Data are expressed as median (interquartile range).
Local concentrations of E1 in subcutaneous and visceral AT were 8 and 11 times higher, respectively, than the circulating median E1 level (87 pmol/L), and local E2 concentrations were approximately three times higher than median serum E2 level (19 pmol/L) (Fig. 1). E1S was the dominant circulating estrogen, the median concentration (650 pmol/L) being approximately seven times higher than that of circulating E1 and 34 times higher than that of E2.
Visceral AT E1 concentration correlated positively with BMI (r = 0.46; P = 0.011; n = 30), and subcutaneous AT E1 correlated negatively with age (r = −0.47; P = 0.017; n = 25) (Table 2). E1 and E2 concentrations in subcutaneous and visceral AT correlated positively with the corresponding serum levels. Visceral but not subcutaneous AT E1 and E2 also correlated positively with serum E1S.
Correlations Between Subcutaneous and Visceral AT E1 and E2 Concentrations and Related Parameters
| AT | ||||
|---|---|---|---|---|
| E1 Sc (n = 19–25) | E1 Visc (n = 24–30) | E2 Sc (n = 18–22) | E2 Visc (n = 17–23) | |
| Age | −0.47a | −0.34 | −0.01 | −0.12 |
| BMI | 0.32 | 0.46a | 0.04 | 0.13 |
| Serum | ||||
| E1S | 0.31 | 0.70b | 0.33 | 0.46a |
| E1 | 0.52c | 0.61b | 0.68c | 0.71c |
| E2 | 0.38 | 0.54c | 0.63c | 0.64c |
| Free E2 | 0.49a | 0.62c | 0.69c | 0.86b |
| AT | ||||
| E1 Sc | 1.00 | 0.51a | 0.43 | 0.55a |
| E1 Visc | 1.00 | 0.21 | 0.55c | |
| E2 Sc | 1.00 | 0.88b | ||
| E2 Visc | 1.00 | |||
| AT | ||||
|---|---|---|---|---|
| E1 Sc (n = 19–25) | E1 Visc (n = 24–30) | E2 Sc (n = 18–22) | E2 Visc (n = 17–23) | |
| Age | −0.47a | −0.34 | −0.01 | −0.12 |
| BMI | 0.32 | 0.46a | 0.04 | 0.13 |
| Serum | ||||
| E1S | 0.31 | 0.70b | 0.33 | 0.46a |
| E1 | 0.52c | 0.61b | 0.68c | 0.71c |
| E2 | 0.38 | 0.54c | 0.63c | 0.64c |
| Free E2 | 0.49a | 0.62c | 0.69c | 0.86b |
| AT | ||||
| E1 Sc | 1.00 | 0.51a | 0.43 | 0.55a |
| E1 Visc | 1.00 | 0.21 | 0.55c | |
| E2 Sc | 1.00 | 0.88b | ||
| E2 Visc | 1.00 | |||
Data are presented as Spearman correlation coefficient. Boldface indicates statistically significant correlation coefficients. E1S, pmol/L; E1, pmol/L, pmol/kg; E2, pmol/L, pmol/kg.
Abbreviations: Sc, subcutaneous; Visc, visceral.
P < 0.05.
P < 0.001.
P < 0.01.
STS activity
STS activity was similar in subcutaneous and visceral AT [4.7 (4.5 to 5.2) vs 5.1 (4.7 to 5.8) nmol/kg AT/h; median (interquartile range); P = 0.10]. STS activity in subcutaneous AT correlated positively with subcutaneous AT E2 concentration (r = 0.78; P = 0.002; n = 13) and with serum E1 (r = 0.44; P = 0.043; n = 22), serum E2 (r = 0.47; P = 0.042; n = 19), and free E2 (r = 0.56; P = 0.013; n = 19). STS activity did not correlate with E1 concentrations in subcutaneous AT (r = 0.23; P = 0.390; n = 17) or visceral AT (r = −0.26; P = 0.260; n = 21). There was no correlation between BMI or waist circumference and STS activity in subcutaneous or visceral AT (data not shown).
Activity of 17β-HSD enzymes in converting E1 to E2
Reductive 17β-HSD enzymes were more active in subcutaneous than visceral AT (median rate of 13C3-E2 production, 1.02 vs 0.57 nmol/kg AT/h) (Fig. 2). The corresponding 17β-HSD activity in visceral AT correlated with waist circumference (r = 0.65; P = 0.022; n = 12).
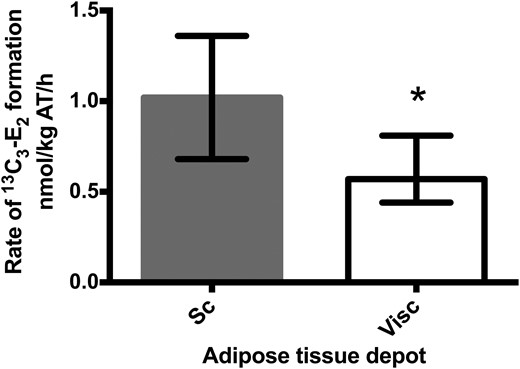
Formation of 13C3-E2 from 13C3-E1 in abdominal subcutaneous (Sc) and visceral (Visc) AT. *P = 0.004, subcutaneous vs visceral AT (Wilcoxon signed rank test, n = 12). Activity is expressed as the amount of 13C3-E2 (nmol) formed from 13C3-E1 per mass of AT (kg) per time of incubation (h). Data are expressed as median (interquartile range).
mRNA expression of genes for estrogen-metabolizing enzymes
The relative mRNA expression level of STS was higher in subcutaneous than in visceral AT (Fig. 3). STS mRNA expression did not correlate with STS activity in subcutaneous AT (r = 0.24; P = 0.57; n = 8) or visceral AT (r = −0.15; P = 0.68; n = 10). The mRNA expression of CYP19A1 was higher in subcutaneous than in visceral AT.
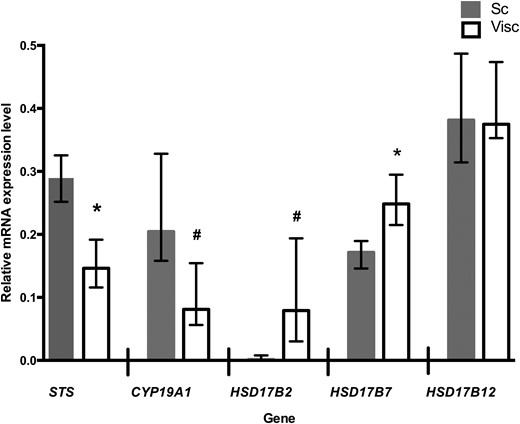
Relative mRNA expression levels of genes for estrogen-metabolizing enzymes in abdominal subcutaneous (Sc) and visceral (Visc) AT. *P ≤ 0.05; #P ≤ 0.01; subcutaneous vs visceral AT (Wilcoxon signed rank test, n = 12). Data are expressed as median (interquartile range) and represent relative expression levels. CYP19A1, aromatase; HSD17B2, HSD17B7, and HSD17B12, hydroxysteroid 17-β dehydrogenase 2, 7, and 12.
The mRNA expression level of E2-producing HSD17B7 was higher in visceral than in subcutaneous AT, whereas the mRNA expression of HSD17B12 was similar in both depots. The mRNA expression of HSD17B7 in visceral AT correlated positively with visceral AT E2 concentration (r = 0.76; P = 0.005; n = 12) and E2/E1 ratio (r = 0.69; P = 0.013; n = 12).
The relative mRNA expression level of E1-producing HSD17B2 was lower in subcutaneous than in visceral AT. The mRNA expression of HSD17B2 in visceral AT correlated negatively with serum E2 (r = −0.64; P = 0.011; n = 15).
Discussion
We showed that in postmenopausal women, E1 concentration was higher in visceral than in abdominal subcutaneous AT, whereas E2 concentrations were similar in the two depots. Furthermore, the high E1 concentration in visceral AT was associated with a high BMI. Although the conversion of E1 to E2 by reductive 17β-HSD enzymes was more efficient in subcutaneous than in visceral AT, the production of E2 in visceral AT was enhanced with increasing waist circumference, and E2 concentration in visceral AT correlated positively with the mRNA expression of HSD17B7. These data may suggest that although both AT depots are capable of producing active estrogens, an increase in adiposity is related to both increased E1 concentration and E2 production in visceral AT.
Although subcutaneous AT is quantitatively more important, comprising some 85% of total AT (26), increased visceral AT is associated with risks for diseases such as hormone receptor−positive breast cancer (8). After menopause, the increasing ratio of circulating androgens to estrogens contributes to the accumulation of visceral AT, and increasing adiposity relates to higher circulating levels of estrogens (27, 28). It is assumed that E1 and E2 produced in peripheral tissues in postmenopausal women act in an intracrine manner (29), but some could leak into the bloodstream along a tissue to serum concentration gradient, thus possibly influencing circulating concentrations of E1, E2, and E1S (2, 7, 30). In the current study, although serum E2 and E1 remained within normal postmenopausal concentrations, we found strong positive correlations between circulating and AT estrogen concentrations. In comparing serum and AT estrogen concentrations, we assumed that 1 mL of serum corresponds to 1 g of AT (5, 31). Visceral AT E1 and E2 levels showed a stronger correlation with serum E1S than did subcutaneous AT estrogens. Taking into account the higher concentration in visceral AT of E1, this could suggest that the visceral AT depot has an important role in the regulation of overall estrogen exposure in postmenopausal women. E1 is produced in peripheral tissues by both STS and aromatization of androstenedione, and local concentrations reflect the balance of several E1-producing and metabolizing pathways (17).
To the best of our knowledge, no other studies have reported the activity of STS in the conversion of E1S to E1 in human AT. Serum E1S is the predominant circulating estrogen and a marker of overall estrogenic activity in postmenopausal women (32). Hydrophilic E1S requires a membrane transporter to reach tissues from the circulation, and organic anion-transporting polypeptide B, a carrier for E1S and a gatekeeper for the STS route, is present in AT (33). We showed that E1S is hydrolyzed to E1 in visceral and subcutaneous AT of postmenopausal women. Although this does not directly prove that STS is a major producer of intracellular E1, our finding suggests that STS may contribute to local E1 concentrations. The mRNA expression of estrone-sulfating SULT1E1 has been linked to promotion of adipogenesis in subcutaneous AT (34), although in other studies mRNA expression of this gene in AT has not been detected (15, 33). It is possible that AT is more of a target than a source of E1S, but the local balance of desulfating and sulfating enzymes requires further investigation.
STS activity in the conversion of E1S to E1 was similar in subcutaneous and visceral AT. E1S is one of several substrates of STS; the others include DHEAS, cholesterol sulfate, and pregnenolone sulfate (35). The affinity of STS for E1S is greater than that for DHEAS (36), reflected by differences in the enzyme activity in metabolizing these substrates (15). We did not find a correlation between STS activity and STS mRNA expression. Little is known about local posttranscriptional modification of STS, but tissue conditions relating to inflammatory factors, for example, most likely play a role (37). In line with previous reports (12, 15), we found the mRNA expression levels of STS and aromatase (CYP19A1) to be higher in subcutaneous than visceral AT. Of E1-producing enzymes, the mRNA expression level of 17β-HSD type 2 was markedly higher in visceral than in subcutaneous AT. Because HSD17B2 has been shown to localize mainly in the vascular wall (38), our finding could relate to a greater number of small blood vessels and increased blood flow in visceral than in subcutaneous AT (39, 40).
In addition to the production of free E1 from E1S in AT, we studied the conversion of E1 into E2. The balance between reductive (E1 to E2) and oxidative (E2 to E1) pathways catalyzed by 17β-HSD enzymes regulates the local concentrations of active estrogens, and E2 formation from E1 may be the favored direction in fat tissue (41). The activity of reductive 17β-HSD enzymes has been shown to increase upon preadipocyte to adipocyte differentiation in both subcutaneous and visceral AT (14). In the current study, the conversion of E1 to E2 was more efficient in subcutaneous than in visceral AT, and the ratio of E2 to E1 was higher in subcutaneous AT. This may suggest that subcutaneous AT is more efficient than visceral fat at producing E2. On the other hand, reductive 17β-HSD activity in visceral AT correlated positively with increasing waist circumference, suggesting that increased visceral adiposity could lead to more efficient production of E2. Visceral AT E2 concentration correlated positively with the mRNA expression of HSD17B7, which was more highly expressed in visceral than in subcutaneous AT, further supporting active production of E2 in visceral AT. However, because E1 concentration in visceral AT increased with BMI, it is possible that increasing obesity also contributes to overall exposure to active estrogens in postmenopausal women.
Our study has some limitations. First, because of the limited quantity of individual AT samples, we were not able to carry out all measurements and analyses for all women. Also, although we analyzed the mRNA expression levels of enzymes involved in estrogen metabolism in AT, we did not have enough tissue material to measure protein levels or aromatase activity. However, the number of AT samples in the current study is substantial when compared with those in previous studies. Second, human AT is not a homogenous organ (7, 38), and in analyzing whole AT samples, we were looking to examine depot differences between subcutaneous and visceral AT. We acknowledge the limitations of studying whole tissue samples in fully excluding sample-to-sample differences in AT composition. Finally, we did not have the opportunity to use body imaging techniques for measurement of subcutaneous and visceral adiposity in the current study. However, we used BMI, waist/hip ratio, and waist circumference as clinical indicators of adiposity, and waist circumference has been a good clinical predictor of abdominal visceral obesity (42). A major strength of the present work is the use of mass spectrometric methods for quantification of estrogens, especially for the relatively low serum concentrations in postmenopausal women.
In conclusion, subcutaneous and visceral AT in postmenopausal women differed in their local production of estrogens. E1 concentration was higher in visceral than in subcutaneous AT, and increasing adiposity was related to a higher E1 concentration and increased local production of E2 from E1 in visceral AT. Thus, in postmenopausal women, visceral adiposity could contribute to a higher overall estrogen exposure.
Abbreviations:
- 17β-HSD
17β-hydroxysteroid dehydrogenase
- AT
adipose tissue
- BMI
body mass index
- cDNA
complementary DNA
- DHEAS
dehydroepiandrosterone sulfate
- E1
estrone
- E1S
estrone sulfate
- E2
17β-estradiol
- IS
internal standard
- LC-MS/MS
liquid chromatography-tandem mass spectrometry
- LOQ
limit of quantification
- mRNA
messenger RNA
- PCR
polymerase chain reaction
- SHBG
sex hormone−binding globulin
- STS
steroid sulfatase
- v/v
volume-to-volume ratio.
Acknowledgments
We thank Anne Ahmanheimo, Päivi Ihamuotila, and Kirsti Räsänen for their expert technical assistance.
Financial Support: This work was supported by Samfundet Folkhälsan, the Sigrid Jusélius Foundation, the Jane and Aatos Erkko Foundation, the Finnish Medical Foundation, the Finnish Menopause Society, and State Funding for University-Level Health Research. Funding sources had no role in the design of the study, data collection and analysis, or interpretation of the results or in the decision to submit the article for publication.
Disclosure Summary: T.S.M. has been a speaker and/or has received consulting fees from Mylan and Novo Nordisk. H.S.-P. has been a speaker for Mylan and has received funding for congress trips from Mylan and MSD. The remaining authors have nothing to disclose.
References
