


Statin is the main lipid-lowering therapy for type 2 diabetes mellitus patients. Recent evidence suggested the cardiovascular protective effects of ezetimibe-simvastatin in acute coronary syndrome patients.
To investigate the effect of ezetimibe-simvastatin combination therapy on stroke prevention among diabetic stroke patients.
This is a retrospective cohort study. Between March 1, 2009 and December 31, 2011, all patients with type 2 diabetes mellitus in Taiwan's National Health Insurance Research Database were screened. Those admitted for ischemic stroke (IS) were recruited and divided into 10-mg ezetimibe-20-mg simvastatin (EZ-SIM), 40-mg atorvastatin (ATOR), and 20-mg simvastatin (SIM) groups for further analyses. The primary outcomes were IS, myocardial infarction, and death from any cause. Patients were followed from index hospitalization to the date of death, loss of follow-up, or study termination.
During the 34-month follow-up period, the risk of recurrent IS in the SIM group was higher than that of the ATOR (hazard ratio [HR], 2.03; 95% confidence interval [CI], 1.46–2.82) and EZ-SIM (HR, 1.69; 95% CI, 1.14–2.50) groups. The risk of recurrent IS was not significantly lower in the EZ-SIM compared with the ATOR group (HR, 1.20; 95% CI, 0.85–1.69). The incidence of composite endpoint was highest in the SIM group (28.2%), followed by the ATOR (16.1%) and EZ-SIM (15.4%) groups. The multivariate adjusted survival curve showed lower trends of recurrent IS in the EZ-SIM and ATOR groups compared with the SIM group.
High-potency lipid-lowering therapy effectively reduces the risk of recurrent IS in diabetic patients regardless of ATOR or EZ-SIM combination therapy.
This study shows that high-potency lipid-lowering therapy is helpful for reducing the recurrence of ischemic stroke risks in DM patients, regardless of high-intensity statin alone or ezetimibe-simvastatin combination therapy is used.
Stroke is a major cause of death and disability worldwide. Secondary prevention of ischemic stroke (IS) is important and risk factor modifications are crucial for reducing recurrence (1). Treatment strategies of cholesterol control may be updated as clinical evidence increases (2, 3). The strategy of “treat-to-target” has changed to “moderate- to high-intensity statin based in statin benefit groups” in the guidelines of American College of Cardiology/American Heart Association in 2013 (4). However, debates are ongoing between the 2 strategies (5–7). The American College of Cardiology/American Heart Association guidelines recommend that individuals with diabetes mellitus (DM) or atherosclerotic cardiovascular disease (ASCVD) should receive moderate to high intensity statin therapy (4). The use of nonstatin therapy cause the suboptimal use of statin and should be considered only when more evidences are available (4). Recently, the IMProved Reduction of Outcomes: VYTORIN Efficacy International Trial (IMPROVE-IT) study revealed that ezetimibe added to simvastatin therapy could improve cardiovascular outcomes in patients with acute coronary syndromes (ACSs) (8). This may fill in the gaps in nonstatin added to statin therapy in ASCVD patients and lead to a revision of clinical guidance in future lipid-lowering therapy (LLT).
Stroke is one of the ASCVD. However, the target achievement of LLT in stroke is not as good as in coronary artery disease (CAD) patients (9, 10). Fewer trials have focused on the secondary preventive effects of LLT in stroke patients (11–13), and most supporting data come from post hoc analyses or meta-analyses of studies that initially enrolled CAD patients (2, 14–16). The protective effects of high-intensity statin therapy on recent stroke patients were significant in the Stroke Prevention by Aggressive Reduction in Cholesterol Levels (SPARCL) trial (11), but that of lower-intensity statins were uncertain in the Japan Statin Treatment Against Recurrent Stroke trial and the Heart Protection Study (12, 13). Nevertheless, the risks of adverse events may be higher in clinical practice and increased in high-intensity statin therapy. Of notes, some doubtful concerns of increased new-onset diabetes and hemorrhagic stroke (HS) incidence in high-intensity statin users might reduce the use of high-intensity statin clinically (9–11, 17, 18), especially for Asians who are vulnerable to HS (19). Combination of ezetimibe and statins could be an alternative LLT reaching good lipid lowering effects with use of lower statin doses. Surprisingly, the recent IMPROVE-IT study demonstrated that ezetimibe added to simvastatin therapy led to a reduction of IS without an increase in HS (8). Similar cerebrovascular protective effect is also noted in patients with chronic kidney diseases (20). Consequently, the direct effects on patients after IS warrant investigation.
This study aimed to evaluate DM patients after IS, with a strict selection, in a nationwide cohort database (21). Under the hypothesis that the high-potency LLT is associated with reduced recurrent strokes in IS patients with DM, regardless of use of high-intensity statin therapy or ezetimibe-simvastatin combination therapy, the effects of 10-mg ezetimibe-20-mg simvastatin (EZ-SIM), 40-mg atorvastatin (ATOR), and 20-mg simvastatin (SIM) were evaluated in these patients.
Materials and Methods
Data source
The National Health Insurance (NHI) program has covered the entire 23 million population of Taiwan. The NHI Research Database (NHIRD) prospectively records all the submitted standardized data of healthcare service. The diagnoses are registered using the International Classification of Diseases, Ninth Revision, Clinical Modification (ICD-9-CM) codes. Validation of the NHIRD data are routinely carried out by the NHI Bureau (22). The advantages of this nation-wide database make the NHIRD useful for large population-based studies (23).
Patient enrollment and exclusion criteria
This open observational noncrossover retrospective cohort study was derived from the NHIRD. Between March 1, 2009 and December 31, 2011, a total of 2 034 974 patients with type 2 DM in the NHIRD (ICD-9-CM codes 250) were initially screened. The study population was confined to patients with the main diagnoses of IS or transient ischemic attack (ICD-9-CM codes 433–435) for hospitalization. Patients without a definite cerebral infarction were excluded (ICD-9 codes of 433.00, 433.10, 433.20, 433.30, 433.80, 433.90, 434.90, 434.00, 434.10, and 434.90). The young-stroke population and patients with renal replacement therapy were also excluded due to limited statin prescription. The other exclusion criteria was shown in Figure 1. The Ethics Institutional Review Board of Chang Gung Memorial Hospital approved this study.
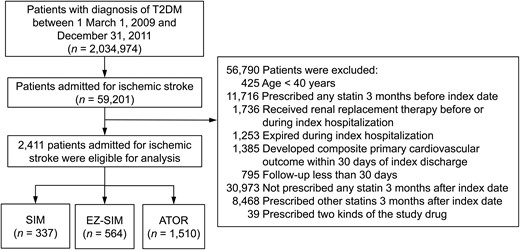
Flow chart of the study patient selection.
Patients with T2DM admitted for IS were included after relevant exclusions and were further divided into 3 groups according to the prescribed LLT. T2DM, type 2 DM.
Exposure of study statin
In study period, participants received statin based on the NHI program lipid-lowering guidelines. Patients with elevated cholesterol levels (low-density lipoprotein cholesterol [LDL-C] level >130 mg/dL) received NHI-paid LLT in either study cohorts and they would keep their LLT when their LDL-C levels reached the therapeutic goal. The treatment goal was less than 100 mg/dL. Crossover use of LLT and dosage adjustments were controlled. Therefore, patients who had any statin prescription 3 months before index hospitalization, nonstudy statin after index hospitalization, and either other study cohort statin or nonstudy cohort statin were not enrolled.
Eligible patients were further divided into 3 groups according to the prescribed LLT including, 1) EZ-SIM, 2) ATOR, and 3) SIM. The ATOR and SIM groups were categorized as high-intensity and moderate-intensity statin therapy respectively. The LDL-C lowering effects of EZ-SIM are theoretically similar to ATOR (4, 24), and could also be categorized as high-potency LLT (25). The first hospitalization for IS throughout the study period was considered the index hospitalization. The follow-up period was based on the index hospitalization to date of death, loss to follow-up, or December 31, 2011.
Outcomes and covariate measurements
Baseline medications and comorbidities were recorded using medication and ICD-9-CM diagnosis codes during the index hospitalization. The primary outcomes were IS, myocardial infarction (MI), and death from any cause. The composite end points included any one of IS, HS, cardiovascular death, or MI. The secondary endpoints included HS, heart failure, cardiovascular death, rhabdomyolysis, and malignant neoplasms. Recurrent IS was identified by hospitalization with ICD-9-CM codes of 433–435 except 433.00, 433.10, 433.20, 433.30, 433.80, 433.90, 434.90, 434.00, 434.10, and 434.90 during the follow-up period. Similarly, MI, heart failure, rhabdomyolysis, and malignant neoplasm were identified using ICD-9-CM codes (Supplemental Table 1) (26, 27). The definition of cardiovascular death, death, and causes of death were the same as with the registry data of NHIRD (27).
Statistical analyses
The baseline characteristics and nonstudy medications among each group were compared using one-way ANOVA for continuous variables or by χ2 test for categorical variables, with Bonferroni post hoc in both tests. Both the risk of event and time to event (of both primary and secondary outcomes) between the groups were compared after index discharge using multivariable Cox proportional hazard model with adjustments for all the variables listed in the Table 1 and Supplemental Table 2. The selected variables included baseline characteristics (age, sex), underlying diseases (previous MI and cerebrovascular accidents [CVAs]), comorbidities, medications, and interventions (carotid stent and percutaneous coronary intervention) that might confound outcomes. We also tested the proportional hazard assumption of the primary outcomes at the last follow-up against the study group using scaled Schoenfeld residual tests. The cumulative survival of recurrent IS for each group was depicted using the Kaplan-Meier method and adjusted survival curves in the multivariable Cox model. Data analyses were conducted using the SPSS 22 (IBM SPSS, Inc). Statistical significance was set at P < .05.
Results
Study patients
A total of 2 034 974 patients with type 2 DM were initially enrolled, including 59 201 who were admitted for IS. After excluding 56 790 patients, 2411 patients were eligible for analyses and were further divided into the 3 treatment groups according to the LLT. The EZ-SIM group had 564 patients, the ATOR group had 1510, and the SIM group had 337 (Figure 1).
Baseline characteristics (Table 1)
Baseline Clinical Characteristics of the Study Patients
| Characteristics | SIM (n = 337) | EZ-SIM (n = 564) | ATOR (n = 1510) | P |
|---|---|---|---|---|
| Age (y) | 67.3 ± 11.5 | 65.4 ± 10.9a | 66.2 ± 11.0 | .047 |
| Age ≥75 years | 101 (30.0) | 120 (21.3)a | 373 (24.7) | .014 |
| Sex | .870 | |||
| Male | 192 (57.0) | 312 (55.3) | 838 (55.5) | |
| Female | 145 (43.0) | 252 (44.7) | 672 (44.5) | |
| Previous MI | 8 (2.4) | 15 (2.7) | 27 (1.8) | .425 |
| Previous cerebral vascular accident | ||||
| Anyc | 104 (30.9) | 130 (23.0)a | 344 (22.8)a | .006 |
| Ischemic | 81 (24.0) | 104 (18.4) | 254 (16.8)a | .008 |
| Hemorrhage | 10 (3.0) | 15 (2.7) | 38 (2.5) | .893 |
| Unspecified | 48 (14.2) | 57 (10.1) | 152 (10.1) | .071 |
| Comorbidity | ||||
| Neuropathy | 64 (19.0) | 91 (16.1) | 155 (10.3)a,b | <.001 |
| Retinopathy | 17 (5.0) | 32 (5.7) | 63 (4.2) | .328 |
| CAD | 47 (13.9) | 68 (12.1) | 170 (11.3) | .377 |
| Chronic kidney disease | 13 (3.9) | 15 (2.7) | 40 (2.6) | .464 |
| Chronic obstructive pulmonary disease | 49 (14.5) | 57 (10.1) | 168 (11.1) | .114 |
| AF | 22 (6.5) | 16 (2.8)a | 110 (7.3)b | .001 |
| Peripheral arterial disease | 37 (11.0) | 46 (8.2) | 84 (5.6)a | .001 |
| Hypertension | 304 (90.2) | 478 (84.8) | 1283 (85.0)a | .036 |
| Heart failure | 26 (7.7) | 26 (4.6) | 102 (6.8) | .116 |
| Malignancy | 13 (3.9) | 23 (4.1) | 68 (4.5) | .828 |
| Cirrhosis | 5 (1.5) | 0 (0.0)a | 13 (0.9) | .031 |
| Previous PCI | 2 (0.6) | 4 (0.7) | 16 (1.1) | .607 |
| Previous carotid stenting | 0 (0.0) | 0 (0.0) | 2 (0.1) | .550 |
Values are the mean ± SD or n (%). PCI, percutaneous coronary intervention.
P < .05 vs SIM.
P < .05 vs EZ-SIM.
One patient might have 2 or more strokes.
The EZ-SIM group was younger (65.4 ± 10.9 y old) and had a lower proportion of patients more than 75 years old (21.3%) and lower prevalence of previous CVA (23%), atrial fibrillation (AF) (2.8%), and cirrhosis (0%) compared with the SIM group. The ATOR group had lower prevalence of previous CVA (22.8%), previous IS (16.8%), neuropathy (10.3%), peripheral arterial disease (5.6%), and hypertension (85.0%) compared with the SIM group. In addition, the prevalence of neuropathy was lower and that of AF was higher in the ATOR group than in the EZ-SIM group.
Based on the summary of nonstudy medications (Supplemental Table 2), the EZ-SIM group had higher prevalence of dipeptidyl peptidase-4 (DPP-4) use (14.2%) but less use of warfarin (2.3%), β-blockers (23.2%), and calcium channel blockers (44.7%) use than those of SIM group. On the other hand, the ATOR group yielded higher prevalence of DPP-4 (7.3%) and aspirin (79.7%) use than the SIM group. Moreover, the prevalence of clopidogrel (32.5%), β-blockers (22.5%), diuretics (16.7%), and fibrate (3.0%) use in the ATOR group were lower than those in the SIM group. Compared with the EZ-SIM group, the use of DPP-4, the ATOR group had higher use of clopidogrel, angiotensin-converting enzyme inhibitor or angiotensin receptor blockers (59.5%), and fibrate, but lower use of sulfonylureas (50.1%), warfarin (6.2%), and calcium channel blocker (51.9%).
Primary outcomes
The correlation between residuals (against the study group) and ranked survival time was −0.10 (P = .146) for IS, 0.12 (P = .102) for death from any cause, 0.06 (P = .756) for MI, and 0.02 (P = .646) for composite endpoint, suggesting that the proportional hazard assumptions were not violated. After adjustments for all of the variables in the multivariate Cox models, during the overall follow-up period, recurrent IS was most common in the SIM group (16.9%), followed by the EZ-SIM (9.2%) and ATOR (7.5%) groups (Table 2). The results here showed that the risk of recurrent IS in the SIM group was higher than that in the ATOR (hazard ratio [HR], 2.03; 95% confidence interval [CI], 1.46–2.82) and EZ-SIM (HR, 1.69; 95% CI, 1.14–2.50) groups, but was not different between the EZ-SIM and ATOR groups (HR, 1.20; 95% CI, 0.85–1.69).
Primary Outcomes in Various Follow-Up Periods
| Outcome | Number of Event (%) | Adjusted Hazard Ratio and 95% CI | |||||||
|---|---|---|---|---|---|---|---|---|---|
| SIM vs ATOR | EZ-SIM vs ATOR | SIM vs EZ-SIM | |||||||
| SIM (n = 337) | EZ-SIM (n = 564) | ATOR (n = 1510) | HR (95% CI) | P | HR (95% CI) | P | HR (95% CI) | P | |
| 3-month follow-up | |||||||||
| IS | 15 (4.5) | 16 (2.8) | 43 (2.8) | 1.35 (0.73–2.49) | .332 | 0.84 (0.46–1.55) | .576 | 1.61 (0.77–3.36) | .204 |
| Death from any cause | 9 (2.7) | 7 (1.2) | 14 (0.9) | 3.14 (1.28–7.74) | .013 | 1.99 (0.76–5.22) | .162 | 1.58 (0.56–4.49) | .391 |
| MI | 0 (0.0) | 3 (0.5) | 0 (0.0) | NA | NA | NA | NA | NA | NA |
| Composite endpointa | 25 (7.4) | 25 (4.4) | 60 (4.0) | 1.62 (1.01–2.63) | .051 | 1.05 (0.65–1.72) | .836 | 1.54 (0.87–2.74) | .139 |
| 1-year follow-up | |||||||||
| IS | 42 (12.5) | 42 (7.4) | 92 (6.1) | 1.91 (1.31–2.79) | .001 | 1.16 (0.80–1.70) | .439 | 1.64 (1.06–2.56) | .028 |
| Death from any cause | 26 (7.7) | 20 (3.5) | 75 (5.0) | 1.56 (0.98–2.48) | .060 | 0.88 (0.53–1.46) | .616 | 1.78 (0.98–3.24) | .060 |
| MI | 3 (0.9) | 6 (1.1) | 8 (0.5) | 1.47 (0.36–5.93) | .593 | 2.10 (0.66–6.71) | .211 | 0.70 (0.16–3.02) | .630 |
| Composite endpointa | 67 (19.9) | 64 (11.3) | 173 (11.5) | 1.64 (1.23–2.20) | .001 | 1.04 (0.77–1.40) | .808 | 1.59 (1.11–2.26) | .011 |
| Overall follow-up | |||||||||
| IS | 57 (16.9) | 52 (9.2) | 114 (7.5) | 2.03 (1.46–2.82) | <.001 | 1.20 (0.85–1.69) | .296 | 1.69 (1.14–2.50) | .008 |
| Death from any cause | 41 (12.2) | 35 (6.2) | 124 (8.2) | 1.26 (0.87–1.81) | .225 | 0.81 (0.55–1.20) | .297 | 1.54 (0.97–2.46) | .067 |
| MI | 7 (2.1) | 6 (1.1) | 16 (1.1) | 1.71 (0.68–4.31) | .259 | 0.96 (0.36–2.58) | .942 | 1.77 (0.58–5.44) | .320 |
| Composite endpointa | 95 (28.2) | 87 (15.4) | 243 (16.1) | 1.55 (1.22–1.99) | <.001 | 1.00 (0.77–1.28) | .978 | 1.56 (1.16–2.11) | .004 |
The HRs were adjusted for all covariates listed in Table 1 and Supplemental Table 2. NA, not applicable.
Any one of IS, HS, cardiovascular death, or MI.
The incidence of composite endpoint was also highest in the SIM group (28.2%), followed by the ATOR (16.1%) and EZ-SIM (15.4%) groups. Exposure in the SIM group was associated with higher risks than in the ATOR (HR, 1.55; 95% CI, 1.22–1.99) and EZ-SIM (HR, 1.56; 95% CI, 1.16–2.11) groups but was not different between the EZ-SIM and ATOR groups (HR, 1.00; 95% CI, 0.77–1.28).
During the 1-year follow-up, the risk of IS and composite endpoints were also noted when comparing the SIM group with the ATOR group (IS: HR, 1.91; 95% CI, 1.31–2.79 and composite endpoint: HR, 1.64; 95% CI, 1.23–2.20) and the SIM group to the EZ-SIM group (IS: HR, 1.64; 95% CI, 1.06–2.56 and composite endpoint: HR, 1.59; 95% CI, 1.11–2.26). Both the unadjusted Kaplan-Meier survival curves (Figure 2A) and multivariate adjusted survival curves (Figure 2B) showed lower trends of recurrent IS in the EZ-SIM and ATOR groups compared with SIM group.
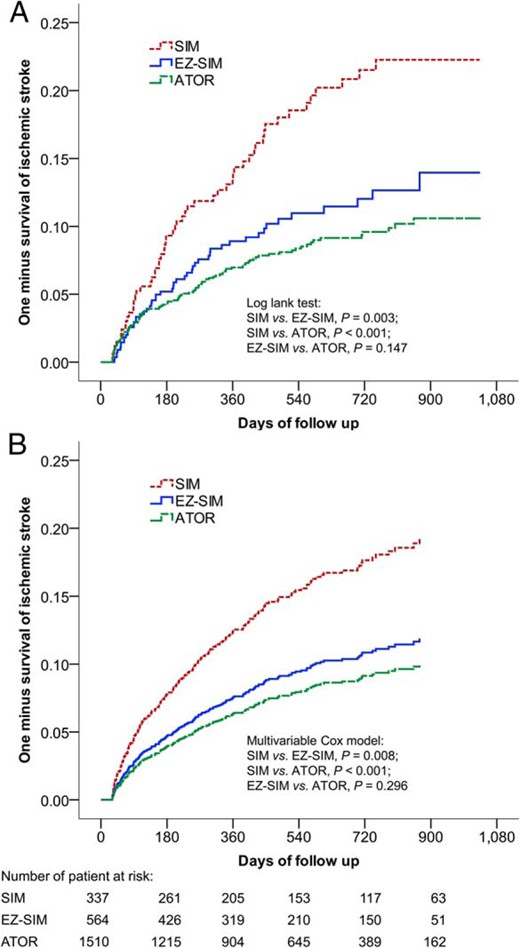
The unadjusted Kaplan-Meier survival curves (A) and multivariate adjusted survival curves (B) estimated the time to recurrent IS.
Both the incidence rates of recurrent IS were significantly lower in the EZ-SIM and ATOR groups compared with the SIM group.
Secondary outcomes (Table 3)
Secondary Outcomes During the Overall Follow-Up Period
| Outcome | Number of Event (%) | Adjusted HR and 95% CI | |||||||
|---|---|---|---|---|---|---|---|---|---|
| SIM vs ATOR | EZ-SIM vs ATOR | SIM vs EZ-SIM | |||||||
| SIM (n = 337) | EZ-SIM (n = 564) | ATOR (n = 1510) | HR (95% CI) | P | HR (95% CI) | P | HR (95% CI) | P | |
| Heart failure | 5 (1.5) | 6 (1.1) | 19 (1.3) | 0.98 (0.35–2.76) | .970 | 0.66 (0.23–1.90) | .444 | 1.48 (0.41–5.28) | .549 |
| Cardiovascular death | 14 (4.2) | 14 (2.5) | 45 (3.0) | 1.25 (0.67–2.34) | .476 | 0.94 (0.50–1.74) | .837 | 1.34 (0.62–2.88) | .456 |
| HS | 5 (1.5) | 2 (0.4) | 16 (1.1) | 0.95 (0.32–2.85) | .925 | 0.34 (0.07–1.50) | .153 | 2.84 (0.52–15.60) | .231 |
| Rhabdomyolysis | 0 (0.0) | 0 (0.0) | 0 (0.0) | NA | NA | NA | NA | NA | NA |
| Malignant neoplasm | 7 (2.1) | 6 (1.1) | 24 (1.6) | 1.11 (0.46–2.68) | .813 | 0.75 (0.30–1.88) | .536 | 1.49 (0.48–4.60) | .492 |
The HRs were adjusted for all covariates listed in Table 1 and Supplemental Table 2. NA, not applicable.
Anyone of IS, HS, cardiovascular death, or MI.
The events and risks of each secondary endpoint were not significantly different among the 3 groups.
Discussion
This nationwide, population-based study demonstrates that the EZ-SIM group has a similar incidence of recurrent stroke compared with the ATOR group but has a lower incidence compared with the SIM group after adjusting for possible covariates. The magnitude of C-reactive protein reduction of ezetimibe-simvastatin is similar to the equivalent-dose atorvastatin, but the clinical outcome comparison between the 2 drugs remains unknown (28). Our result corroborates the value of ezetimibe-simvastatin LLT on secondary stroke prevention in type 2 DM patients, and is consistent with the hypothesis that high-potency LLT are important for reducing the recurrence of IS in DM patients regardless of whether EZ-SIM combination therapy or ATOR is used. This finding enhanced evidence for the secondary prevention of stroke (29).
There is only limited data on the use of statin and none on the effects of ezetimibe-simvastatin combination therapy on the secondary prevention of stroke (11, 12, 29). Ezetimibe reduces the absorption of cholesterol from the intestine and cause extra LDL-C reduction when added to statin (30). Previous studies have shown that ezetimibe either used alone or with statin decreases secretory phospholipase A2 activity and possibly regress carotid or coronary plaque burdens (31–33). Clinical comparisons between ezetimibe-simvastatin and simvastatin in patients with ACS have been conducted in the IMPROVE-IT study. However, benefits on stroke prevention of ezetimibe added to statin in patients with ACS, chronic kidney diseases, and aortic stenosis were inconclusive (8, 34, 35). Unlike in the IMPROVE-IT study, MI and cardiovascular death are not significant between the SIM and EZ-SIM groups in our study. Two reasons may explain the discrepancy. One, the current study has a shorter follow-up period. In IMPROVE-IT study, the difference in cardiovascular event rates between the 2 groups is mainly noted during the late follow-up period (8). Two, the studies have different enrolled populations. Patients with IS may have higher risks of recurrent IS but lower risks of cardiovascular disease than patients with ACS (36).
Only few previous data from the SPARCL trial, the Heart Protection Study, the Long-Term Intervention with Pravastatin in Ischaemic Disease study, and the Cholesterol And Recurrent Events trial have explored the use of statin on the prevention of secondary stroke (11, 12, 29). Of them, moderate-intensity statins, including 40-mg simvastatin and pravastatin, do not show significant effects on reducing stroke recurrence (4). High-intensity statin with 80-mg atorvastatin in the SPARCL trial has promising effects on stroke secondary prevention compared with placebo (4, 11) but left a query on the risks of HS in those with previous HS (17). When compared with moderate intensity statins, 80-mg atorvastatin is associated with inconclusive stroke reduction than 10-mg atorvastatin and SIM in the Treating to New Targets and the Incremental Decrease in End Points Through Aggressive Lipid Lowering trials (37, 38). However, Stroke patients are not the main study population and only account for 5% and 8% in 80-mg atorvastatin groups of these trials. Compared with 80-mg atorvastatin, ATOR is also categorized as high-intensity statin, but its clinical effect is not comprehensively studied. The current study supports that ATOR also have benefits on stroke reduction when compared with moderate-intensity statin in diabetic IS patients. Moreover, the distribution of HS history and the incidence of HS are not significantly different among the 3 groups. This may suggest that HS may not be increased in ATOR therapy.
This study may have limitations. First, coding errors may occur on the diagnoses and make the results unreliable. Nonetheless, incorrect coding is rare because validation is performed. Furthermore, the principal diagnoses in hospitalization for stroke and MI patient enrollment is used instead of clinical visit. This help to reduce bias resulted from equivocal stroke diagnosis with vague symptoms in clinical visits. Second, the laboratory data and personal information, such as lipid profiles or alcohol consumption, are not recorded in the NHIRD and may be important confounders. Instead, alternative covariates like chronic kidney disease, CAD, and controlled antidiabetic medications are used for the severity of DM in the multivariate Cox regression model. Besides, the baseline lipid profile and the levels of LDL-C are not known. The actual effects of LLT are uncertain and the patients could only be assumed to have theoretically therapeutic effects based on literatures. Third, the baseline nonstudy statin prescribed before stroke may interfere with the results. A wash-out period was designed and patients who had ever taken other known lipid-lowering agent were excluded. Drug adherence of enrolled subjects was also controlled. Fourth, the follow-up period could be relatively short and the participants might be relatively few. These may influence the validity of our results, especially for the outcome of MI. Lastly, this is an observational trial and causal effect should be carefully interpreted. Besides, it remains unclear whether these findings are applicable to other ethnicities or patients without type 2 DM. Nevertheless, the real-world research includes variables that are important in real life but are strictly controlled in randomized controlled trials. Despite these disadvantages, our real-world nationwide data remains valuable for answering uncertain questions and guiding experimental studies. We wish this could help to improve the lower target-achieved rate in IS patients in the future (9, 10).
Conclusions
This study shows that both the ATOR and EZ-SIM provide better secondary IS prevention than SIM alone for diabetic IS patients without increased incidence of HS. High-potency LLT is helpful for reducing the recurrence of IS in DM patients, regardless of whether ATOR alone or EZ-SIM combination therapy is used.
Acknowledgments
We thank Alfred Hsing-Fen Lin for the statistical assistance.
Disclosure Summary: The authors have nothing to disclose.
C.-H.L. and T.-H.C. contributed equally to this work.
Abbreviations
- ACS
acute coronary syndrome
- AF
atrial fibrillation
- ASCVD
atherosclerotic cardiovascular disease
- ATOR
40-mg atorvastatin
- CAD
coronary artery disease
- CI
confidence interval
- CVA
cerebrovascular accident
- DM
diabetes mellitus
- DPP-4
dipeptidyl peptidase-4
- EZ-SIM
10-mg ezetimibe-20-mg simvastatin
- HR
hazard ratio
- HS
hemorrhagic stroke
- IMPROVE-IT
IMProved Reduction of Outcomes: VYTORIN Efficacy International Trial
- IS
ischemic stroke
- LDL-C
low-density lipoprotein cholesterol
- LLT
lipid-lowering therapy
- MI
myocardial infarction
- NHI
National Health Insurance
- NHIRD
NHI Research Database
- SPARCL
Stroke Prevention by Aggressive Reduction in Cholesterol Levels trial.
