


The identification of modifiable factors at prepregnancy or early pregnancy as well as continued monitoring and management of these factors before and during pregnancy may reduce the incidence of diabetes mellitus (DM) among women, regardless of gestational diabetes mellitus (GDM) status.
This study aimed to identify prepregnancy factors for the development of DM in women with or without GDM in their first pregnancy.
This retrospective, observational, cohort study included data for 53 109 women who underwent a National Health Screening Examination through the National Health Insurance Corporation between 2002 and 2003 and had their first delivery in 2004 with follow-up until 2012.
The main outcome of the study was the risk of developing DM after 8 years in women with and without GDM during their first pregnancy.
The cumulative risks of developing DM after 8 years were 8.4% and 3.3% in women with and without GDM during their first pregnancy, respectively. Old age, a family history of DM, obesity, a high fasting glucose level, and high total cholesterol level were associated with DM development in women without GDM. In women with GDM, a family history of DM, prepregnancy obesity, a high fasting glucose level, and a high total cholesterol level were associated with DM. When stratified by GDM status and the number of prepregnancy risk factors, the number of prepregnancy risk factors was associated with the risk of DM in women with or without GDM. Women with GDM had a higher risk of DM for the same number of prepregnancy risk factors than women without GDM.
The results show that GDM may be a marker for development of DM in the future because it shares the same risk factors with DM development. Thus, eliminating other risk factors in women with GDM may lead to a reduction in the risk of DM.
GDM is a marker for future DM, as it shares risk factors with DM. Thus, eliminating other risk factors among women with GDM may reduce the risk of future DM.
Gestational diabetes mellitus (GDM) is defined as any degree of glucose intolerance with onset or first recognition occurring during pregnancy (1). The prevalence of GDM is 2.4%–22.3% worldwide (1–3). In addition, the global prevalence of diabetes mellitus (DM) is increasing (1, 4, 5).
GDM is a well-known risk factor for the development of DM later in life (6–15). Women with a history of GDM have a 7-fold higher risk of developing DM than women with normal glucose tolerance during pregnancy (6). Therefore, it is recommended that women with GDM undergo a glucose tolerance assessment 6–12 weeks after delivery (16, 17). However, the rates of postpartum glucose screening are suboptimal, at 20%–64% (8, 14, 18, 19). Therefore, the identification of modifiable factors at prepregnancy or early pregnancy as well as continued monitoring and management of these factors before and during pregnancy may reduce the incidence of DM among women with GDM.
The US Centers for Disease Control and Prevention recently predicted a 3-fold increase in the prevalence of DM in the United States between 2005 and 2050 (20). Therefore, targeted screening of high-risk populations is recommended (21). Although screening for DM is suggested to be cost effective when initiated at 30–45 years of age with screening repeated every 3–5 years (22), the American Diabetes Association recommends broader screening criteria, ie, targeting everyone aged 45 years or older as well as overweight adults of any age who have additional risk factors (21). However, based on the American Diabetes Association recommendations, screening for DM does not routinely occur during reproductive years. Nevertheless, pregnancy is an important screening opportunity for cardiovascular and metabolic disease risk factors, potentially allowing early intervention (23). It is not well understood whether women without GDM but with other risk factors for DM also have an increased risk of DM after their index delivery. In addition, there is no consensus whether women with a high risk of DM but without GDM should continue to be monitored after delivery. Therefore, there is an untapped opportunity to promote health and disease prevention in pregnant women at a high risk of DM.
This retrospective observational study aimed to estimate the risk of DM among reproductive-aged women with or without GDM after an index pregnancy with a follow-up of approximately a decade. We determined the predictors for DM in women without GDM and the similarity to predictors among women with GDM. Furthermore, we investigated whether we could identify the subgroup of women without GDM but at a high risk of DM after their index pregnancy.
Materials and Methods
Health care delivery system in Korea
In 2000, the health insurance systems in South Korea merged into a single system run by the National Health Insurance Service (NHIS). Consequently, most people living in South Korea are insured by the NHIS.
This retrospective observational cohort analysis used data from the Korea National Health Insurance (KNHI) Claims Database for 2002–2012. In Korea, 97% of the population is obligated to enroll in the KNHI program; the remaining 3% is covered by the Medical Aid Program. Therefore, the KNHI claims database contains information on all claims for approximately 50 million Koreans, and nearly all information about the extent of a disease can be obtained from this centralized database with the exception of procedures not covered by insurance, such as cosmetic surgery.
As part of the NHIS health care system, all insurance subscribers and dependents are invited to participate in a biannual National Health Screening Examination (NHSE) free of charge.
This study was approved by the Institutional Review Boards of the Korea University Medical Center.
Study population
A flowchart of patient enrollment is shown in Figure 1. Using the NHIS database, we identified all women who had their first delivery between January 1, 2004, and December 31, 2004. To facilitate the evaluation of the prepregnancy characteristics, women were included in the analysis if they underwent an NHSE during the 1–2 years before their first delivery between January 1, 2002, and December 31, 2003. The mean time between the medical assessment by an NHSE and time to delivery was 1.65 ± 0.39 years.
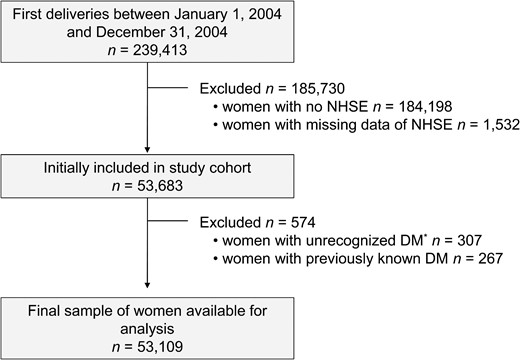
Flowchart of the enrollment of NHSE participants.
*, Newly diagnosed DM when a fasting glucose level ≥126 mg/dL at NHSE, after excluding patients with previously known DM.
Women with GDM during their first pregnancy were identified by principal or secondary diagnosis based on a search for International Classification of Disease, 10th revision codes O24.4 and O24.9. Women were classified as having DM if they were newly diagnosed with DM (International Classification of Disease, 10th revision, code E11) between January 1, 2005, and December 31, 2012, had received a new hypoglycemic medication prescription, and had four or more ambulatory care visits during the study period (24, 25). The timing of the initial diagnosis was confirmed by the lack of a medical claim for DM as a primary or secondary disease between January 1, 2002, and December 31, 2003 (24, 25), and the absence of a history of DM.
Measurement of prepregnancy characteristics
Prepregnancy factors were evaluated using the NHSE data. The NHSE consists of a health interview and health examination.
The health interview included questions regarding demographic, socioeconomic, and lifestyle status. Data for the following covariates were obtained: age, smoking status, exercise level, and a family history of DM. Smoking status was classified as current smoker, past smoker, or never-smoker based on the answers to the following question: “have you ever been a smoker?” and “if yes, do you smoke currently?” Exercise was categorized according to the weekly frequency of full-body, sweat-inducing exercise: no exercise or one to two, three to four, or five or more exercise sessions per week. Participants were asked whether any of their immediate family members (mother, father, sisters, and brothers) had DM. Participants were classified as having a family history of DM if they reported that any immediate family members had DM.
The health examination included the calculation of body mass index (BMI) (kilograms per square meter) using height and weight measurements. Obesity was defined as a BMI of 25 kg/m2 or greater, which was adopted from cutoffs established for Korean adults as proposed by the Korean Society for the Study of Obesity (26). Blood pressure (BP) was measured using a standard mercury sphygmomanometer. Hypertension (HTN) was defined as systolic/diastolic BP of 140/90 mm Hg or greater or the current use of antihypertensive medication. Blood samples were obtained after a fast of at least 8 hours. The levels of fasting glucose and total cholesterol (TC) were measured using a Hitachi 747 autoanalyzer (Hitachi Instruments Inc) and enzymatic methods.
Women who were diagnosed with unrecognized DM based on a fasting glucose level of 126 mg/dL or greater at the NHSE with no history of DM were excluded.
Fasting glucose levels were divided into quartiles (Qs): Q1, less than 78 mg/dL; Q2, 78–85 mg/dL; Q3, 85–92 mg/dL; and Q4, 92–126 mg/dL. A glucose level within Q4 was considered high. Fasting glucose was analyzed as a binary variable, ie, high fasting glucose (Q4) vs normal fasting glucose (Q1-Q3) (fasting glucose ≥ 92 vs < 92 mg/dL). High TC level was defined as TC of 200 mg/dL or greater.
Statistical analysis
Continuous and categorical variables are expressed as mean ± SD and percentages, respectively. Clinical and biochemical characteristics were compared among groups using a one-way ANOVA with the Bonferroni multiple comparison test for post hoc testing for continuous variables and the χ2 test for categorical variables. The cumulative incidence of DM was estimated using the Kaplan-Meier method and compared using the log-rank test. Cox proportional hazards models were used to estimate the adjusted hazard ratios (HRs) and 95% confidence interval (CIs) for the development of DM. Participants were censored if they developed DM or on December 31, 2012, in those without DM. Multicollinearity was examined using the variance inflation factor. A variance inflation factor 10 or greater is regarded as indicating serious multicollinearity. All tests were two sided, and values of P < .05 were considered statistically significant. Statistical analysis was performed using SPSS version 18 (IBM Corp).
Results
GDM occurred in 2962 of the study participants (5.6%). After 8 years of follow-up, the cumulative incidences of DM were 8.4% and 3.3% in women with and without GDM, respectively.
Characteristics of participants with respect to GDM status and development of DM
The mean time between the medical assessment by an NHSE and time to delivery was 1.65 ± 0.39 years.
The demographic and clinical characteristics of the included participants stratified by GDM status and development of DM are presented in Table 1. There were statistically significant differences between the four groups in age, a family history of DM, HTN, BMI, BP, fasting glucose levels, and TC levels. However, smoking status and exercise level did not differ significantly among the four groups. The distribution and numbers of prepregnancy risk factors also differed among the four groups, with the highest prevalences in women with GDM who developed DM. Post hoc analyses were subsequently performed to compare the groups. BMI, systolic BP, and fasting glucose levels were significantly higher in women who developed DM than in women who did not develop DM, regardless of GDM status. Women with GDM who developed DM had the highest diastolic BP and fasting glucose levels. Compared with the women with GDM who did not develop DM, women without GDM who developed DM more commonly had a family history of DM as well as higher BMI, systolic BP, and fasting glucose levels. The prevalences of obesity, high fasting glucose levels, and high TC levels were higher in women with no GDM who developed DM than in women with GDM who did not develop DM.
Demographic and Clinical Characteristics of Participants According to GDM Status and Development of DM
| Women Without GDM | Women With GDM | P Value* | |||
|---|---|---|---|---|---|
| No DM (n = 48 505) | DM (n = 1642) | No DM (n = 2713) | DM (n = 249) | ||
| Age, y | 28.6 ± 3.0a | 29.4 ± 3.6b | 29.8 ± 3.3c | 30.0 ± 3.6c | <.01 |
| Family history of DM, % | 8.2a | 12.6b | 10.0c | 18.5d | <.01 |
| Smoking status, % | .06 | ||||
| Never | 95.7 | 94.9 | 96.6 | 96.3 | |
| Past | 2.3 | 2.9 | 2.3 | 1.2 | |
| Current | 1.9 | 2.2 | 1.2 | 2.5 | |
| Exercise level, % | .12 | ||||
| None | 73.8 | 72.3 | 74.2 | 73.2 | |
| 1–2 times/wk | 18.8 | 18.8 | 19.2 | 20.9 | |
| 3–4 times/wk | 5.5 | 6.6 | 5.3 | 3.3 | |
| ≥5 times/wk | 2.0 | 2.3 | 1.3 | 2.5 | |
| BMI, kg/m2 | 20.6 ± 2.5a | 21.7 ± 3.4b | 20.8 ± 2.6a | 22.5 ± 3.8b | <.01 |
| Systolic BP, mm Hg | 111.2 ± 11.5a | 112.6 ± 12.4b | 111.1 ± 11.6a | 115.3 ± 14.7b | <.01 |
| Diastolic BP, mm Hg | 70.4 ± 8.9a | 71.3 ± 9.4b | 70.5 ± 9.0ab | 72.80 ± 10.3c | <.01 |
| Fasting glucose, mg/dL | 84.3 ± 10.7a | 86.5 ± 11.7b | 84.2 ± 11.2a | 90.0 ± 13.3c | <.01 |
| TC, mg/dL | 175.6 ± 39.8a | 180.7 ± 35.0b | 178.6 ± 41.8ab | 182.3 ± 34.9b | <.01 |
| Old age, % | 3.6a | 7.6b | 7.7b | 10.8b | <.01 |
| Obesity, % | 5.6a | 15.0b | 6.7a | 22.9c | <.01 |
| HTN, % | 4.1a | 5.6b | 4.3ab | 10.0c | <.01 |
| High fasting glucose, % | 23.7a | 31.1b | 24.1a | 40.2c | <.01 |
| High TC, % | 19.7a | 26.1b | 22.1c | 33.3d | <.01 |
| Risk factors, % | <.01 | ||||
| 0 | 51.2 | 39.6 | 46.8 | 23.7 | |
| 1 | 35.5 | 33.1 | 35.6 | 37.8 | |
| 2 | 10.9 | 19.1 | 13.9 | 22.9 | |
| 3 | 2.1 | 5.9 | 3.2 | 11.2 | |
| 4 | 0.3 | 2.2 | 0.5 | 4.4 | |
Old age was defined as age 35 years or older; obesity was defined as a BMI of 25 kg/m2 or greater; HTN was defined as systolic/diastolic BP of 140/90 mm Hg or greater or current use of antihypertensive medication; high fasting glucose was defined as a fasting glucose of 92 mg/dL or greater; high TC was defined as a TC of 200 mg/dL or greater. Results are presented as mean ± SD or n (percentage). Letters indicate significant differences between groups according to the Bonferroni multiple comparison test.
P value calculated using a one-way ANOVA (continuous data) or χ2 tests (categorical data).
Risk of DM with respect to GDM status and the presence of prepregnancy risk factors
The cumulative incidence of DM stratified according to GDM status and the presence of prepregnancy risk factors is presented in Figure 2. The incidence of DM was highest in women with both GDM and one of six prepregnancy factors including old age, family history of DM, obesity, HTN, high fasting glucose levels, and high TC levels. The cumulative incidence of DM in women with GDM alone did not differ significantly from that in women with obesity alone (P = .11, log rank test). Otherwise, the cumulative incidence of DM in women with GDM alone was higher than in women with any other risk factor alone. The cumulative incidence of DM in women with either GDM or prepregnancy risk factors was significantly higher than that in women with neither GDM nor prepregnancy factors (P < .05, log rank test).

Cumulative incidence of DM according to GDM status and old age (A), a family history of DM (B), prepregnancy obesity (C), HTN (D), high fasting glucose (E), and high TC (F).
Cox proportional hazards models were created to estimate the adjusted HRs and 95% CIs for developing DM with respect to GDM status and the presence of prepregnancy risk factors (Table 2). Women with GDM were 2.46 times more likely to develop DM than women without GDM. Old age, a family history of DM, prepregnancy obesity, HTN, high glucose levels, and high TC levels were also independently associated with DM. In women without GDM, old age, a family history of DM, obesity, high fasting glucose levels, and high TC levels were associated with DM, with the highest HR in women with obesity (HR 2.54, 95% CI 2.21–2.91). In women with GDM, a family history of DM, prepregnancy obesity, high fasting glucose levels, and high TC levels were associated with DM, with the highest HR in women with obesity (HR 3.05, 95% CI 2.24–4.16). The variance inflation factors were less than 2 for all variables. Therefore, no modification to the model was necessary for multicollinearity.
Cox Multivariate Regression Model for the Risk of DM Based on GDM Status
| All Women | Women Without GDM | Women With GDM | |
|---|---|---|---|
| HR (95% CI)a | HR (95% CI)a | HR (95% CI)a | |
| GDM in first pregnancy | 2.46 (2.15, 2.82) | ||
| Old age | 1.72 (1.46, 2.04) | 1.91 (1.59, 2.29) | 1.14 (0.76, 1.71) |
| Family history of DM | 1.57 (1.37, 1.79) | 1.52 (1.32, 1.76) | 1.77 (1.29, 2.44) |
| Obesity | 2.62 (2.30, 2.97) | 2.54 (2.21, 2.91) | 3.05 (2.24, 4.16) |
| HTN | 1.23 (1.02, 1.49) | 1.14 (0.92, 1.41) | 1.68 (1.10, 2.57) |
| High fasting glucose | 1.44 (1.31, 1.59) | 1.37 (1.25, 1.53) | 1.91 (1.48, 2.47) |
| High TC | 1.27 (1.15, 1.41) | 1.24 (1.11, 1.39) | 1.47 (1.12, 1.92) |
Old age was defined as age 35 years or older; obesity was defined as a BMI of 25 kg/m2 or greater; HTN was defined as systolic/diastolic BP of 140/90 mm Hg or greater or current use of antihypertensive medication; high fasting glucose was defined as a fasting glucose of 92 mg/dL or greater; high TC was defined as a TC of 200 mg/dL or greater.
Model is adjusted for the variables in the table.
Risk of DM with respect to GDM status and the number of prepregnancy risk factors
The cumulative incidence of DM stratified according to GDM status and the number of prepregnancy risk factors is presented in Figure 3. The incidence of DM was highest in women with both GDM and four or more prepregnancy risk factors. The cumulative incidence of DM in women with GDM alone did not differ significantly from that in women with only two prepregnancy risk factors (P = .11, log rank test).
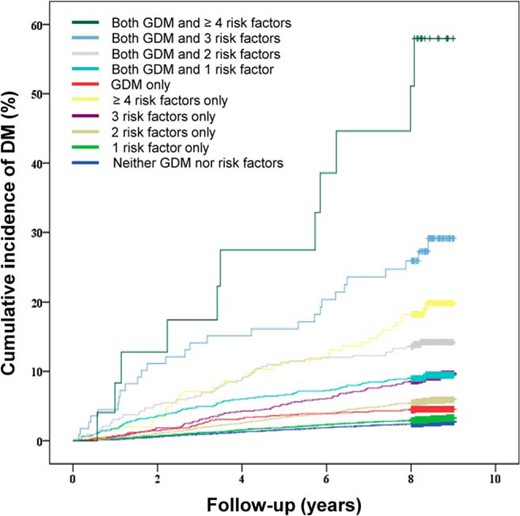
Cumulative incidence of DM according to GDM status and the number of prepregnancy risk factors.
Cox proportional hazards models were used to estimate the adjusted HRs and 95% CIs for developing DM according to GDM status and the number of prepregnancy risk factors (Table 3). In women with or without GDM, the number of prepregnancy risk factors was associated with the risk of DM development. Women with GDM had a higher risk of DM for the same number of prepregnancy risk factors than women without GDM.
Cox Multivariate Regression Model for the Risk of DM
| Women Without GDM | Women With GDM | |
|---|---|---|
| HR (95% CI) | HR (95% CI) | |
| Risk factors, n | ||
| 0 | 1 | 1 |
| 1 | 1.20 (1.07, 1.35) | 2.05 (1.48, 2.84) |
| 2 | 2.22 (1.94, 2.54) | 3.10 (2.15, 4.46) |
| 3 | 3.52 (2.84, 4.36) | 6.14 (3.92, 9.63) |
| ≥4 | 7.39 (5.29, 10.34) | 11.89 (6.24, 22.63) |
Discussion
This study evaluated the role of prepregnancy factors in the development of DM after the first pregnancy. In addition to GDM, old age, family history of DM, prepregnancy obesity, HTN, high glucose, and high TC levels were significant risk factors for the development of DM; these are well-recognized and common risk factors for DM (7, 8, 13, 27, 28). Moreover, women with a combination of any one of these factors with GDM had a higher risk of DM development than women with either GDM or a prepregnancy risk factor or women with no GDM or prepregnancy risk factors. In addition, the number of prepregnancy risk factors was associated with the risk of DM development.
The results are concordant with previous studies reporting that women with a combination of prepregnancy factors including obesity and high fasting glucose levels who have GDM before pregnancy or early in their pregnancy have the highest risk of developing DM (7, 27).
The prevalence of GDM has recently increased worldwide (1, 4, 5) and is expected to increase further after the adoption of new International Association of Diabetes and Pregnancy Study Groups recommendations with lower glucose diagnostic thresholds (29). An increase in GDM diagnoses may stress an already overburdened health care system (29). However, postpartum glucose screening among women with GDM has been suboptimal (8, 14, 18, 19), and our efforts are best directed toward groups with a higher risk of developing DM. Therefore, prepregnancy factors in particular, which are also risk factors for GDM, can be used to identify individuals at higher risk of developing both GDM and DM. Detection during prepregnancy evaluations or early pregnancy allows the monitoring and management of these factors, ideally decreasing the incidence of GDM and DM.
By investigating prepregnancy characteristics, the present study also identified a subgroup of women without GDM at high risk of DM after their first pregnancy. Furthermore, the number of prepregnancy risk factors was associated with the risk of DM. Women with two risk factors but no GDM had a similar incidence of DM as women with GDM only. DM has a heterogeneous etiology, and GDM is only one risk factor. Moreover, when used alone, GDM is a poor predictor of DM (30). Increased medical attention and care during pregnancy represent an opportunity for health care providers to implement more comprehensive educational, lifestyle, and disease-specific screening initiatives (30). Moreover, the absolute number of women who develop DM among women without GDM is greater than that of women who develop DM among women with GDM. Therefore, although monitoring of women who develop GDM during pregnancy may be of clinical utility, it is important and efficacious to monitor and manage those who do not develop GDM during pregnancy but have high risk factors for DM during their prepregnancy evaluation to reduce the risk of developing DM.
This study compared the prepregnancy characteristics between women with GDM who did not develop DM and women without GDM who developed DM. There were differences in the prepregnancy factors between these two groups. Compared with women with GDM who did not develop DM, women without GDM who developed DM more commonly had a family history of DM as well as higher BMI, systolic BP, and fasting glucose levels, all well-known and important risk factors for DM (28, 29). Interestingly, the prepregnancy factors that were associated with developing DM did not differ between women with GDM or without GDM who did not develop DM. These results suggest prepregnancy factors are important in women with or without GDM for predicting DM after their index pregnancy.
In this study, the cumulative incidence of DM among women with GDM was lower than that reported in the literature (8–15). Although the reason for this discrepancy is unclear, there are several possible explanations. GDM is defined as any degree of glucose intolerance with onset or first recognition during pregnancy (1). Therefore, the lower cumulative incidence of DM may be attributable to the exclusion of women with unrecognized DM (n = 307) according to prepregnancy fasting glucose levels in the present study; these women are highly likely to be diagnosed with GDM during pregnancy and subsequently develop DM. The lower incidence of DM may also be related with the follow-up duration, which affects the rate of conversion from GDM to DM (7). However, because the cumulative incidence of DM increases markedly in the first 5 years after delivery and appears to plateau after 10 years (7), the 8-year follow-up in the present study may not have contributed to the low cumulative incidence of DM. The study design might also have contributed to the discrepancy in DM incidence. For example, Lee et al (9) reported that the risk of developing diabetes was 3.5 times greater for Korean women with GDM than for the general Korean population during a median 2.1 year of follow-up. However, all women with GDM were followed up to 6 weeks and underwent a 2-hour, 75-g oral glucose tolerance test (9). Otherwise, this study was a retrospective observational design. As, in general, postpartum screening rates have been suboptimal (8, 14, 18, 19), the lower rate of testing of DM at postpartum period may have contributed to the lower incidence of DM in women with GDM observed in this study.
Several limitations should be considered when interpreting the present findings. First, the GDM and DM diagnoses were based on insurance claims data from the KNHI Claims Database, which was designed for cost claim issues and not research purposes. Therefore, the main limitation is the validity of the diagnoses in this database. Kim (31), with the Korean Diabetes Association, obtained samples from patients diagnosed with DM from the KNHI Claims Database, investigated their medical records and found that the proportions of hospitalized and ambulatory care patients who were verified as patients with diabetes were 87.2% and 72.3%, respectively. Given the questionable validity of the diagnoses, studies using administrative databases such as the KNHI Claims Database should limit subjects to patients who have used outpatient services at least twice (32). In the present study, only patients with four or more ambulatory care visits during the study period were included. Thus, the validity of the diagnoses might be of less concern. Another limitation of our study includes its retrospective observational design. As with all observational studies, we recognize the potential for ascertainment bias in relation to the observed increased risk of DM because it is conceivable that testing for DM might have been undertaken more frequently in women with GDM or other risk factors. In addition, no development of DM in women without DM may be caused by low rate of testing for DM in this group. However, although the diagnosis of DM in this population could be collected with almost zero losses, unfortunately, the information whether testing for DM was undertaken were not available in this study. Therefore, in case of no diagnosis of DM, it is difficult to figure whether testing for DM was absent or testing result for DM was negative. In this study, the incidence of DM among women without GDM was 3.3%. Because the prevalence of DM among adults 30–44 years of age in 2005–2012 ranged from 2.0% to 2.8% according to the Korea National Health and Nutrition Examination Survey studies (33), the influence by testing seems minimal. Further studies with prospective design are needed to investigate evaluate these associations.
In addition, we were unable to access information regarding pregnancy, such as gestational weight gain and laboratory test results, all of which are factors related with developing DM. However, the prepregnancy factors for DM in addition to GDM were investigated. Moreover, several studies have reported that prepregnancy to postpregnancy changes in body weight, BMI, waist circumference, physical activity, and diet do not differ between women with and without GDM in pregnancy (34).
The strength of the present study lies in the large population-based cohort, which had almost no patients lost to follow-up. Moreover, to minimize the effect of parity, we enrolled only women who delivered their first child during the same period.
Conclusion
GDM may be a marker for development of DM in the future because it shares the same risk factors (BMI, systolic BP, elevated fasting blood glucose) with DM. On the other hand, the cumulative incidence of type 2 DM in women with GDM alone did not differ significantly from that in women with only two prepregnancy risk factors. Thus, eliminating other risk factors in women with GDM may lead to a reduction in the risk of future DM.
Acknowledgments
This work was supported by Grant NRF-2012R1A1A1044719 from the National Research Foundation of Korea supported by the Korean Government.
Disclosure Summary: The authors have nothing to disclose.
Abbreviations
- BMI
body mass index
- BP
blood pressure
- CI
confidence interval
- DM
diabetes mellitus
- GDM
gestational diabetes mellitus
- HR
hazard ratio
- HTN
hypertension
- KNHI
Korea National Health Insurance
- NHIS
National Health Insurance Service
- NHSE
National Health Screening Examination
- Q
quartile
- TC
total cholesterol.
