


Atherosclerotic vascular disease begins in childhood and while progression is multifactorial, obesity in early life is an important risk factor for its development.
To determine whether fasting apoB48 remnant lipoproteins (relative to classic lipid markers), is elevated with increasing central adiposity over time in a cohort of Canadian children with a family history of obesity.
Data were drawn from the ongoing prospective cohort of 630 Caucasian families in Québec, Canada, recruited to assess determinants and effects of childhood obesity (Québec Adiposity and Lifestyle Investigation in Youth [QUALITY]cohort).
Children who attended baseline and first followup clinic visits (n =570; age 9.6 y).
Trunk fat mass was determined by dual energy x-ray absorptiometry. Central fat mass index was calculated as CFMI = trunk fat mass/height2 (kg/m2) and groups created (CFMI <1.5; 1.5–3.0; ≥3.0 kg/m2) to suggest lower, moderate, or higher central adiposity. Changes over time in outcomes (apoB48, triglyceride and total, low-, and high-density lipoprotein cholesterol) were compared using paired t test and multiple regression that adjusted for age, sex, and Tanner stage.
Classic lipid markers (total and low-density lipoprotein cholesterol) improved at followup, whereas apoB48 became worse (increased). ApoB48 increased with increasing central adiposity, highest (37%) in children who transitioned from lower- to moderate-CFMI groups (ΔapoB48 = 1.5 μg/mL). For every 1 kg/m2 increase in central adiposity over the 2-y period, an increase in apoB48 was 14-fold greater among children with lower baseline CFMI, compared with higher CFMI.
Increased fasting concentrations of apoB48 may be representative of changes in adiposity at lower levels of central fat (early periods of risk).
Intestinal apolipoprotein-B48 remnants were strongly associated with increasing adiposity in children. Remnant lipoproteins could be an early marker for identifying subclinical CVD risk in children.
The relationship between classic dyslipidemias in adults, such as elevated fasting triglyceride (TG) and low-density lipoprotein cholesterol (LDL-C), or decreased high-density lipoprotein cholesterol (HDL-C), with the occurrence of cardiovascular disease (CVD) is well established. However an increase in the residual risk of CVD has emerged despite major improvements in controlling these risk factors, suggesting alterative (and significant) contributors to the development and progression of CVD. Interestingly, recent studies (1) have established that high plasma concentrations of nonfasting remnant cholesterol from apoB-containing lipoproteins are causally associated with both CVD and all-cause mortality (1). Studies from Benn et al (2) have demonstrated that nonfasting remnant cholesterol has a greater association with coronary heart disease (CHD) than other classic lipid indices. Nonfasting remnant cholesterol has been proposed to include both liver- and intestinal- derived lipoproteins such as VLDL-, LDL-, and apoB48-containing chylomicron remnants. It is well known that impaired remnant metabolism resulting from postprandial dyslipidemia can exacerbate the deposition of plaque cholesterol and contribute directly to the progression of atherogenesis (3, 4). In addition, it has been demonstrated that both fasting and nonfasting apoB48 remnant lipoproteins are elevated in CVD, insulin resistance, and type 2 diabetes mellitus (4–6).
Elegant studies from Xiao et al (7) revealed that impaired metabolism of intestinally-derived chylomicron remnants occurs not only as a result of reduced clearance during the postprandial phase, but also overproduction of apoB48 lipoproteins by the gut. These studies highlight the effect of the intestine on whole-body lipid homeostasis and its potential to exacerbate dyslipidemia. The importance of the gut in cholesterol metabolism has been amplified in the findings of the long-awaited IMPROVE-IT trial, which has shown that the addition of an inhibitor of intestinal cholesterol absorption (ezetimibe) to statin treatment reduced cardiovascular events to a greater extent than statins alone (8). We interpret that, the IMPROVE-IT trial is the first of its kind and underscores the capacity of remnant cholesterol to contribute to atherosclerosis and the potential role of the intestine in cholesterol homeostasis.
Although evidence for a role of intestinally derived remnant lipoproteins in atherosclerosis is quite convincing in adults, studies providing direct evidence are not available in children. It has been proposed previously that impairment to chylomicron metabolism in early life (for example, during chronic overnutrition and obesity), may contribute to the development of subclinical CVD (6). Indeed, classic liver-derived lipid markers, including total cholesterol (TC) and LDL-C, are often normal in obese children (9) and are also expected to improve during puberty (10). However, although apoB48 has been positively correlated with classic lipids, plasma concentrations are elevated in obese prepubertal children vs their normal-weight peers (9). We propose here that physiological adaptations by the intestine to accommodate increased nutrient absorption during times of growth and overnutrition, such as increased length and enterocyte number, may precede aberrations in adiposity, insulin sensitivity and liver-derived lipid markers. The purpose of this study was to provide proof-in-principal that fasting apoB48 maybe a useful marker in the context of pediatric obesity. Further, as direct measures of atherosclerotic disease were not performed in this cohort, we propose that increased fasting apoB48 will contribute to subclinical CVD risk in youth.
Consequently, the objective of this study was to determine whether the change in apoB48 (vs classic lipid markers) in children at risk for obesity corresponds with increasing central adiposity and to assess whether the relationship varies by central adiposity status. We hypothesized that increases in apoB48 would be more strongly associated with increases in central fat mass over time compared with classic lipid biomarkers (independent of LDL-cholesterol), and thus potentially a more useful biomarker of early CVD subclinical risk in this population.
Materials and Methods
Study population
The Québec Adiposity and Lifestyle Investigation in Youth (QUALITY) is an ongoing prospective cohort of 630 Caucasian families in the Province of Québec, Canada recruited to assess the biological, genetic, behavioral, psychosocial, and environmental determinants of obesity and cardiometabolic risk factors in children and their evolution from childhood to adulthood (11).
Eligible families comprised a child age 8–10 years at cohort inception and biological parents, at least one of whom was obese (body mass index [BMI] ≥30 kg/m2 and/or waist circumference ≥102 cm in men, and ≥88 cm in women). Children were excluded if they had type 1 or 2 diabetes, had any serious illness that precluded participation in some or all of the study measurements, were taking antihypertensive medication or steroids, were on a very restrictive diet (<600 kcal/d), or had serious psychological or cognitive problems. Families were recruited through schools in the greater Montreal, Sherbrooke, or Québec City, Canada metropolitan areas between 2005 and 2008 (11).
Procedures
In 2005–2008, 630 children underwent comprehensive examinations during the first study visit at the Clinical Research Units of either the Centre Hospitalier Universitaire (CHU) Sainte-Justine (Montreal, Canada) or Institut Universitaire de Cardiologie et de Pneumologie de Québec (Québec City, Canada). In 2007–2011, 570 (89%) children underwent the first follow-up study visit. All children provided assent, and their parents provided signed informed consent. QUALITY protocols have received approval from the Institutional Ethics Review Board at the CHU Sainte-Justine and Laval University, and are available online at www.etudequalitystudy.ca. The Institutional Ethics Review Board at the University of Alberta and CHU Sainte-Justine approved the current study.
Measures
Adiposity
Fat mass was determined with dual energy x-ray absorptiometry (DXA, Prodigy Bone Densitometer System, DF+14664, GE Lunar Corporation) (12). Measurements were taken with the child in the supine position on the scanning table, beginning at the top of the head and moving in a rectilinear pattern down the body to the feet. None of the participants required sedation.
Percentage measures of total and central fat were computed as (total fat mass/total mass) × 100 ([kg/kg] × 100) and (trunk fat mass/total mass) × 100 ([kg/kg] × 100), respectively (12). Indices of fat mass (FMI = fat mass/height2 [kg/m2]) and central fat mass (CFMI = trunk fat mass/height2 [kg/m2]) were estimated to account for differences in height (13).
Anthropometry
Anthropometric measurements were taken with the child dressed in light indoor clothing without shoes, using a stadiometer for height (measured at maximal inspiration), an electronic scale for weight, a standard tape measure for waist circumference (measured mid-distance between the last floating rib and iliac crest at the end of normal expiration). Measurements were performed according to standardized protocols (14–16) in duplicate or triplicate and the two closest measures were used if the first two measurements differed by more than 0.2 (cm for height or waist circumference; kg for weight). BMI was computed as weight/height2 (kg/m2). BMI percentiles and z scores were calculated according to 2000 U.S. Center for Disease Control and Prevention (CDC) growth chart reference values (17). A child was categorized as being normal weight if her/his BMI was less than the 85th percentile, overweight if greater than 85th and less than 95th percentile, and obese if BMI at least 95th percentile.
Biochemical measures
Blood was obtained by venipuncture, after an overnight fast and 30 minutes of bed rest, in 1g/L EDTA collection tubes kept on ice until centrifugation. Plasma was separated on site within 20 minutes of collection, centrifuged, aliquotted, frozen on dry ice, and stored at −80οC.
ApoB48 concentration in plasma samples was measured at the University of Alberta with a highly sensitive chromogenic sandwich ELISA method (18), using kits from a single lot as per the manufacturer's instructions (Shibayagi Co., Ltd.). Briefly, plasma samples were incubated in monoconoal antibody–coated wells to capture apoB48, then bound with anti-apoB48 antibody. Subsequent steps resulted in a color change proportional to the amount of apoB48 in the sample and absorbance was measured spectrophotometrically.
All other biochemical analyses were performed in a batch at a single accredited site (CHU Sainte-Justine Clinical Biochemistry laboratory) that participates in international quality control programs and is accredited by the Canadian Reference Laboratory (1996) (19). Insulin was measured using an ultrasensitive Access Immunoassay System (Beckman Coulter), glucose by the glucose oxidase method, and lipids—TG, TC, and HDL-C concentrations—were determined enzymatically on a Synchron LX20 (Beckman Coulter) with Beckman Instruments reagents. LDL-C concentrations were calculated according to the Friedewald equation. Non-HDL cholesterol concentrations were obtained by subtracting HDL-C from TC concentrations.
Pubertal stage
Pubertal maturation was assessed by trained nurses, who assigned a Tanner stage according to pubic hair development in boys, and breast and pubic hair development in girls (20, 21).
Statistical analyses
Changes over time in participant characteristics (demographics, sexual maturation, adiposity, lipids, and apoB48) were estimated using paired t tests. Children were categorized into three central adiposity groupings based on 1.5 and 3 kg/m2 CFMI cutoffs at baseline and 1.916 and 3.77 kg/m2 at followup, to approximate the BMI percentile cutoffs for overweight and obese (22) and to maintain the equivalent distribution of participants in the three categories at both data points (n = 222, 173, and 144). Changes in classic lipid markers vs apoB48 over time were classified according to changes in central adiposity groupings (lower-lower; moderate-moderate, higher-higher; lower-moderate; moderate-higher; moderate-lower; higher-moderate) using paired t tests. Two children who changed from higher to lower CFMI grouping were excluded from analyses of changes in classic lipid markers vs apoB48 over time across CFMI groupings (Figure 1); and there were no children who changed from lower to higher grouping. Last, the association of changes in CFMI over time as a continuous variable with changes in classic lipid markers vs apoB48 was estimated in multivariate regression models that included child's age, sex, Tanner stage, and baseline CFMI. Analyses were then stratified according to CFMI groupings at baseline. Separate models were fitted to the data for each outcome measure. Models with apoB48 as an outcome were also adjusted for LDL-C. Statistical analyses were performed with Stata 11 software (StataCorp). Analyses were based on n = 539 children, who had complete data on apoB48 and CFMI at both baseline and 2-year follow-up visits.
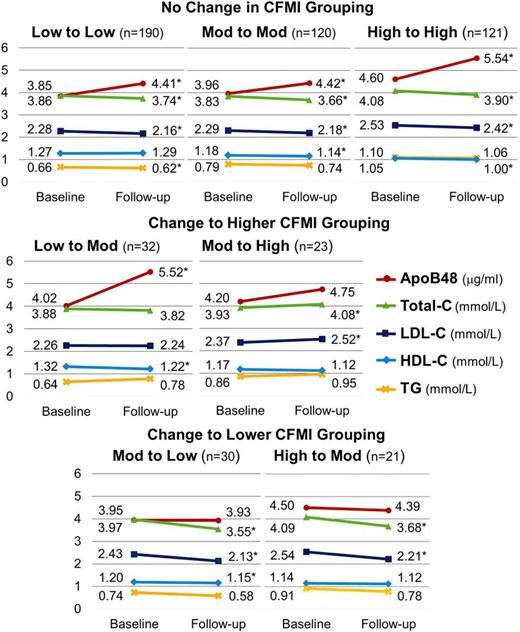
Plasma concentrations of apoB48 and classic lipid markers according to change in CFMI groupings at baseline and 2-year follow-up visit.
CFMI cutoffs at baseline are 1.5 and 3 kg/m2 and at followup are 1.916 and 3.77 kg/m2. Two children who changed from higher to lower CFMI grouping were excluded from analyses of changes in classic lipid markers vs apoB48 over time across CFMI groupings. *, Significant change (P < .05 based on paired t test).
Results
At baseline, children were 9.6 (0.9) years old, 45% were girls, and 21% were in Tanner stage greater than I (9% boys and 39% girls) (Table 1). Total fat mass accounted for 26% (10.7 kg) of total mass, and central fat mass constituted 11% (5.7 kg) of total mass. At the 2-year followup, these proportions increased to 28.6% (10.9 kg) and 12.5% (5.7 kg), respectively. After 2 years, 67% of study participants were in Tanner stage greater than I. Consistent with this, HOMA-IR increased over the 2-year period from 1.01 to 1.48. All classic lipid markers decreased, with TG from 0.81 to 0.77 mmol/L, TC from 3.92 to 3.76 mmol/L and LDL-C from 2.36 to 2.24 mmol/L, showing decreases of approximately 5%. Conversely, HDL-C and apoB48 worsened over time, with HDL-C decreasing by approximately 2% and apoB48 increasing by 13% (Table 1).
Characteristics of Study Participants (n = 539)
| Characteristic | Baseline | Followup | P-Value |
|---|---|---|---|
| Demographics and maturation | |||
| Age, y | 9.6 (0.9) | 11.7 (0.9) | <.0001 |
| Girls, n (%) | 243 (45.1) | 243 (45.1) | — |
| Tanner stage > I, n (%) | 113 (21.0) | 364 (67.5) | <.0001 |
| Anthropometrics | |||
| Overweight or obese,a n (%) | 226 (41.9) | 218 (40.4) | <.0001 |
| BMI, kg/m2 | 19.4 (4.2) | 21.2 (4.9) | <.0001 |
| Waist circumference, cm | 67.3 (11.8) | 72.6 (13.2) | <.0001 |
| Adiposity from DXA | |||
| Total fat, % | 26.3 (10.7) | 28.6 (10.9) | <.0001 |
| Central fat, % | 11.1 (5.7) | 12.5 (5.7) | <.0001 |
| Total fat mass index, kg/m2 | 5.4 (3.4) | 6.4 (3.8) | <.0001 |
| Central fat mass index, kg/m2 | 2.3 (1.7) | 2.9 (1.9) | <.0001 |
| Central to total fat ratio | 40.6 (5.5) | 42.5 (4.9) | <.0001 |
| Plasma lipids | |||
| ApoB48, μg/mL | 4.09 (2.09) | 4.72 (2.68) | <.0001 |
| TG, mmol/L | 0.81 (0.41) | 0.77 (0.43) | .0172 |
| Total cholesterol, mmol/L | 3.92 (0.71) | 3.76 (0.66) | <.0001 |
| LDL | 2.36 (0.58) | 2.24 (0.57) | <.0001 |
| HDL | 1.19 (0.25) | 1.17 (0.25) | .0037 |
| Non-HDL | 2.73 (0.68) | 2.60 (0.63) | <.0001 |
| Insulin resistance/inflammatory markers | |||
| Insulin, pmol/L | 32.63 (21.14) | 46.59 (30.54) | <.0001 |
| Glucose, mmol/L | 4.95 (0.36) | 5.05 (0.36) | <.0001 |
| HOMA-IR | 1.01 (0.68) | 1.48 (1.05) | <.0001 |
| C-reactive protein, mg/L | 1.79 (3.04) | 1.87 (3.98) | .6787 |
Values are mean (SD) unless otherwise indicated as n (%).
P-value determined by paired t test.
BMI ≥85th percentile value according to 2000 U.S. CDC growth charts.
ApoB48 increased with increasing central adiposity (Figure 1). Among children who transitioned from lower to moderate levels of central adiposity, apoB48 increased by 37% (ΔapoB48 = 1.5 μg/mL). ApoB48 also increased, but to a lesser extent in children who maintained lower, moderate, or higher CFMI over time (15, 12, and 20%; δ apoB48 = 0.56, 0.46, and 0.94 μg/mL, respectively). Children whose central adiposity declined during the 2-year followup showed small improvements in apoB48; apoB48 improved from 3.95 to 3.93, and 4.50 to 4.39 μg/mL for children who transitioned from moderate to lower and higher to moderate levels of central adiposity, respectively. Conversely, worsening of classic lipid markers, specifically TC and LDL-C, was observed only among children who transitioned from moderate to higher levels of central adiposity, with improvements in lipids for all other central adiposity groupings. Overall, changes in classic lipid markers were less consistent with gains in central adiposity over time.
Multiple regression models (Table 2) show that apoB48 was associated with greater changes in central adiposity over the 2-year period than classic lipid markers (B = 0.36 vs 0.11, 0.15, 0.14, and −0.03), with the largest differences in the magnitude of these associations among children who maintained lower levels of central adiposity over time. Thus, for every 1 kg/m2 increase in central adiposity, the increase in apoB48 was almost 14-fold greater among children with lower baseline CFMI compared with higher CFMI at baseline (B = 1.23, 0.38, 0.09 for lower, moderate, and higher baseline CFMI). For classic lipid markers, the magnitude of difference in change over time across central adiposity groupings was either weaker or nonexistent. For TG, a 1 kg/m2 increase in CFMI among children with lower baseline CFMI was associated with a 2-fold greater increase in the respective marker, compared with children with higher baseline CFMI. There was no difference in the magnitude of association between gains in central adiposity and TC and LDL-C across baseline CFMI groupings. Additional adjustments for diet (calories and percentage of calories from macronutrients) or physical activity did not change these findings.
| Total (n = 539) | Lower (n = 222) | Moderate (n = 173) | Higher (n = 144) | |||||||||
|---|---|---|---|---|---|---|---|---|---|---|---|---|
| Coeff | SE | P | Coeff | SE | P | Coeff | SE | P | Coeff | SE | P | |
| ApoB48 | 0.36 | 0.15 | .015 | 1.23 | 0.38 | .001 | 0.38 | 0.23 | .102 | 0.09 | 0.24 | .709 |
| TG | 0.11 | 0.02 | <.0001 | 0.19 | 0.05 | <.0001 | 0.12 | 0.03 | <.0001 | 0.10 | 0.03 | .004 |
| TC | 0.15 | 0.03 | <.0001 | 0.13 | 0.07 | .062 | 0.17 | 0.05 | .001 | 0.15 | 0.04 | <.0001 |
| LDL-C | 0.14 | 0.02 | <.0001 | 0.13 | 0.06 | .028 | 0.14 | 0.04 | .001 | 0.12 | 0.04 | .001 |
| HDL-C | −0.03 | 0.01 | .002 | −0.08 | 0.03 | .01 | −0.01 | 0.02 | .434 | −0.02 | 0.01 | .202 |
Abbreviation: Coeff, coefficient.
All coefficient and SE values are in mmol/L, except ApoB48 in μg/mL.
Estimated mean change associated with CFMI change over time from multiple regression models adjusted for age, sex, baseline value of the respective lipid marker, and baseline and change in Tanner stage between two visits. Models for ApoB are also adjusted for LDL cholesterol.
Central adiposity groupings at baseline are based on CFMI cutoffs at baseline are 1.5 and 3 kg/m2.
| Total (n = 539) | Lower (n = 222) | Moderate (n = 173) | Higher (n = 144) | |||||||||
|---|---|---|---|---|---|---|---|---|---|---|---|---|
| Coeff | SE | P | Coeff | SE | P | Coeff | SE | P | Coeff | SE | P | |
| ApoB48 | 0.36 | 0.15 | .015 | 1.23 | 0.38 | .001 | 0.38 | 0.23 | .102 | 0.09 | 0.24 | .709 |
| TG | 0.11 | 0.02 | <.0001 | 0.19 | 0.05 | <.0001 | 0.12 | 0.03 | <.0001 | 0.10 | 0.03 | .004 |
| TC | 0.15 | 0.03 | <.0001 | 0.13 | 0.07 | .062 | 0.17 | 0.05 | .001 | 0.15 | 0.04 | <.0001 |
| LDL-C | 0.14 | 0.02 | <.0001 | 0.13 | 0.06 | .028 | 0.14 | 0.04 | .001 | 0.12 | 0.04 | .001 |
| HDL-C | −0.03 | 0.01 | .002 | −0.08 | 0.03 | .01 | −0.01 | 0.02 | .434 | −0.02 | 0.01 | .202 |
Abbreviation: Coeff, coefficient.
All coefficient and SE values are in mmol/L, except ApoB48 in μg/mL.
Estimated mean change associated with CFMI change over time from multiple regression models adjusted for age, sex, baseline value of the respective lipid marker, and baseline and change in Tanner stage between two visits. Models for ApoB are also adjusted for LDL cholesterol.
Central adiposity groupings at baseline are based on CFMI cutoffs at baseline are 1.5 and 3 kg/m2.
Discussion
Increases in fasting ApoB48 correspond with increases in central adiposity over time
In this study, we observed that increases in fasting apoB48 concentration were associated with increased central adiposity (as measured by CFMI), whereas other classic lipid parameters were not. Interestingly, apoB48 worsened (increased) to the greatest extent in children who transitioned from lower to moderate levels of central adiposity. This relationship was not evident for classic lipid markers, suggesting that these parameters may be somewhat limiting in detection of subclinical risk in youth. Collectively, these findings suggest that apoB48 is associated with increases in adiposity in overweight and obese children and may be a useful indicator of subclinical CVD risk.
It has been hypothesized (6, 9) that early overnutrition leads to adaptations of the intestine, such as increases in intestinal length and surface area (23), to accommodate a greater absorption capacity and secretion of lipids. We further suggest that an increased absorption of lipids in these children will correspond with an acute increase in the number of apoB48 lipoproteins and in turn, an increase in fasting apoB48 concentration. It is also noteworthy that increased overproduction of apoB48 particles from the intestine is also not concomitant with elevated TG, especially during the fasted state. The results from this study suggest that changes in the intestine may precede frank dyslipidemia per se, however the specific mechanisms involved require clarification in future studies.
Classic lipid markers vs increases in fasting apoB48
Recent pediatric guidelines recommend that lipid assessment in children should ideally be performed during the prepubertal period (9–11 years of age) and that improvements of up to 10 to 20% in TC and LDL-C are expected during puberty (10). For the QUALITY cohort, in children that experienced increasing BMIs, total and central adiposity over 2 years, total and LDL-C levels improved by less than 10%. By comparison, apoB48 worsened by 15%. Notably, in this study LDL-C and TC improved in all CFMI groupings, even the higher CFMI group. Similar patterns of change were observed when comparisons were made by changes in CFMI grouping.
ApoB48 concentration in overweight children is similar to that found in adult obese subjects
Normative data for apoB48 concentrations in children have not been established. However, previous research suggests that clinically obese children of a similar age to that in the QUALITY cohort had 3-fold higher fasting levels than matched peers with normal BMIs (9). Although the data from the current study did not display such a contrast in apoB48, we wish to highlight that the absolute concentration of apoB48 in obese children is well within the range of adults with CVD risk. Children with the highest adiposity grouping had 20% higher apoB48 concentration at the 2-year followup. Studies in obese adults have reported that fasting apoB48 concentration is consistently 2-fold that of lean participants (24, 24–26). Similarly, it has been shown that the presence of metabolic syndrome can double apoB48 concentration (27). Visceral obesity seems to be an important determinant of apoB48 metabolism (25, 28). Interestingly, there was no relationship between apoB48 and C-reactive protein in the current study, which one might expect given the current understanding of proinflammatory action of visceral adipose depots. We have previously reported that a proinflammatory profile exists in overweight prepubertal children when compared with age-matched lean counterparts (10). It may be possible that the population sampled in this study did not have sufficient children in the lean/healthy range to power for differences in inflammatory status.
Due to variations in assaying techniques used, as well as methodology (eg, fasting vs nonfasting) in the past, comparing ApoB48 values has been challenging. In the current study we used a monoclonal antibody method, which is now being considered more sensitive and reliable than the polyclonal methods used previously (9). It is also important to note that total plasma apoB48 concentration is often more informative, as opposed to triglyceride-rich lipoprotein fractions, because it suggests the presence of all proatherogenic remnants in blood.
Relative risk of CVD in children using classic risk markers and acceptable reference ranges
According to the most recent pediatric guidelines, all lipid markers (on average for the entire cohort (Table 1)), were within acceptable range (TC < 4.40, LDL-C < 2.84, non-HDL-C < 3.10, HDL-C > 1.16, TG 0–9 y < 0.85 10–19 y < 1.02 mmol/L) (10) at baseline and at the follow-up visit. Of note, even the higher CFMI group had acceptable cholesterol levels on average, despite 77% of this group being classified as obese. However, TG was borderline high (1.06 at baseline and 1.04 mmol/L at followup) and HDL-C was borderline low (1.06 at baseline and 1.02 mmol/L at followup) in this group. This was also the case for those children who increased from moderate to higher CFMI, although a significant change in TG and HDL-C was not observed. This combined dyslipidemic pattern is consistent with the high TG/low HDL phenotype expected in obese children (10). Fasting TG and HDL-C have been associated with apoB48 in both adults (29) and children (9), and although these markers are not independent of intestinal lipoprotein metabolism, the results from the current study would suggest that they may not be reflective of sub clinical risk in youth. Indeed, the most recent guidelines for children (10) attempt to compensate for this by including reference ranges for total apoB.
Diet and other lifestyle factors in the QUALITY cohort
Although the QUALITY cohort examined diet and lifestyle factors of the children at baseline, it was not the focus of the current study and adjustments to the data for dietary factors and physical activity level did not alter our findings. Other published studies using this cohort (19) suggest that leisure time computer/video game use was associated with an increased cardiometabolic risk score and waist circumference in boys; while TV viewing was associated with increased cardiometabolic risk, waist circumference, and BMI z score in girls (30). An additional study suggested that higher levels of moderate-to-vigorous intensity physical activity was associated with lower waist circumference, fasting triglyceride, and higher HDL-C (31). In adults, many of the lifestyle factors that improve lipids also seem to reduce apoB48 levels, including moderate weight loss (32), heart-healthy dietary changes (33), and exercise (34). Pediatric-focused investigations are required to now discern the major factors that might regulate the intestine in children, including gut peptides.
Strengths and limitations of the study
The key strengths of this study include the use of a comprehensive set of high-quality longitudinal measurements, including plasma samples, DXA scans, and up to three measurements of height and weight in a relatively large community sample of children. However, the 8–10-year age range of participants, inclusion of children with at least one obese parent, and restriction to Caucasian race may limit the external generalizability of the findings. Although the higher prevalence of obesity in this cohort of children compared with Canadian children 5–11 years old (35), could have implications for a prevalence or incidence study, it is unlikely to affect the ability of adiposity indicators to effect changes in apoB48 and classic lipid markers in children across the adiposity range.
Conclusion and future research
To our knowledge, apoB48 concentrations have not yet been reported in a community-based pediatric population. The data from this longitudinal cohort study suggests that apoB48-containing lipoprotein concentration could be an early marker for identifying children at risk of developing CVD. Clinical application of this work should include increased awareness of the role for remnant lipoproteins in CVD risk and that adiposity in children may render them susceptible for raised concentrations of apoB48. However, more mechanistic data in children and youth is lacking and further investigation is required to delineate the role of apoB48 in the etiology of childhood obesity and atherosclerosis. Indeed, longitudinal normative ranges for apoB48 have not been established in either children or adults; the results from this and other studies seem to support a need for this approach to advance the field (36).
Acknowledgments
The research team thanks all the children and their families who have taken part in this study as well as the technicians, research assistants, and coordinators involved in the QUALITY cohort project. We also appreciate the technical assistance of Dr Flora Wang. Dr Marie Lambert (July 1952–February 2012), pediatric geneticist and researcher, initiated the QUALITY cohort. Her leadership and devotion to QUALITY will always be remembered and appreciated.
This work was supported by an Innovation Grant from the Women & Children's Health Research Institute to K.M. and S.P., and in part by a Grant in Aid from the Heart and Stroke Foundation of Canada (to S.P.). K.M. holds a Career Development Award in Prevention Research funded by the Canadian Cancer Society (Grant No. 702936). J.O.L. holds a CRC in the Early Determinants of Adult Chronic Disease. M.H. holds a Fonds de Recherche en Santé du Québec Junior 1 salary award. The QUALITY cohort is funded by the Canadian Institutes of Health Research (No. OHF-69442, NMD-94067, MOP-97853, MOP-119512), the Heart and Stroke Foundation of Canada (No. PG-040291) and Fonds de la Recherche en Santé du Québec.
Disclosure Summary: The authors have nothing to disclose.
Abbreviations
- BMI
body mass index
- CFMI
central fat mass index
- CHU
Centre Hospitalier Universitaire
- CVD
cardiovascular disease
- DXA
dual energy x-ray absorptiometry
- FMI
fat mass index
- HDL-C
high-density lipoprotein cholesterol
- HOMA-IR
homeostasis model of assessment–insulin resistance
- LDL-C
low-density lipoprotein cholesterol
- QUALITY
Québec Adiposity and Lifestyle Investigation in Youth
- TC
total cholesterol
- TG
triglyceride.
