


Obesity is associated with insulin resistance and other metabolic changes that might be modified by overfeeding diets with different protein levels.
The objective of the study was to determine the effect of overfeeding diets with 5%, 15%, or 25% energy from protein on insulin sensitivity and compartments of body fat in healthy men and women.
Fifteen men and five women were overfed by approximately 40% for 56 days with 5% (low protein), 15% (normal protein), or 25% (high protein) protein diets. Insulin sensitivity was measured using a two-step insulin clamp at baseline and at 8 weeks. Body composition and fat distribution were measured by dual-energy x-ray absorptiometry and multislice computed tomography scan and abdominal sc fat cell size was determined on osmium-fixed fat cells.
This was an in-patient metabolic ward study.
Insulin sensitivity and free fatty acids during low and high levels of insulin infusion before and after 8 weeks after overfeeding and changes in body fat distribution from computed tomography were measured.
Total body fat mass, fat-free mass (FFM), visceral adipose tissue (VAT), and deep sc fat all increased with overfeeding. FFM and intrahepatic lipid increased more on the high protein diet, whereas percentage BF and fasting free fatty acids (FFAs) increased more on the low protein diet. Baseline fat cell size predicted the increase in VAT and the magnitude of FFA suppression during the high-dose insulin clamp. Acute release of insulin at baseline predicted the increase in deep sc fat but not VAT. Fasting insulin and glucose increased with overfeeding, but glucose disposal as measured by the clamp was not changed. Suppression of FFAs was less complete during the high-dose insulin infusion after overfeeding.
Eight weeks of overfeeding, which increased fat mass including expansion of visceral and deep sc tissues and intrahepatic lipid, increased fasting insulin and glucose, impaired the suppression of FFA but did not produce whole-body insulin resistance.
Overfeeding increased glucose and insulin and inhibited insulin suppression of FFA. Baseline fat cell size predicted VAT increase and insulin sensitivity. The LPD decreased intrahepatic lipid and increased percentage of body fat.
Obesity is a major public health problem (1, 2) and is a precursor to insulin resistance (3, 4). Beginning with the novel experiments of Sims et al (5, 6), which demonstrated that long-term overfeeding increased fasting insulin and impaired glucose tolerance overfeeding, has been used as a strategy to examine mechanisms for the adverse metabolic effects of weight gain and obesity. Impaired insulin sensitivity has been reported to be an untoward effect of overfeeding interventions (7–14), with effects observed in as little as 3 days (10, 15–17). Insulin resistance during overfeeding is more readily demonstrated in individuals with a low birth weight than normal birth weight (18) and in postsurgical bariatric patients (19). Insulin resistance during overfeeding occurs when individuals consume either high-fat or high-carbohydrate meals (7, 8), but the pattern of changes in metabolic markers differed with the type of diet. The effect of overeating dietary protein through effects on adaptive thermogenesis was thought to be protective against weight gain, and we conducted the first protein overfeeding randomized controlled trial to learn that whereas fat mass gain is similar for overfeeding diets, regardless of protein, the gain in fat free mass was related to protein, not energy. Thus, important questions about the genesis of insulin resistance with overfeeding and the effects of dietary protein still remain unanswered.
The Protein Overfeeding study examined the effects of three levels of dietary protein (5%, 15%, 25%) on the development of insulin resistance and changes in key metabolic precursors including changes in sc fat cell size and adipose tissue compartments during 8 weeks of overfeeding (20, 21), and we report the results of these measurements in this paper.
Materials and Methods
Participants
Twenty healthy men and women between the age of 18 and 35 years with a body mass index (BMI) of 19.7–29.6 kg/m2, who led a sedentary lifestyle (less than 2 h of moderate to vigorous exercise per week) and completed euglycemic hypersinsulinemic clamps at both baseline and week 8 were included in this planned secondary analysis. Participants were informed that they would be randomly assigned to one of three different overfeeding diets, would have to live as in-patients at the Pennington Biomedical Research Center (Baton Rouge, Louisiana) for approximately 12 weeks without leaving, and would be required to eat all the foods and only those foods provided by the metabolic kitchen of the center. All participants signed a consent form approved by the Pennington Biomedical Research Center Institutional Review Board. This trial was registered at clinicaltrials.gov (number NCT00565149).
Protocol
Details of this study were previously described (20, 21). Briefly, this was a randomized, parallel-arm, in-patient study and is depicted in Figure 1. The baseline diet (left insert) can be contrasted with the dietary intake for each group during overfeeding (middle insert). Overfeeding was planned at approximately 40% above energy requirements for weight maintenance or about approximately 1000 kcal/d (4180 kJ/d). Diets contained either 5% (low protein diet [LPD]), 15% (normal protein diet [NPD]) or 25% (high protein diet [HPD]) protein. During the final 24-hour period (shown to the right side of the Figure 1 and labeled baseline diet), the diet was returned to the baseline components. The timing of the two hyperinsulinemic euglycemic clamps and final dual-energy x-ray absorptiometry (DXA) and computed tomography (CT) scan are indicated.
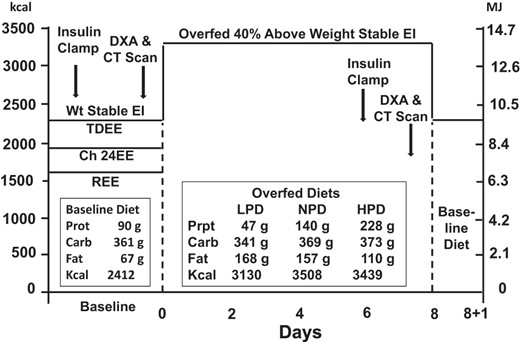
Diagram of the study.
Carb, carbohydrate; CH, Chamber; EE, energy expenditure; EI, energy intake; Prot, protein; TDEE, Total Daily Energy Expenditure; Wt, weight.
The first 13–25 days of the in-patient stay was used to establish energy requirements for weight maintenance and once weight stability was achieved, to perform baseline assessments including a two-step hyperinsulinemic euglycemic clamp, measurements of body composition by DXA and abdominal CT scan, and collection of fat and muscle biopsies.
Diets
All food was prepared by the metabolic kitchen and provided to the participants in a 5-day menu rotation over the entire in-patient stay. All meals were prepared in duplicate and food composites were prepared, frozen, and later analyzed for nutrient composition (20). To assure compliance to the overfeeding diets, all meals were consumed while being supervised by kitchen and in-patient personnel. There were three experimental diets with goals of providing 5% energy from protein, 15% energy from protein, or 25% energy from protein (see Figure 1). Protein intake was actually 90 ± 16 g/d at baseline and 47 ± 4.7, 140 ± 29, and 228 ± 48 g/d in the LPD, NPD, and HPD groups, respectively. In grams per kilogram per day, it was 1.83 ± 0.98 g/kg·d body weight at baseline and 0.68 ± 0.069, 1.80 ± 0.25, and 3.01 ± 0.29 g/kg·d body weight in the LPD, NPD, and HPD groups, respectively, which puts the LPD within the range recommended by the World Health Organization. Absolute intake of carbohydrate (grams per day) was maintained throughout overfeeding, and therefore, the balance of calories was made up by increasing the amount of fat used in each component of the diet. At baseline, carbohydrate provided 50% of calories and 36% of calories in in each of the three overfeeding diets. Fat, as a percentage of calories, was 59% in the LPD, 49% in the NPD, and 39% in the HPD.
Insulin sensitivity and insulin secretion
Acute insulin response to glucose
An abbreviated frequently sampled insulin glucose tolerance test was used to determine the insulin acute insulin response to glucose (AIRg). After an overnight fast, two iv lines were placed and three baseline blood samples drawn. A glucose dose of 300 mg/kg was injected at time 0, followed by collection of blood samples at 1, 3, 4, 5, 6, 7, 8, 10, 12, 14, 16, and 20 minutes. Glucose and insulin concentrations measured in each sample were submitted for calculation of the AIRg using the minimal model method of Pacini and Bergman (22). The minimal model analysis is accomplished using a program developed for a personal computer (MINMOD-Millennium Bergman).
Insulin sensitivity
A two-step hyperinsulinemic euglycemic clamp was performed at baseline and during the last week of overfeeding. As previously described (23), after an overnight 12-hour fast, an iv catheter was introduced into an antecubital vein for infusion of insulin and glucose. A second catheter was placed in a retrograde direction in a dorsal vein of the contralateral hand for blood withdrawal. To assure adequate vasodilatation, the hand was placed in a heating box or pad at 70°C for arterialization of venous blood. A primed low-dose infusion of regular insulin (5 mU/min·m2) (step 1) was initiated and continued for 60 minutes, followed by a high-dose rate of 80 mU/min·m2 (step 2) for an additional 90 minutes, in which the dose of the insulin infusion had been calculated prior to the study for each participant. Plasma glucose was allowed to either decrease to 90 mg/dL or to increase to 90 mg/dL in subjects, depending on their fasting blood glucose levels. Arterialized plasma glucose was measured at the bedside every 5 minutes, and an exogenous 20% glucose solution) was infused at a variable rate to maintain plasma glucose concentration at approximately 90 mg/dL.
The resting metabolic rate (RMR) using a Deltatrac II metabolic monitor (Datex) was measured three times during the clamp procedure: at baseline (before insulin infusion) and during the last 30 minutes of each step of the insulin infusion. Each RMR was 30 minutes and the last 20 minutes were used for analysis of energy expenditure and substrate oxidation. Two blood samples were collected during each RMR period for the determination of plasma insulin, glucose, and free fatty acid (FFA) concentration at −15 and −5 before the insulin infusion during the baseline period and end −15 and −5 for the second and third RMR periods. Patients voided before the test, and urine was collected during and at the end of the clamp to determine urinary nitrogen concentration and glucose loss.
An insulin infusion of 80 mU/min·m2 is expected to result in plasma insulin concentration of approximately 200 mU/mL. Hepatic glucose production was expected to be completely suppressed at this level of insulin, even in diabetic subjects. In this case, peripheral glucose uptake (Rd) should equal the glucose infusion rate during steady state (the last 20 min of each step of the clamp) after a correction for urinary glucose loss; that is, − Rd = steady state glucose infusion rate − urinary glucose loss.
Insulin sensitivity (SI) was calculated using the formula: SI = Rd/(steady state insulin level − basal insulin level), where steady state insulin equals the average insulin concentration during the last 20 minutes of the clamp and basal insulin equals the average insulin level in the 20 minutes before starting the insulin infusion. SI is expressed relative to body mass (milligrams per kilogram per minute) and to metabolic size (milligrams per kilogram fat free mass [FFM] + 17.7/min).
Body composition
DXA scans were performed using a Hologics QDR 4500A whole-body scanner, and scans were analyzed with the version11.1 QDR software for Windows. Repeat analyses in 40 subjects gave coefficients of variation for body composition measurements of lean mass, fat mass, and percentage of body fat of 0.6%, 1.1%, and 1.1%, respectively.
CT measurement of adipose tissue volume
Volunteers were supine on the CT scanner table with the arms extended over their head. For abdominal adiposity, a scout image was acquired to plan the multislice image acquisition. Based on the scout film, eight contiguous images were obtained every 5 cm with five images obtained above and two below a slice centered on L4-L5 intervertebral disk. A 10-mm slice through the vastus lateralis muscle and calf were obtained at 14 kV, and 240 mA was used to measure intermuscular fat according to the method of Kelley et al (24) Adipose tissue cross-sectional area was determined using the Analyze PC software package and visceral, sc-deep, and sc-superficial fat areas were calculated (25). Areas were calculated using a triangulation method.
Adipose tissue biopsy for fat cell size
The skin over the lateral abdomen was cleansed with povidone-iodine solution, and a sterile drape was placed over the site. Topical anesthesia was a 50%–50% mixture of lidocaine and bupivacaine, which was injected before a 1.0-cm incision was made in the skin and a 4- to 6-mm Bergstrom needle inserted to aspirate approximately 500 mg of adipose tissue. A 50-mg sample was placed in osmium tetroxide for the determination of fat cell size. The method used for measuring fat cell size has been previously described (26). Adipose tissue was fixed in a solution containing collidine HCL (0.2 M) and osmium tetroxide (31 mg/mL collidine HCL buffer). Samples are diluted with 154 mM NaCl, filtered over a 10-μm nylon screen, recollected in 10 mL of 154 mM NaCl, and dissociated over 1 week by the addition of 10 mL of 8 M urea in 154 mM NaCl. The sample was filtered through a 250-μm nylon filter into a weighed beaker. The volume was increased to 300 mL with 154 mM NaCl containing 0.1% Triton X-100. The cells were then counted on a Multisizer-3 (Beckman Coulter) using a 400-μm aperture (dynamic linear range 12–320 μm). Adipocyte cell number (cells per milligram of wet weight of tissue) was determined from the amount of sample (milliliters) of the quantity of cells (per milliliters) and the tissue weight (milligrams). Cell size distribution was displayed as cells per 10-μm bin, mean cell size, median cell size, and percentage of cells greater than 100 μm.
Laboratory measurements
Glucose was measured using a glucose oxidase electrode (DXC 600 Pro; Beckman Coulter), and insulin was measured by an immunoassay (Immulite 2000; Siemens). FFAs were measured with a high-sensitivity Wako kit.
Statistical analysis
Protein diets were randomly assigned (20). Baseline data are expressed as mean ± SD and change from baseline as mean ± SE. Effects of treatment on change from baseline on body weight, body composition, and glucose metabolism were evaluated using a simple regression analysis and again after adjusting for age, sex, and baseline covariates. An ANOVA was used to compare treatment effects, and where significant differences existed, post hoc comparisons were done with the Tukey-honestly significant difference test. Sex and age were included as a fixed effects. The α was set at P ≤ .05. Analyses were done with the JMP-7 statistical package (SAS Institute).
Results
Baseline metabolic phenotyping of the subjects
Table 1 presents the baseline data on 15 men and five women who had pre- and postmeasurements of insulin sensitivity during the PROOF study (20). The number in each protein subgroup is shown in Table 2. Body weight and FFM were significantly higher, and the percentage body fat was significantly lower in the men. There were no differences between sexes in total fat mass, visceral fat, deep sc fat, or any measures of glucose or insulin at baseline. In all subjects, baseline glucose was significantly and inversely correlated with total fat mass (r = −0.45; P = .027) and positively correlated with total abdominal adipose tissue (r = 0.39; P = .045) but not with adipose tissue localized to the visceral or deep sc regions of the abdomen or with sc fat cell size. Insulin, homeostatic model assessment index of insulin resistance (HOMA-IR), and the AIRg were all positively and significantly correlated with total fat mass and total abdominal adipose tissue mass, deep sc fat mass, and sc fat cell size but not FFM.
Metabolic Phenotype of the Study Participants at Baseline
| Variable | Baseline | P Value (FvM) | ||
|---|---|---|---|---|
| Pooled (n = 20) | Male (n = 15) | Female (n = 5) | ||
| Age, y | 24.6 ± 3.8 | 24.5 ± 4.2 | 24.8 ± 2.9 | .98 |
| BW, kg | 75.5 ± 14.4 | 80.2 ± 12.9 | 61.2 ± 7.5 | .0063 |
| BMI, kg/m2 | 25.6 ± 5.20 | 26.4 ± 5.59 | 23.0 ± 2.59 | .20 |
| FFM, kg | 58.4 ± 12.7 | 63.7 ± 9.57 | 42.5 ± 5.43 | 0.0002 |
| FM, kg | 17.0 ± 5.2 | 16.5 ± 5.59 | 18.6 ± 3.81 | 0.44 |
| Body fat, % | 22.8 ± 6.7 | 20.2 ± 5.22 | 30.4 ± 4.58 | 0.0011 |
| TAT mass, kg | 6.6 ± 3.0 | 6.65 ± 3.26 | 6.40 ± 2.16 | 0.87 |
| VAT mass, kg | 1.96 ± 1.25 | 2.19 ± 1.34 | 1.28 ± 0.60 | 0.16 |
| DSAT mass, kg | 1.55 ± 1.41 | 1.50 ± 0.39 | 1.47 ± 1.25 | 0.88 |
| Fat cell size, μg | 0.613 ± 0.23 | 0.64 ± 0.25 | 0.54 ± 0.15 | 0.40 |
| Av-liver, HU | 66.2 ± 4.47 | 66.3 ± 5.07 | 66.0 ± 2.19 | 0.88 |
| Av-spleen, HU | 53.8 ± 2.54 | 53.8 ± 2.71 | 53.7 ± 2.26 | 0.91 |
| L to S ratio, HU | 1.23 ± 0.10 | 1.23 0.10 | 1.23 0.09 | 0.96 |
| Fasting glucose, mg/dL | 89.1 ± 6.0 | 88.5 ± 5.7 | 90.9 ± 7.22 | 0.45 |
| Fasting insulin, μU/mL | 10.4 ± 5.86 | 10.61 ± 6.45 | 9.79 ± 4.11 | 0.79 |
| Fasting FFAs, μEq | 0.44 ± 0.12 | 0.43 ± 0.12 | 0.47 ± 0.12 | 0.55 |
| SI step 1, mg/dL · min FFM | 2.04 ± 0.82 | 1.98 ± 0.76 | 2.27 ± 1.04 | .50 |
| SI step 2, mg/dL · min FFM | 8.22 ± 2.58 | 8.01 ± 2.77 | 8.92 ± 1.94 | .50 |
| FFA suppression step 1, % | 56.8 ± 23.9 | 52.7 ± 26.6 | 68.2 ± 7.43 | .22 |
| FFA suppression step 2, % | 98.7 ± 3.7 | 97.3 ± 4.2 | 99.2 ± 1.36 | .33 |
| Fasting RQ, AU | 0.87 ± 0.03 | 0.87 ± 0.03 | 0.87 ± 0.03 | .86 |
| RQ step 2, AU | 0.94 ± 0.06 | 0.94 ± 0.06 | 0.96 ± 0.04 | .39 |
| HOMA-IR, AU | 2.82 ± 1.41 | 2.74 ± 1.37 | 3.09 ± 1.66 | .64 |
| AIRg | 933 ± 574 | 896 ± 571 | 1039 ± 637 | .65 |
Abbreviations: AU, arbitrary unit; Av, Average; FvM, female vs male; HU, Hounsfield unit; L, liver; S, spleen. Data are mean ± SD. Bold values are statistically significant differences at baseline between males and females.
Effect of Eight Weeks of Overfeeding on Abdominal Fat Distribution, Ectopic Lipid, Fat Cell Size, and Parameters of Glucose Metabolism
| Variable | Baseline | Change From Baseline | Effect of Overfeeding | Effect of Diet | |||
|---|---|---|---|---|---|---|---|
| Overall | LPD | NPD | HPD | ||||
| Sex distribution | 5 M/1 F | 6 M/1 F | 5 M/2 F | .0088 (H > L) | |||
| Body weight, kga | 75.5 ± 14.4 | 5.67 ± 0.51 | 3.55 ± 0.72 | 6.26 ± 0.66 | 7.0 ± 0.72 | <0.0001 | |
| FFM, kg | 58.4 ± 12.7 | 2.03 ± 0.45 | −0.32 ± 0.43 | 2.68 ± 0.40 | 3.62 ± 0.43 | <0.0001 | <.0001 (H > L) |
| Fat mass, kg | 17.0 ± 5.2 | 3.61 ± 0.26 | 3.87 ± 0.48 | 3.59 ± 0.44 | 3.37 ± 0.48 | 0.0003 | .76 |
| Percentage fat | 22.8 ± 6.7 | 2.96 ± 0.28 | 4.18 ± 0.44 | 2.72 ± 0.44 | 2.15 ± 0.47 | <0.0001 | .011 (L > H |
| TAT mass, kg | 6.6 ± 3.0 | 1.75 ± 0.12 | 1.94 ± 0.20 | 1.52 ± 0.20 | 1.79 ± 0.20 | <0.0001 | .35 |
| VAT mass, kg | 1.96 ± 1.25 | 0.46 ± 0.06 | 0.53 ± 0.11 | 0.39 ± 0.11 | 0.47 ± 0.11 | <0.0001 | 0.68 |
| DSAT mass, kg | 1.55 ± 1.41 | 0.68 ± 0.11 | 0.74 ± 0.20 | 0.59 ± 0.20 | 0.72 ± 0.20 | <0.0001 | 0.85 |
| Fat cell size, μL | 0.61 ± 0.23 | 0.17 ± 0.043 | 0.28 ± 0.074 | 0.11 ± 0.074 | 0.14 ± 0.07 | 0.0009 | 0.26 |
| Liver fat, HU | 66.2 ± 4.47 | −1.50 ± 1.25 | −6.02 ± 1.67 | 0.17 ± 1.52 | 1.49 ± 1.52 | 0.24 | 0.0045 (H = N > L) |
| Spleen fat, HU | 53.8 ± 2.54 | −7.04 ± 3.75 | −10.1 ± 6.87 | −9.18 ± 6.36 | −1.41 ± 6.87 | 0.77 | 0.62 |
| L to S ratio, AU | 1.23 ± 0.10 | −0.1 ± 0.10 | −0.30 ± 0.19 | −0.14 ± 0.18 | −0.10 ± 0.18 | 0.10 | 0.73 |
| Glucose, mg/dL | 89.1 ± 6.0 | 2.18 ± 1.00 | 3.07 ± 1.84 | 3.43 ± 1.70 | 0.64 ± 1.70 | 0.023 | 0.51 |
| Insulin, μL/mL | 10.4 ± 5.86 | 2.31 ± 0.88 | 3.82 ± 1.63 | 1.24 ± 1.51 | 2.09 ± 1.51 | 0.014 | 0.51 |
| Fasting FFAs, μEq | 0.39 ± 0.11 | −0.37 ± 0.024 | −0.46 ± 0.032 | −0.0.28 ± 0.032 | −0.39 ± 0.032 | 0.07 | 0.0042 (L > N) |
| FFA suppression step 1, % | 56.8 ± 23.9 | 3.26 ± 5.28 | 9.48 ± 8.24 | −10.4 ± 8.73 | −7.63 ± 9.23 | 0.56 | 0.34 |
| FFA suppression step 2, % | 98.7 ± 3.7 | 3.04 ± 1.03 | 1.37 ± 1.63 | 6.01 ± 1.73 | 1.26 ± 1.87 | 0.0082 | 0.47 |
| Fasting RQ, AU | 0.87 ± 0.03 | −0.016 ± 0.008 | −0.03 ± 0.01 | −0.02 ± 0.01 | −0.004 ± 0.01 | 0.049 | 0.45 |
| RQ step 2, AU | 0.94 ± 0.06 | 0.012 ± 0.019 | 0.01 ± 0.003 | −0.02 ± 0.04 | 0.01 ± 0.04 | 0.54 | 0.37 |
| HOMA-IR, AU | 2.82 ± 1.41 | 0.68 ± 0.37 | 0.40 ± 0.70 | 1.04 ± 0.64 | 0.57 ± 0.64 | 0.078 | 0.77 |
| AIRg | 933 ± 574 | 134 ± 113 | −22.2 ± 207 | 281 ± 191 | 117 ± 207 | 0.25 | 0.57 |
| SI step1, mg/dL · min · kg FFM | 2.04 ± 0.82 | −0.16 ± 0.78 | −0.20 ± 0.31 | −0.0 2 ± 0.31 | −0.28 ± 0.34 | 0.37 | 0.84 |
| SI step 2, mg/dL · min · kg FFM | 8.22 ± 2.58 | 0.37 ± 2.73 | −0.24 ± 1.08 | 0.94 ± 1.07 | −0.15 ± 1.16 | 0.55 | 0.78 |
Abbreviations: AU, arbitrary unit; F, female; HPD, high-protein diet; HU, Hounsfield unit; L, liver; LPD, low-protein diet; M, male; NPD, normal-protein diet; S, spleen. Data are mean ± SEM (t test for difference from zero and ANOVA for effect of diet). Bold values are statistically significant differences from baseline or between diets (contrasts by Tukey test). FFA week baseline is the mean ± SE for week 8 value before insulin clamp; change is the effect during step 2 of insulin clamp.
LPD group: body weight is 68.5 ± 4.7 kg; BMI is 24.2 ± 1.3 kg/m2; NPD group: body weight is 79.2 ± 5.4 kg; BMI is 26.0 ± 2.4 kg/m2; HPD group: body weight is 75.8 ± 2.2 kg; BMI is 26.7 kg/m2.
During the baseline hyperinsulinemic euglycemic clamp performed before overfeeding, FFA concentrations were suppressed 56.8% during the low-dose insulin infusion and by 98.7% ± 3.7% during the higher-dose insulin infusion, which coincided with an increase in respiratory quotient (RQ) from 0.87 ± 0.0067 to 0.95 ± 0.012 and is indicative of increased carbohydrate oxidation. At baseline, the SI during the low-dose step of the clamp was inversely related to fat mass (r = −0.0.53; P = .0078) but not to any other component of body composition or fat distribution. During the high-dose step of the clamp, the SI was positively related to FFM (r = 0.40; P = .038) but not to any of the measure of fatness.
Effect of overfeeding on fat distribution
Table 2 summarizes the changes for the anatomic and metabolic measures with 8 weeks of overfeeding. As we previously reported, overfeeding significantly increased body weight, fat mass, and FFM as measured by DXA (20). There was a significantly greater increase in body weight in the HPD than in the LPD group, which was the result of a greater increase in FFM (P < .05). The total fat mass and abdominal fat increased similarly during overfeeding; overall total fat mass increased by approximately 20% and total abdominal fat mass by approximately 25%. Percentage body fat increased significantly more in the LPD group than in the HPD group (P < .05), reflecting the inverse relationship between percentage fat stored and dietary protein intake (27). In the abdomen, visceral adipose tissue mass increased by approximately 23%, which closely parallels the increase in adipose tissue overall. Adipose tissue expansion of the deep sc depot, however, almost doubled. A correlation analysis revealed no association between the changes in the adipose tissue in each abdominal depot.
We explored the adipose tissue expandability hypothesis and found that fat cell size at baseline was a significant predictor of the increase in visceral adipose tissue (VAT) (r = 0.59; P = .0063) and total adipose tissue mass (TAT; r = 0.44; P = .038) with overfeeding (Figure 2, left panel). Baseline fat cell size was not associated with the changes in total fat mass by DXA or adipose tissue in the sc or deep sc depots or liver lipid. These relationships with fat cell size were not affected by protein content of the overfeeding diets. The AIRg was significantly associated with the increase in body weight (r = 0.47; P = .021), fat mass (r = 0.40; P = .047), total abdominal fat (r = 0.45; P = .035), and deep sc fat (r = 0.47; P = .028) but not fat mass in the visceral depot or intrahepatic lipid. Fasting insulin at baseline correlated negatively with the change in percentage fat (r = −0.43; P = .034) but not with other variables. HOMA-IR predicted the increase in deep sc fat (DSAT) (r = 0.50; P = .016) but not other variables.
![Relation of baseline fat cell size to change in VAT with 8 weeks of overfeeding in heathy volunteers (δVAT = 0.040 ± 0.70 [FCS]; P = .0063).](https://oup.silverchair-cdn.com/oup/backfile/Content_public/Journal/jcem/101/7/10.1210_jc.2016-1313/3/m_zeg0061626360002.jpeg?Expires=1747983049&Signature=HqNK1JQiCm~e2Resoshs6xNOTh~fKpnQ6M4G4ldwKkEqBLywc0yDcsrDQhBRrzQvv5ipxjyqLcSRn-0yFG1s0mtSR~TmuHpG850lFhVueXNiAGGGlBzFLSWs0b74hdmqf9M920LFkRHlzEdjECnxag3CJ24GuIEurl4wUrTT--OroEVoqRhF9145-fVDLeauUL81u9wyD6AnoISBQoU~mW-wqpB2EOd9HNaCN-xsXmuMyNaLgv2iY2CjiaukzEb3ZAxXT4HPvnIbmFqxb3WSrXrF2yqzuvu5mEf0-Lmygrc7NGzscxXL-Ehosq8sQZKENJh~u-C6RvFal5K9JCSthA__&Key-Pair-Id=APKAIE5G5CRDK6RD3PGA)
Relation of baseline fat cell size to change in VAT with 8 weeks of overfeeding in heathy volunteers (δVAT = 0.040 ± 0.70 [FCS]; P = .0063).
FCS, fat cell size.
Effect of overfeeding on parameters of glucose metabolism
As shown in Table 2, fasting glucose and insulin concentrations were significantly increased by overfeeding, but neither were differentially affected by intake of dietary protein. SI as a measure of whole-body insulin resistance did not change with overfeeding and was unaffected by diet composition. However, the suppression of FFAs during the high-dose insulin step 2 was significantly greater before overfeeding (97.8% ± 1.1%) than after overfeeding (95.0% ± 1.1%; P = .0082), indicating insulin resistance. At baseline, the suppression of FFAs during the high-dose insulin infusion was inversely related to baseline fat cell size (r = −0.45; P = .043) as shown in Figure 2 (right panel), but at 8 weeks there was no relation of baseline fat cell size and suppression of FFAs. However, there was a suggestive effect of diet. In the unadjusted data, FFAs were suppressed 99.5% ± 1.39% in the LPD group compared with 96.8% and 97.2% in the NPD and HPD groups, respectively (P = .067). Adjustment for age and sex had little effect (P = .075). The RQ was significantly higher during the high-dose insulin step (0.945 ± 0.012) compared with the low-dose insulin clamp (0.86 ± 0.0076) and compared with fasting (0.87 ± 0.0067), and there were no differences based on diet. The change in intrahepatic lipid during overfeeding was significantly larger in the HPD group (P < .05).
Discussion
In this study, 20 individuals were overfed by approximately 40% above energy needs for 8 weeks and underwent comprehensive assessments of fat distribution and SI. The primary observations were that fasting glucose and insulin were significantly increased by overfeeding, suggesting that there might be insulin resistance, which was confirmed by the impaired suppression of FFAs during the high-dose insulin clamp. However, whole-body SI measured by the hyperinsulinemic euglycemic clamp was not significantly altered. This implies that changes in whole-body insulin response may involve more than a change in adipose tissue mass because total body fat measured by DXA and abdominal fat in the deep sc, visceral, adipose tissue depots, and sc fat cell size all increased during the 8 weeks of overfeeding. Our findings are consistent with those of Alligier et al (28), who also overfed volunteers for 8 weeks but did not observe a change in SI using the clamp procedure. In contrast, our findings differ from the 8 week overfeeding study of Johannsen et al (11), which was conducted at the Pennington Biomedical Research Center, albeit in an outpatient setting in close temporal proximity to ours using the same techniques and protocols. One plausible reason for these differences may be the level of physical activity in the participants in the two studies. Individuals in our study were very inactive (21), a factor that is known to reduce SI (15). In contrast, the participants in the study by Johansson et al (11) were outpatients and thus significantly more active than ours.
Most studies of overfeeding have found an increase in SI and altered metabolic responses sometimes as early as 3 days after the beginning of overfeeding (10, 15–17). An increase in insulin resistance was detected more easily in subjects who were overfed after bariatric surgery (19), in individuals with low birth weight compared with normal birth weight (9), and in individuals with a positive family history of diabetes (29). Subjects in our study were remarkably healthy with no prior history of obesity.
There was a significant effect of dietary protein on gain in body weight and FFM as reported previously (20, 21). Although body weight did not change on the first day, we have shown that an increase in 24-hour energy expenditure and sleeping energy expenditure, directly related to protein intake, were the main drivers of the increase in energy expenditure (21). We also found a significant increase in the percentage body fat in the LPD group, which is consistent with the inverse relationship between protein intake and the fraction of excess energy stored as fat that we previously reported (27). This finding would suggest that the HPD stimulated energy expenditure for catabolism of protein, whereas the individuals eating the LPD did not need as much energy for protein catabolism and were storing it as increased fat.
The size of sc fat cells has been proposed as a link to insulin resistance (11, 30). This hypothesis proposes that large fat cells, as they reach the limit of their size for fat storage, lead to ectopically excess fat. Johansson et al (11) tested this hypothesis and found no relationship between adipocyte size and lipid deposition in their overfed participants. In contrast, we found that fat cell size at baseline was a predictor of the increase in visceral fat but, interestingly, not for fat deposits in sc adipose tissue or DSAT. Again, this difference could be related to differences in physical activity. Baseline fat cell size was also inversely related to the suppression of FFAs during the high-dose insulin clamp. Moreover, the suppression of FFAs as a measure of SI was, suggestively, greater in the individuals eating the LPD (P = .067). Alligier et al (28) found that the changes in VAT were related to the release of fatty acids from adipose tissue, suggesting an important metabolic message from fatty acid turnover.
Acute insulin release is a marker for pancreatic response to insulin. In our study the baseline values for AIRg were correlated with most fat compartments (total fat mass, total abdominal fat mass, deep sc fat mass, and borderline with fat cell size [P = .049] and VAT [P = .054]). The baseline values of AIRg were also correlated with the increase in body weight, fat mass, total abdominal fat mass, and deep sc fat mass.
In summary, we have shown that 8 weeks of overfeeding increased body fat and resistance to the suppression of FFAs but did not suppress whole-body insulin sensitivity. The LPD was associated with an increase in percentage body fat and a decrease in intrahepatic lipid. Baseline fat cell size predicted the increase in VAT and the suppression of FFAs during the high-dose insulin clamp, supporting the adipose tissue expandability hypothesis. Baseline insulin, acute insulin response to glucose, and HOMA-IR predicted the increase in DSAT. In conclusion, an induction of insulin resistance with overfeeding is related to fat cell size and requires more than an expansion of adipose tissue stores.
Acknowledgments
We gratefully acknowledge the participation of the volunteers who agreed to be in this study and the essential contribution of the nursing staff, dietitians, and laboratory technicians who took such good care of them.
This study was registered at clintrial.gov with the national clinical trial number of NCT00565149.
Author contributions included the following: This study was designed by S.R.S., G.A.B., L.d.J., and J.R. and was carried out by L.d.J., S.R.M., S.R.S., and G.A.B. The data were analyzed by G.A.B. and L.M.R.. The paper was drafted by G.A.B., and all authors contributed to the final paper. Both G.A.B. and L.M.R. had access to all of the data.
This work was supported by Grant 2010–34323-21052 from the Department of Agriculture.
Disclosure Summary: The authors have nothing to disclose.
Abbreviations
- AIRg
acute insulin response to glucose
- BMI
body mass index
- CT
computed tomography
- DSAT
deep sc fat
- DXA
dual-energy x-ray absorptiometry
- FFA
free fatty acid
- FFM
fat-free mass
- HOMA-IR
homeostatic model assessment index of insulin resistance
- HPD
high-protein diet
- LPD
low-protein diet
- NPD
normal-protein diet
- Rd
glucose uptake
- RMR
resting metabolic rate
- RQ
respiratory quotient
- SI
insulin sensitivity
- TAT
total adipose tissue mass
- VAT
visceral adipose tissue mass.
