


Abstract
Specific serum fatty acid (FA) profiles predict the development of incident type 2 diabetes; however, limited longitudinal data exist exploring their role in the progression of insulin sensitivity (IS) and β-cell function.
To examine the longitudinal associations of the FA composition of serum phospholipid (PL) and cholesteryl ester (CE) fractions with IS and β-cell function over 6 years.
The Prospective Metabolism and Islet Cell Evaluation (PROMISE) cohort is a longitudinal observational study, with clinic visits occurring every 3 years. Three visits have been completed, totaling 6 years of follow-up.
Individuals (n = 477) at risk for diabetes recruited from the general population in London and Toronto, Canada.
Values from an oral glucose tolerance test were used to compute 1/HOMA-IR and the Matsuda index for IS, the insulinogenic index over HOMA-IR, and the insulin secretion-sensitivity index-2 for β-cell function. Thin-layer chromatograph and gas chromatograph quantified FA. Generalized estimating equations were used for the analysis.
IS and β-cell function declined by 8.3–19.4% over 6 years. In fully adjusted generalized estimating equation models, PL cis-vaccenate (18:1n-7) was positively associated with all outcomes, whereas γ-linolenate (GLA; 18:3n-6) and stearate (18:0) were negatively associated with IS. Tests for time interactions revealed that PL eicosadienoate (20:2n-6) and palmitate (16:0) and CE dihomo-γ-linolenate (20:3n-6), GLA, and palmitate had stronger associations with the outcomes after longer follow-up.
In a Canadian population at risk for diabetes, we found that higher PL stearate and GLA and lower cis-vaccenic acid predicted consistently lower IS and β-cell function over 6 years.
The serum composition of fatty acids and their role in the development of type 2 diabetes mellitus is an area of active investigation. Individual fatty acids, which are either consumed from the diet or synthesized de novo, have been shown to have differential associations with the incidence of diabetes, depending on carbon chain length and the degree of unsaturation (1–4). However, the pathogenesis of diabetes is complex and multifactorial, and understanding the mechanisms underlying these associations is imperative to the development of effective diabetes prevention strategies.
Worsening insulin sensitivity and β-cell function play central roles in the pathophysiology of diabetes (5–7). Experimental research suggests that certain fatty acids influence insulin sensitivity and β-cell function to a greater degree than others. For example, saturated fatty acids such as palmitic acid (16:0) and stearic acid (18:0) exert a strong lipotoxic effect, impairing β-cell function and inhibiting insulin signaling, whereas some polyunsaturated fatty acids may protect against lipotoxicity (8–11). In humans, these findings have been supported by a limited number of cross-sectional studies that have used indices of insulin sensitivity and secretion (12–15).
Importantly, limited longitudinal data exist on associations of fatty acid profiles with detailed indices of insulin sensitivity, and to our knowledge, no study to date has examined the association of serum fatty acid composition with the longitudinal decline in β-cell function. In this context, our objective for this current study was to investigate the longitudinal associations of fatty acids in the serum phospholipid (PL) and cholesteryl ester (CE) fractions with the progression of insulin sensitivity and β-cell function, as well as their interactions over time.
Subjects and Methods
The Prospective Metabolism and Islet Cell Evaluation (PROMISE) cohort (16, 17) is a longitudinal observational study of participants with one or more risk factors for type 2 diabetes mellitus, including obesity, hypertension, family history of diabetes, and/or a history of gestational diabetes or birth of a macrosomic infant. Participants aged 30 years and older were recruited from the general population into the PROMISE cohort (n = 736) from Toronto and London, Ontario, Canada in 2004–2006. Annual telephone contact is maintained, and follow-up examinations occur every 3 years; three examination visits have been completed to date (2004–2006, 2007–2009, and 2010–2013). The current study used data on participants who did not have diabetes at baseline, who returned for one or more follow-up examinations, and who had samples available for fatty acid measurements (n = 477). A diagram of the sample size at each visit is shown in Supplemental Figure 1. At each examination, participants undergo extensive metabolic characterization, anthropometric measurements, and structured questionnaires on lifestyle and sociodemographics. Research ethics approval was obtained from Mount Sinai Hospital and the University of Western Ontario. Data collection methods were standardized across the two centers, and research nurses were centrally trained.
Anthropometric and metabolic measurements
Height, weight, and waist circumference (WC) were measured at all clinic examinations using standard procedures. WC was measured at the natural waist, defined as the narrowest part of the torso between the umbilicus and the xiphoid process. Height and weight were measured using standard procedures. Body mass index (BMI) was calculated by dividing weight (kilograms) by height (meters) squared. A fasting blood sample was drawn after an 8- to 12-hour fast at each clinic examination. A 75-g oral glucose tolerance test (OGTT) was conducted, with additional blood samples drawn at 30 minutes and 2 hours after glucose load. All blood samples were processed and frozen at −70°C for the determination of blood biomarkers. Alanine aminotransferase (ALT) was measured using standard laboratory procedures. Cholesterol, high-density lipoprotein, and triacylglycerols were measured using Roche Modular's enzymatic colometric tests. Both specific insulin and glucose were derived from the OGTT at fasting, 30-minute, and 2-hour time points. Specific insulin was measured using the Elecsys 1010 (Roche Diagnostics) immunoassay analyzer and electrochemiluminescence immunoassay. This assay shows 0.05% cross-reactivity to intact human proinsulin and the Des 31,32 circulating split form (Linco Research, Inc.) and has a coefficient of variation (CV) of 9.3%. Glucose was determined using an enzymatic hexokinase (Roche Modular, Roche Diagnostics) with a detection range of 0.11 (2 mg/dL) to 41.6 mmol/L. The interassay %CV is < 1.1%, and the intra-assay %CV is < 1.9%. All assays were performed at the Banting and Best Diabetes Centre Core Lab at the University of Toronto. Impaired fasting glucose (IFG), impaired glucose tolerance (IGT), and diabetes were categorized using the 2006 World Health Organization criteria (18).
Measurement of serum fatty acids
Fatty acid PL and CE compositions were quantified using stored fasting serum samples from the baseline visit that had been frozen at −70°C for 4–6 years; these samples had not been exposed to any freeze-thaw cycles. Previous literature has documented that serum fatty acids are stable at these temperatures for up to 10 years (19). A known amount of 1,2-diheptadecanoyl-sn-glycero-3-phosphocholine and cholesteryl heptadecanoate (17:0) was added to the serum, as internal standards, before extracting total lipids according to the method of Folch et al (20). A portion of the total lipid extract was added onto thin layer chromatography G-plates (catalog no. 10011, Analtech/iChromatography) to isolate each fraction. Lipid fraction bands were converted to fatty acid methyl esters and were separated and quantified using a Varian-430 gas chromatograph (Varian, Inc.) equipped with a Varian Factor Four capillary column and a flame ionization detector. Samples were injected in splitless mode. Peaks were identified by retention times of fatty acid methyl ester standards (Nu-Chek Prep, Inc). Fatty acid concentrations (nanomoles per milliliter) were calculated by proportional comparison of gas chromatography peak areas to that of the internal standards (21, 22). There were 22 fatty acids measured in each of the PL and CE fractions, ranging from 14:0 to 24:1n-9. Although triacylglycerol and nonesterified fatty acid (NEFA) serum fractions were also quantified, we decided a priori to describe the PL and CE fractions in this paper and the other fractions in separate reports, given their complexity and unique biology.
Variable calculations
Glucose and insulin values from the OGTT were used to compute insulin sensitivity and β-cell function indices. Insulin sensitivity was assessed using one over the homeostasis model assessment of insulin resistance (1/HOMA-IR) (23) and the insulin sensitivity index (ISI) (24). 1/HOMA-IR largely reflects hepatic insulin sensitivity, whereas ISI reflects whole-body insulin sensitivity (25). β-Cell function was assessed using the insulinogenic index (26) over HOMA-IR (IGI/IR) and the insulin secretion-sensitivity index-2 (ISSI-2) (27). IGI/IR is a measure of the first phase insulin secretion, whereas the more recently developed ISSI-2 is analogous to the disposition index. These insulin sensitivity and β-cell function indices have been validated against “gold standard” measures (23, 24, 27).
Statistical analysis
The outcome variables in the analyses were 1/HOMA-IR, ISI, IGI/IR, and ISSI-2, whereas the primary predictor variables were the 22 fatty acids in each of the PL or CE fractions using mole percentage (mol%) of the total fraction. As a sensitivity analysis, we replaced the mol% fatty acids in the fully adjusted models with the concentration data and analyzed these variables as primary predictors with the outcome variables. Outcome variables were highly skewed and therefore were log-transformed before analysis. Spearman correlation coefficients were computed for the PL and CE fatty acids with other continuous variables.
For the primary analysis, generalized estimating equation (GEE) models (28) were used to determine the associations between the outcome variables and the predictor variables. An auto-regressive of order 1 working correlation matrix was specified for the GEE models given the longitudinal design, although other correlation matrices (eg, exchangeable) had similar model fits when evaluated (data not shown). GEE is well suited to longitudinal data from cohorts because it is flexible to missed visits. The predictor variables were scaled (mean-centered and standardized) to compare across tests. Because PL and CE fatty acids were only quantified at the baseline visit, they were set as time-independent predictor variables (held constant over time). The outcome variables 1/HOMA-IR, ISI, IGI/IR, and ISSI-2 were set as time-dependent variables because they were measured at each examination visit. No imputation was conducted on missing values.
Covariates included in the GEE models were identified using the previous literature, recommendations from directed acyclic graph theory (29) on causal pathways that were based on the biological mechanisms underlying the hypothesized associations, and quasi-likelihood information criterion to minimize information loss in potential models by balancing model fit with model complexity. A comparison of models with different covariates and the resulting quasi-likelihood information criterion calculations are shown in Supplemental Table 1. The final GEE model (M9) that we selected had time, sex, ethnicity, baseline age, WC, total NEFA, ALT, and family history of diabetes as covariates. Continuous covariates (excluding time) were scaled, and the resulting GEE β coefficients were exponentiated. Scaling, log-transforming, and exponentiating allowed interpreting the GEE β coefficients as an expected percentage difference in the outcome variable for every standard deviation increase in the predictor variable, given the covariates are held constant. Interaction for time with each predictor variable was included in the GEE model. Two additional sensitivity analyses were performed. One analysis included baseline prediabetes in the GEE models. Another analysis was conducted on conversion to dysglycemia over the 6 years, with the fatty acids in the two lipid fractions using logistic regression for comparison with the primary analysis.
Significance was set as P < .05 for all tests. All computed P values were adjusted using the Benjamini-Hochberg false discovery rate (30) to correct for multiple testing. Analyses were conducted in R 3.2.4 statistical computing environment (31), using the following packages: ggplot2 2.1.0 for the graphics (32) and geepack 1.2.0.1 for the GEE modeling (33). The code to generate the results shown in this manuscript can be found at http://dx.doi.org/10.6084/m9.figshare.1552011.
Results
Basic characteristics
At the baseline visit, participants recruited into the PROMISE cohort had a mean age of 50.2 years (9.8 SD), an average BMI of 31.1 kg/m2 (6.4 SD), and an average WC of 98.5 cm (15.5 SD), and 65.7% (n = 308) had a family member with diabetes (Table 1). Outcome indices had a significant median decline of between 8.3 and 19.4% over the 6 years of follow-up.
Baseline Characteristics of PROMISE Participants at the Baseline Examination (2004–2006)
| Measure | Baseline Visit |
|---|---|
| n | 477 |
| Female | 346 (73%) |
| European | 334 (70%) |
| Latino/a | 56 (12%) |
| Other ethnicity | 51 (11%) |
| South Asian | 32 (7%) |
| IFG | 10 (2%) |
| IGT | 13 (3%) |
| Family members with diabetes | 308 (65%) |
| Age, y | 50.1 (10.0) |
| BMI, kg/m2 | 31.1 (6.4) |
| WC, cm | 98.5 (15.5) |
| TAG, mmol/L | 1.5 (0.8) |
| Cholesterol, mmol/L | 5.2 (0.9) |
| LDL, mmol/L | 3.1 (0.8) |
| HDL, mmol/L | 1.4 (0.4) |
| ALT, U/L | 29.3 (15.1) |
| NEFA, nmol/mL | 383.1 (116.2) |
| FA in PL, nmol/mL | 5307.2 (867.2) |
| FA in CE, nmol/mL | 5552.0 (1038.8) |
| HOMA-IR | 13.1 (8.5–22) |
| ISI | 13.6 (8.7–21.7) |
| IGI/IR | 7.1 (4.2–10.5) |
| ISSI-2 | 727.2 (569.6–918.6) |
Abbreviations: FA, fatty acids; HDL, high-density lipoprotein; LDL, low-density lipoprotein; TAG, triacylglycerol. Values are expressed as mean (SD), median (interquartile range), or number (percentage). Note that 9–16 participants had missing data in the outcome variables.
Figure 1 shows the proportions of each fatty acid in the PL and CE fractions. The fatty acids that contributed the largest portion to the total PL fraction were palmitic acid (16:0) at 30.7%, linoleic acid (18:2n-6) at 21.8%, stearic acid (18:0) at 15.1%, and oleic acid (18:1n-9) at 10.3%, totaling 77.9%. In the CE fraction, the fatty acids that contributed the most to the total fraction were linoleic acid (18:2n-6) at 52.3%, oleic acid (18:1n-9) at 18.8%, and palmitic acid (16:0) at 12.5%, totaling 83.6%. See Supplemental Table 2 for the raw concentration and mol% values.
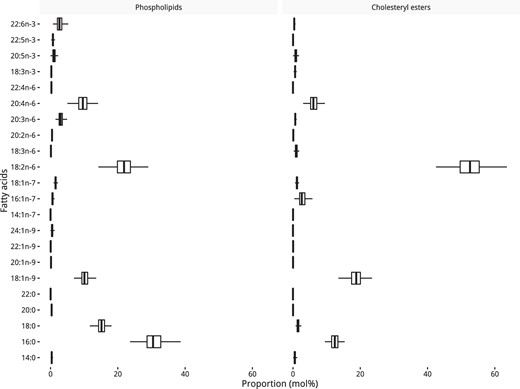
Distribution of fatty acids in the PL and CE fractions as a percentage of the total pool.
Each box shows the median and interquartile range.
Over the 6 years, 42 (9%) participants within this subset of the cohort developed diabetes, whereas 96 (20%) developed prediabetes (either IFG or IGT).
Spearman correlations at the baseline visit
Figure 2 shows a heatmap of the Spearman correlation coefficients between the PL and CE fatty acids with several continuous covariates and the outcomes at the baseline visit. PL fatty acids (mol%) had moderate (>0.30) correlations with multiple variables, among which were: 16:0 with ISI (rs = −0.32); 20:3n-6 with waist (rs = 0.37), 1/HOMA-IR (rs = −0.39), and ISI (rs = −0.39); 18:1n-7 with 1/HOMA-IR (rs = 0.31) and ISI (rs = 0.31); and, 18:0 with 1/HOMA-IR (rs = −0.33) and ISI (rs = −0.33). For the CE fraction, only one fatty acid (mol%) had a moderate correlation (>0.30) with the variables: 20:3n-6 with waist (rs = 0.39), 1/HOMA-IR (rs = −0.4), ISI (rs = −0.41), and ISSI-2 (rs = −0.3). All other PL and CE fatty acids were weakly correlated (<0.30) with the covariates and outcomes.
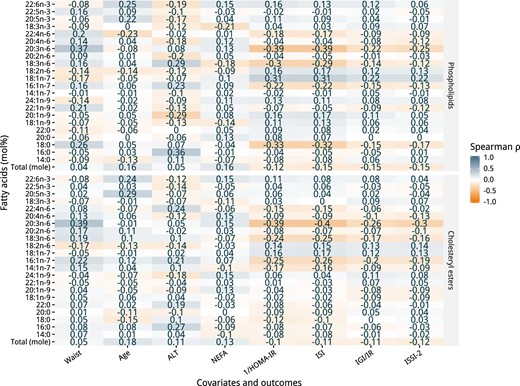
Spearman correlation coefficient heatmap of the PL and CE fatty acids with covariates and outcomes of the PROMISE participants at the baseline visit (2004–2006).
GEE analysis
Main effect associations
The main effect analyses, without interactions by time in the GEE model, are shown in Figure 3. The top portion of Figure 3 shows the results of the GEE modeling for the individual PL fatty acids (mol%) as well as the total PL fraction (mol). For the IS indices, the PL fatty acids that had positive associations with 1/HOMA-IR were the monounsaturated fatty acids 18:1n-7 and 18:1n-9, whereas those with a negative association were 18:0 and 18:3n-6. Fatty acids with a positive association with ISI were 18:1n-7 and 18:1n-9, and those with a negative association were 18:0 and 18:3n-6. For the β-cell function indices, the only PL fatty acid that had a positive association with IGI/IR and ISSI-2 was 18:1n-7. Total PL was not associated with any of the outcomes. The bottom portion of Figure 3 shows the results of the GEE analysis for the CE fraction. Compared to the PL fraction, there were substantially fewer associations seen in the CE fraction. Only one fatty acid, 18:1n-7, was positively associated with both 1/HOMA-IR and ISI. No CE fatty acid was associated with IGI/IR and ISSI-2, nor was total CE associated with any of the outcomes.
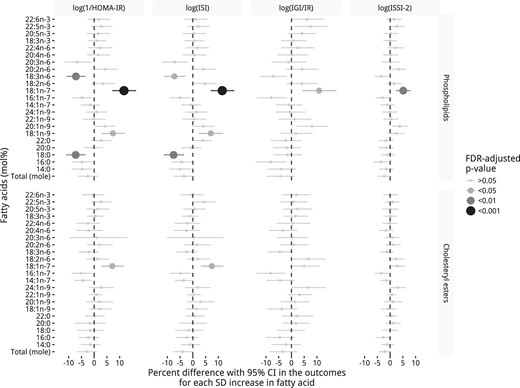
Longitudinal associations of individual PL and CE fatty acids (mol%) with insulin sensitivity and β-cell function using GEEs over the 6 years in the PROMISE cohort.
Adjusted for time, sex, ethnicity, baseline age, WC, family history of diabetes, total NEFAs, and ALT. Outcome variables were log-transformed, predictor variables were scaled, and x-axis values were exponentiated to represent percentage difference per standard deviation increase in the fatty acid. P values were adjusted for the Benjamini-Hochberg false discovery rate (FDR).
Sensitivity analyses using fatty acids as a concentration are shown in Supplemental Figure 2. Associations were similar in the PL fraction in magnitude and direction, although there was some attenuation of results, particularly for the β-cell function measures. In the CE fraction, of the few associations seen in the mol% analysis, all were attenuated. Raw β and CI values from the GEE analyses for mole percentage are presented in Supplemental Table 3 and for the mole concentration in Supplemental Table 4. Sensitivity analyses of GEE models adjusting for baseline prediabetes were not different from the final model (data not shown). Sensitivity analyses examining dysglycemia showed no association of any with the fatty acids with conversion to dysglycemia, as shown in Supplemental Figure 3.
Interactions by time
Figure 4 shows the results of the interactions by time in the PL and CE fractions (mol%). Two PL fatty acids had a significant interaction by time, namely 20:2n-6 with ISI and ISSI-2, and 16:0 with ISSI-2. In addition, three CE fatty acid interactions were significant: 20:3n-6 had a significant interaction by time for all outcomes (except for ISI); 18:3n-6 with ISI; and, 16:0 with ISSI-2. Sensitivity analysis using fatty acids as a concentration had similar results in the PL fraction (shown in Supplemental Figure 4).
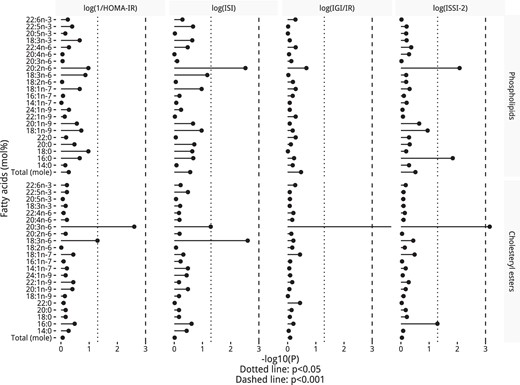
P values from a test for a time interaction by PL and CE fatty acids (mol%) in the fully adjusted GEE model, including the interaction term.
P values were adjusted for the Benjamini-Hochberg false discovery rate.
Significant interactions in the PL fraction as a mol% were visualized in Figure 5, whereas those in the CE fraction are in Supplemental Figure 5 and those in the PL fraction as a concentration are in Supplemental Figure 6. In the PL fraction, lower proportions of 20:2n-6 and higher proportions of 16:0 had stronger negative associations with ISI (20:2n-6 only) and ISSI-2 (in Figure 5, A–C) after a longer follow-up. In the CE fraction, low proportions of 20:3n-6 had a slightly stronger negative association in all the outcomes (except ISI) after a longer follow-up (Supplemental Figure 5, A–C). Lower proportions of CE 18:3n-6 had a stronger negative association with 1/HOMA-IR and ISI (in Supplemental Figure 5, D and E) after a longer follow-up. As with PL 16:0, high proportions of CE 16:0 had a slightly stronger negative association with ISSI-2 (in Supplemental Figure 5F) after a longer follow-up. Concentration interaction plots can be seen in Supplemental Figure 5, G and H for CE, and in Supplemental Figure 6 for PL.
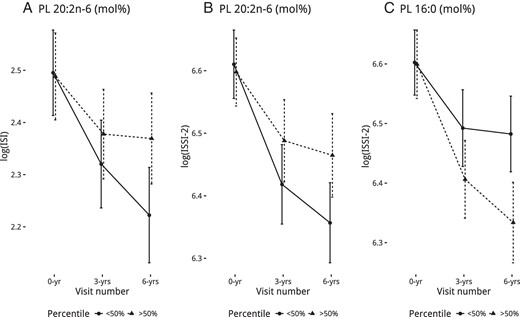
Calculated least-squares means (with 95% confidence interval) of the outcomes from fully adjusted GEE models based on PL fatty acids (mol%), split by median for the groups, that had a significant interaction by time.
Discussion
In a Canadian cohort of predominately female and European-ancestry individuals who are at risk for diabetes, we found that higher levels of specific fatty acids in the PL and CE fraction associated with differences in insulin sensitivity and β-cell function over 6 years. Specifically, cis-vaccenic acid (18:1n-7) and oleic acid (18:1n-9) had protective associations, whereas γ-linolenic acid (GLA; 18:3 n-6) and stearic acid (18:0) had harmful associations consistently over 6 years. A few fatty acids had stronger associations as time progressed, where lower proportions of eicosadienoic acid (20:2n-6), GLA, and dihomo-GLA (20:3n-6) and higher proportions of palmitic acid (16:0) had stronger harmful associations after longer follow-up times.
In our results, cis-vaccenic acid (18:1n-7) had the strongest and most consistent association with the outcomes, predicting an estimated 5.17 to 11.7% greater insulin sensitivity and β-cell function with higher cis-vaccenic acid. One study (12) reported a higher proportion of cis-vaccenic acid in the PL fraction associated with a lower chance of incident diabetes. Two recent studies from Finland found that PL cis-vaccenic acid predicted higher insulin sensitivity and lower glucose area under the curve (13, 34), as well as higher β-cell function (34). Our study confirms that these observations are consistent longitudinally, assessed at three time points over 6 years, and that the potential benefit of cis-vaccenic acid is consistently strong in each insulin sensitivity and β-cell function measure, relative to the other fatty acids. Our findings also strengthen previous associations of cis-vaccenic acid on insulin sensitivity, which was consistent between the PL and CE fractions. Although the causal pathways involved are not fully understood because limited mechanistic studies have been done to date on cis-vaccenic acid, an experimental study (35) in bovine adipocytes suggests a potential role in inhibiting de novo lipogenesis. Another possible mechanism may be that more palmitoleic acid (16:1n-7) is elongated, thus reducing its concentration, which would have beneficial implications, as reported in previous literature (36).
We also observed a consistent negative influence of GLA (18:3n-6) in the PL fraction on insulin sensitivity, with an estimated 7.2% lower insulin sensitivity for higher GLA. Previous findings on GLA have been mixed, with data from the EPIC-Potsdam cohort showing that higher GLA increased the risk for incident diabetes (3), whereas results from the Atherosclerosis Risk in Communities cohort found no association with incident diabetes (1). GLA in the CE fraction was not associated with any of the outcomes; however, a time interaction test showed that individuals with lower proportions of CE GLA had lower whole-body insulin sensitivity after a longer follow-up time compared to individuals with higher proportions, a contradiction to the PL findings. These conflicting results for GLA as potentially harmful in the PL fraction, but beneficial in the CE fraction, are not entirely clear, although the associations seen in the CE fraction were weak and could be a statistical anomaly. The mechanisms underlying either of the observed associations have not been elucidated, and whereas there is some research suggesting that GLA may have anti-inflammatory properties (37), our findings would suggest that either less GLA is being used in anti-inflammatory pathways within our population or GLA itself may be harmful.
The saturated fatty acids are perhaps the most extensively studied fatty acids in the various lipid fractions. We found that in the PL fraction, higher proportions of stearic acid (18:0) predicted an estimated 7.4% lower insulin sensitivity. Our findings are consistent with previous studies showing a harmful association of stearic acid on the risk for diabetes (1, 2, 12, 14) and insulin resistance or hyperglycemia (12, 15, 34, 38), although some studies have shown mixed results (4, 13, 39). To our knowledge, the present study is the first in humans to observe that individuals with a higher proportion of palmitic acid in either the PL or CE fraction had markedly lower β-cell function as time progressed, compared to individuals with a lower proportion, extending previous experimental research highlighting the role of lipotoxicity in reducing the secretory capacity of the β-cells, possibly through greater endoplasmic reticulum stress or activation of inflammatory immune cells such as monocytes or macrophages (9, 40, 41).
There were distinct differences in our findings between the PL and CE fractions, highlighting the importance of research exploring each lipid fraction. Our results were also slightly different between the percentage and the concentration data, particularly in the β-cell function measures. Previous studies have to our knowledge only utilized data on fatty acids as a percentage and is a stated limitation (2, 13), given the interdependence between fatty acids in the lipid fraction. A strength of our study is in the inclusion of the analysis of both percentage and concentration data, of which we found some agreement in results within the PL fraction. The few fatty acids that had attenuated associations as a concentration were primarily stearic acid and oleic acid. This suggests that when these fatty acids replace other fatty acids (ie, increase as a percentage), they may exert a beneficial (eg, oleic acid) or a harmful (eg, stearic acid) influence on metabolic functioning, compared to neutral associations when they increase as a concentration.
There are a number of limitations with our study. First, fatty acids were only quantified at the baseline visit. However, in our view, this limitation has the advantage of reducing the chance of reverse causality, given the interconnected pathways involved in fatty acid metabolism and insulin regulation (eg, higher insulin resistance may also disrupt fatty acid metabolism). Second, because this is an observational study, there may be some residual confounding that we haven't considered. Nonetheless, we have taken extensive precautions to understand and minimize potential confounding. Lastly, given the study design targeting individuals at risk for diabetes and the large portion of females and those of European ancestry within our population, our results may not be applicable to the general population. Our study has many strengths, including the longitudinal design and statistical techniques, which are better suited to understanding temporal relationships. Our cohort also contains highly detailed and comprehensive variable measurements at each collection visit, as well as the inclusion of fatty acids as both a concentration and a percentage.
To conclude, in our study of Canadian individuals at risk for diabetes, we found that higher saturated and n-6 fatty acids and lower cis-vaccenic acid associated with lower insulin sensitivity and β-cell function consistently over time, of which most associations were seen in the PL fraction. Certain fatty acids, notably palmitic acid, had stronger associations after longer follow-up times.
Acknowledgments
The authors thank Jan Neuman, Paula Van Nostrand, Stella Kink, and Annette Barnie of the Leadership Sinai Centre for Diabetes, Mount Sinai Hospital, Toronto, Canada; and Sheila Porter and Mauricio Marin of the Centre for Studies in Family Medicine, University of Western Ontario, London, Canada, for their expert technical assistance and dedication in their work for PROMISE.
This work was supported by the Canadian Diabetes Association (CDA), the Canadian Institutes for Health Research, and the University of Toronto Banting and Best Diabetes Centre (BBDC). L.W.J. is supported by a CDA Doctoral Student Research Award and a University of Toronto BBDC Graduate Novo Nordisk Studentship. R.R. is supported by a Heart and Stroke Foundation of Ontario Mid-Career Investigator Award. S.B.H. holds the CDA Chair in National Diabetes Management and the Ian McWhinney Chair of Family Medicine Studies at the University of Western Ontario. B.Z. holds the Sam and Judy Pencer Family Chair in Diabetes Research at Mount Sinai Hospital and the University of Toronto. R.B.P. holds a Tier II Canada Research Chair in Brain Lipid Metabolism. A.J.H. holds a Tier II Canada Research Chair in Diabetes Epidemiology.
Disclosure Summary: The authors have nothing to disclose.
Abbreviations
- ALT
alanine aminotransferase
- BMI
body mass index
- CE
cholesteryl ester
- CV
coefficient of variation
- GEE
generalized estimating equation
- GLA
γ-linolenic acid
- HOMA-IR
homeostasis model assessment of insulin sensitivity
- IFG
impaired fasting glucose
- IGI/IR
insulinogenic index over HOMA-IR
- IGT
impaired glucose tolerance
- ISI
insulin sensitivity index
- ISSI-2
insulin secretion-sensitivity index-2
- mol%
mole percentage
- NEFA
nonesterified fatty acid
- OGTT
oral glucose tolerance test
- PL
phospholipid
- WC
waist circumference.
