


Abstract
Thyroid hormones are important developmental factors and levels should be adequate both in the pregnant woman and in the fetus. However, there is no consensus on maternal thyroid test reference limits in early pregnancy.
Estimation of week-to-week changes in and predictors of TSH and free T4 (fT4) reference limits in the first trimester of pregnancy.
Measurement of TSH and fT4 in biobank sera collected in pregnancy weeks 5–19 from a random sample of the Danish National Birth Cohort that enrolled 101 032 pregnant in 1996–2002.
National cohort of pregnant women.
Healthy participants (n = 6671) were identified and individual characteristics retrieved using interview data and data from Danish national health registers.
None.
Reference limits for TSH and fT4 in each first trimester pregnancy week and predictors of these reference limits.
TSH reference limits were very variable. Up to and including week 6, nonpregnancy reference limits could be used. In weeks 9–12, TSH upper reference limit was approximately 0.4 mU/L lower than the nonpregnancy upper limit. The TSH lower reference limit was approximately 0.1 mU/L. fT4 variations were reverse to those of TSH, but changes were small with approximately 4% higher reference limits during the weeks 9–12. TSH upper reference limit was lower in multiparous women and women with lower iodine intake but higher in obese women. fT4 was lower in smokers.
TSH reference limits differ widely in the first trimester of pregnancy. The use of a uniform set of reference limits is an inordinate simplification that will lead to frequent misclassification and possibly to incorrect choice of therapy.
Thyroid hormones are powerful developmental factors of crucial importance for human brain development (1, 2). During the first half of pregnancy, the thyroid hormones involved in fetal development are all of maternal origin, and abnormal thyroid function in pregnancy may severely increase the risk of fetal loss and other pregnancy complications (3, 4). In addition, there may be long-term consequences for the health of the child (5). Therefore, much focus is on early diagnosing and careful therapy of thyroid dysfunction in pregnancy (6, 7). However, pregnancy leads to changes in test results used to diagnose thyroid dysfunction, and clinical controversies exist on the levels of serum TSH and free T4 (fT4), which indicate a need for therapy, especially in the first trimester of pregnancy (8, 9).
The newly formed utero-placenta unit orchestrates early pregnancy changes in thyroid function tests. One involved mechanism, that may be vital to successful reproduction (10) is a very high level of iodothyronine deiodinase type 3 (D3) in the utero-placental unit (11, 12). D3 inactivates thyroid hormones and thereby it reduces their placental transfer massively (13). The deiodinases participate in a regulatory system that keeps fetal levels of thyroid hormone low, especially in early pregnancy, but allows short periods of thyroid hormone exposure to initiate tissue specific development (14, 15). Because of the high D3 activity, early pregnancy is associated with a 50% increase in levothyroxine replacement dose needed to keep athyreotic pregnant women euthyroid (16). A sign of the high D3 activity is that maternal serum levels of the T4 metabolite reverse T3 is high already in very early pregnancy (8).
In pregnant women with an intact thyroid, the thyroid gland compensates the increase in thyroid hormone disposal by an increase in hormone synthesis and secretion, and there is a corresponding 50% increase in thyroid absolute iodine uptake (17). This takes place via the production of another placental factor, the weak TSH receptor agonist human chorionic gonadotropin (hCG). The high hCG levels in early pregnancy activate the thyroid gland sufficiently to compensate for the increase in thyroid hormone degradation, and the peak serum hCG level is even associated with a fall in serum TSH in early pregnancy (18).
A third factor of importance for thyroid function testing in pregnancy is the high levels of estrogen that via effects on the liver lead to a gradual increase in the serum concentration of thyroxine-binding globulin, and thereby an increase in serum total T4 and T3 concentrations (19).
These mechanisms change the results of thyroid function testing in the first trimester of pregnancy, and there is no firm consensus on how thyroid dysfunction should be diagnosed. Current guidelines advocate that a fixed upper reference limit of 2.5 mU/L for TSH might be applied throughout the entire first trimester of pregnancy (6, 7, 20), whereas various authors have expressed the opinion that this limit is too narrow (8, 9, 21, 22). A recent Chinese study suggested that the first trimester should be split into 2 time periods, each having a different upper TSH reference limit (23), and based on a subsample of the CATS study, it has been advocated that the use of multiple of the median (MoM) TSH values for diagnosing would be optimal (24).
We used serum samples collected in early pregnancy from a random group of healthy participants in the Danish National Birth Cohort (DNBC) (25) to study week-to-week variation in reference intervals for serum TSH and fT4 in the first trimester of pregnancy, and we evaluated the feasibility of using standard MoM values to define biochemical normality. In addition, we studied how a number of individual characteristics influenced TSH and fT4 reference ranges in early pregnancy.
Materials and Methods
Study cohort
The DNBC is a nationwide cohort of Danish pregnant women who had their first antenatal visit in a general practice in the years 1996–2002 (25). Women were included if they lived in Denmark, spoke Danish well enough to participate in a telephone interview, and intended to carry their pregnancy to term. Around 50% of Danish pregnant women were invited, and 60% of the invited women agreed to participate. As previously described in detail (26), the women enrolled were asked to fill out a registration form at the first antenatal visit in general practice and to participate in a telephone interview in early pregnancy (median gestational wk 17) which focused on exposures during the pregnancy (eg, smoking in the pregnancy, prepregnancy alcohol intake, prepregnancy body mass index [BMI, body weight in kg/body height in m2]). In addition to this, information was available by linkage to Danish nationwide health registers including hospital diagnosis of disease and surgery in the Danish National Hospital Register, redeemed prescriptions of drugs in the Danish National Prescription Register and population characteristics (country of birth and geographical residence) from Statistic Denmark. In Denmark, every individual is provided a unique 10-digit personal identification number at birth, which is used in encrypted form in all nationwide registers and enables linkage between the different registers.
Study participants
Women enrolled had provided written informed consent to participate in the DNBC, and the pregnancy included was the woman's first pregnancy in the DNBC with the birth of a singleton live-born child. Information on gestational age at birth of the child should be available and registered in the range from 25 to 45 weeks. The early pregnancy telephone interview should have been performed before the woman entered gestational week 30, and blood sampling should have been performed in early pregnancy. At the time of enrollment in general practice, a blood sample was drawn and sent by regular mail for processing and stored in a −80°C freezer at the Danish National Biobank. The time from sampling to the sample arrived for storage was median 1 day. In the 5% of samples with no date of blood sampling registered, the date of sampling was defined as the date the sample arrived for storage minus 1 day.
Altogether, 71 706 women fulfilled the criteria listed above and participants were selected as a 12% random sample corresponding to 8605 women (Figure 1). Access to small amounts of biobank sera for measurement of TSH and fT4 were given by the DNBC steering group after protocol review. Results of both TSH and fT4 analyses for the present study became available for 7624 individuals (sufficient blood sample not available for analyses n = 951, TSH and/or fT4 measurement failure n = 28, blood sampling performed after gestational wk 19 n = 2). To restrict the assessment of reference range limits for TSH and fT4 to “healthy individuals,” we subsequently excluded women with a registration of thyroid disease (n = 445) or other autoimmune disease (diabetes, rheumatoid arthritis, and inflammatory bowel disease) (n = 330) before, during or after the pregnancy up to December 31, 2010, women with a registered redeemed prescription of thyroid interfering medication in the period from 3 months before pregnancy to birth of the child (antiepileptic drugs [n = 14], dopamine agonists [n = 5], and prednisolone [n = 1]). Finally, women with TSH more than or equal to 4.5 mU/L or fT4 more than or equal to 21 pmol/L (n = 158) were excluded as these participants (TSH up to 80 mU/L, fT4 up to 42 pmol/L) were considered to suffer from undiagnosed disease, or results were measurement failures. The volume of serum sample available did not allow measurement of thyroid autoantibodies.
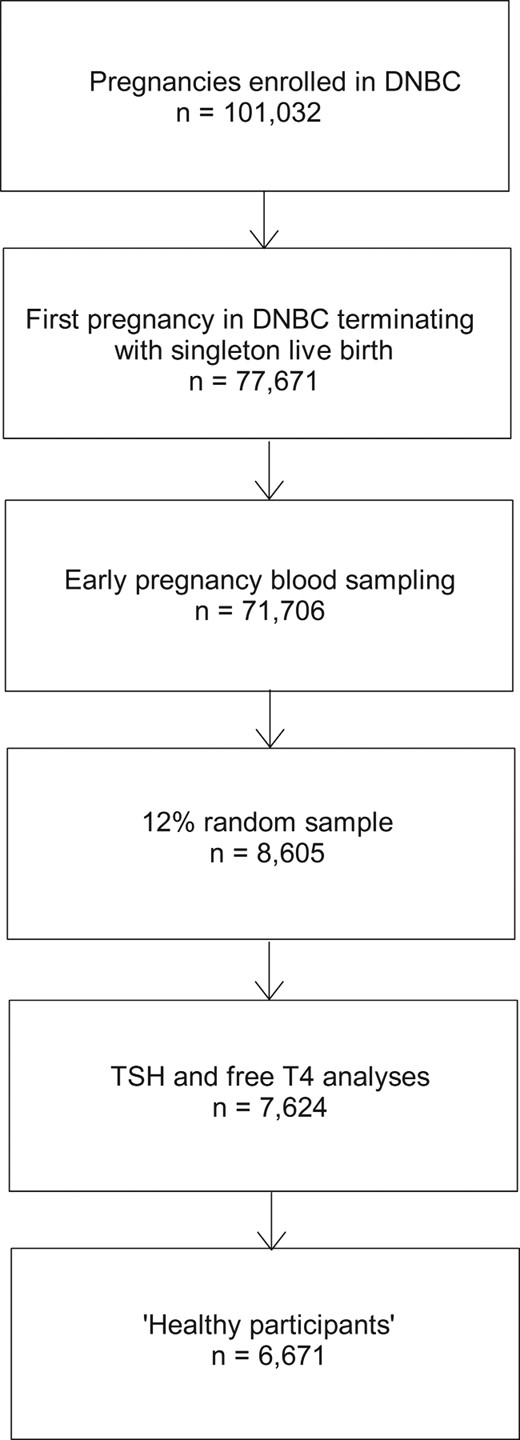
Flowchart showing participants in the DNBC and the selection of healthy participants included in the present study.
See Materials and Methods for further details.
Gestational age
Gestational age at birth of the child was obtained from the Danish Medical Birth Registry (registered by midwife on the day the child was born). In Denmark, gestational age is based on the date of last menstrual period (on average 2 wk before conception) in combination with ultrasound verification. We used the registered gestational age at birth to calculate the date of first day in the last menstrual period by subtracting registered gestational age (in days) from the date the child was born, and estimated gestational week of blood sampling from the date of sampling. Gestational week of blood sampling ranged from week 5 (4 full wk + 0 d to 4 full wk + 6 d) to week 19 (18 + 0 to 18 + 6).
Laboratory procedures
TSH and fT4 were measured by ISO 15189 certified Dimension Vista automated immunoassays (Siemens Healthcare Diagnostics). For TSH, the functional sensitivity given by the manufacturer was 0.005 mIU/L, analytical measurement range 0.005–100 mIU/L, and interassay coefficient of variation 2.30%–3.06% for 5 concentrations in the range from 0.39 to 76.5 mIU/L. Reference range for nonpregnant adults was 0.358–3.74 mIU/L. For fT4, the analytical measurement range given by the manufacturer was 1.3–103 pmol/L, and the interassay coefficient of variation was 1.57%–2.81% for 5 concentrations in the range from 9.7 to 82.2 pmol/L. The reference range was 9.8–18.8 pmol/L. For both TSH and fT4, we assayed samples in random order and included internal and external controls. Analyses took place from January to August, 2015.
Statistical analyses
Results of TSH and fT4 analyses were reported as medians, 2.5th and 97.5th percentiles with 95% confidence interval (CI). MoMs for TSH and fT4 were calculated as the individual result divided by the median value in the specific week of gestation.
TSH showed skewed distribution (Supplemental Figure 1) also after log transformation but was normalized with square root transformation. fT4 showed normal distribution after log transformation. Predictors of TSH and fT4 in weeks 9–12 of pregnancy were evaluated in separate linear multivariate regression models with square root-transformed TSH and log transformed fT4 as dependent variables and maternal characteristics as categorical dichotomous independent variables (age at birth of the child, parity, year of blood sampling, smoking in pregnancy, geographical residence, origin, prepregnancy BMI, and prepregnancy alcohol intake). Significant predictors in the multivariate model were selected for univariate stratified analyses. Statistical analyses were performed using STATA version 11 (Stata Corp). The study was approved by the Danish Data Protection Agency (J.nr.2012-41-0046; J.nr.2012-41-0171) and the Danish Ethics Committee (N-20130054).
Results
Participant selection and characteristics
Figure 1 illustrates the selection of the 6671 healthy participants included in our study, and various characteristics of participants are depicted in Table 1. Early pregnancy blood sampling had taken place from 1997 to 2002, which is about the time of the initiation of the Danish iodine fortification of salt (27). We included geographical residence as a proxy variable for iodine intake. Danish ground water has different iodine contents that leads to geographical differences in iodine intake levels, and consequently in the occurrence of thyroid disorders (28). As expected from the time period of study and inclusion criteria, nearly all participants were of Danish ancestry.
Characteristics of 6671 Healthy Pregnant Women Included in the Present Study From the Danish National Birth Cohort
| n | % | |
|---|---|---|
| Maternal age at birth of the child (y) | ||
| Median (IQR) | 30 | (27–33) |
| <30 | 3289 | 49.3 |
| ≥30 | 3382 | 50.7 |
| Parity | ||
| Nulliparous | 3306 | 49.6 |
| Multiparous | 3365 | 50.4 |
| Year of blood sampling | ||
| 1997–2000 | 4761 | 71.4 |
| 2001–2002 | 1910 | 28.6 |
| Geographical residencea | ||
| East (mild ID) | 2500 | 37.6 |
| West (moderate ID) | 4144 | 62.4 |
| Smoking in the pregnancyb | ||
| No | 4908 | 73.6 |
| Yesc | 1761 | 26.4 |
| Prepregnancy alcohol intake (units per week)d | ||
| <1 | 2364 | 35.5 |
| ≥1 | 4295 | 64.5 |
| Prepregnancy BMI (kg/m2)e | ||
| Median (IQR) | 22.5 | (20.6–25.2) |
| <18.5 | 315 | 4.8 |
| ≥18.5 and <25 | 4526 | 68.9 |
| ≥25 and <30 | 1220 | 18.6 |
| ≥30 (obesity) | 503 | 7.7 |
| Originf | ||
| Born in Denmark | 6526 | 97.9 |
| Not born in Denmark | 142 | 2.1 |
IQR, interquartile range (25th–75th percentile); ID, iodine deficiency.
Information obtained from Statistic Denmark, missing (n = 27) not included.
Information self-reported in the pregnancy interview (did you smoke in the pregnancy? yes/no), missing (n = 2) not included.
Still smoking at the time of the interview (n = 1146).
Information self-reported in the pregnancy interview, missing (n = 12) not included.
Information from self-reported prepregnancy weight and height, missing (n = 107) not included.
Information obtained from Statistic Denmark, missing (n = 3) not included.
TSH and fT4 reference intervals
Results of TSH and fT4 analyses stratified according to week of pregnancy are shown in Table 2. From the weeks 5–6 level, median serum TSH gradually decreased to a new weeks 9–12 level and then increased again. The changes in median TSH were accompanied by similar changes in both the 2.5th and the 97.5th percentiles for TSH. Serum fT4 variations were reverse to those of TSH but much less pronounced (Table 2).
TSH and fT4 Reference Intervals for Each Gestational Week in 6671 Healthy Danish Pregnant Women
| Pregnancy Week | 5 | 6 | 7 | 8 | 9 | 10 | 11 | 12 | 13 | 14 | 15–19 |
|---|---|---|---|---|---|---|---|---|---|---|---|
| n | 142 | 497 | 884 | 1193 | 1287 | 1006 | 690 | 448 | 221 | 140 | 163 |
| TSH | |||||||||||
| 2.5th percentile | 0.69 | 0.57 | 0.32 | 0.20 | 0.13 | 0.061 | 0.066 | 0.093 | 0.10 | 0.14 | 0.24 |
| Median | 1.70 | 1.61 | 1.45 | 1.21 | 1.10 | 1.03 | 0.99 | 0.98 | 1.12 | 1.34 | 1.29 |
| 97.5th percentile | 3.84 | 3.47 | 3.68 | 3.46 | 3.41 | 3.27 | 3.09 | 3.37 | 3.12 | 3.85 | 3.29 |
| fT4 | |||||||||||
| 2.5th percentile | 11.52 | 11.58 | 11.74 | 11.88 | 11.87 | 12.07 | 12.02 | 11.84 | 11.61 | 11.23 | 11.52 |
| Median | 14.59 | 14.36 | 14.55 | 14.70 | 14.77 | 14.80 | 14.78 | 14.39 | 14.43 | 14.40 | 14.03 |
| 97.5th percentile | 17.63 | 18.36 | 18.40 | 18.58 | 18.93 | 19.16 | 18.81 | 18.69 | 17.60 | 17.99 | 17.98 |
Figure 2 left panel, illustrates the variation in TSH and in 95% reference limits for TSH in more detail. In particular, we estimated for the weeks indicated, the 95% CIs for median TSH as well as for 97.5th and 2.5th percentiles. Major differences were present in fractional variation when comparing 97.5th and 2.5th percentiles for TSH. From the pregnancy week 5–6 level to the week 9–12 level, the 97.5th percentile for TSH decreased with 8.5% and the 2.5th percentile with 84%. On the other hand, the absolute decreases measured in mU/L were more similar (0.30 mU/L for the 97.5th percentile and 0.50 mU/L for the 2.5th percentile).
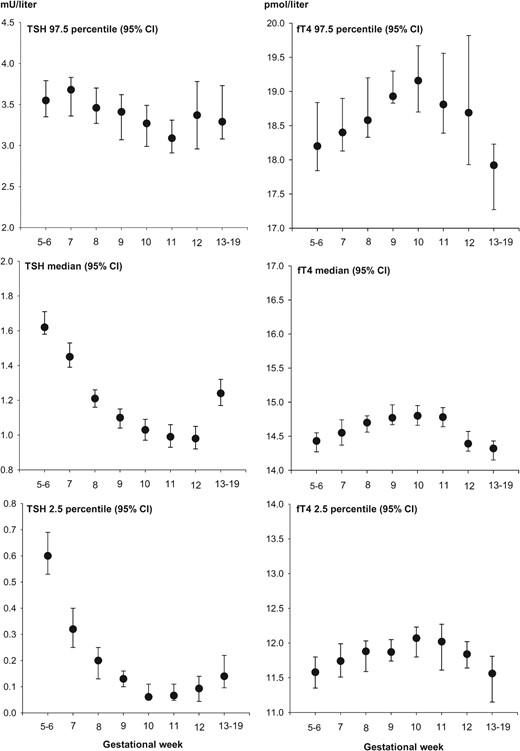
Serum TSH and fT4 variation according to gestational week in 6671 healthy Danish pregnant women.
Upper panels illustrate upper reference limits (97.5th percentiles) with 95% CI, and lower panels are lower reference limits (2.5th percentiles) with 95% CI. Please note the differences in ordinate scales. The number of participants in individual investigated groups are shown in Table 2. To include a minimum of 400 participants in each group, pregnancy weeks 5–6 and 13–19 were grouped as illustrated.
CIs for the week specific reference limits for fT4 are illustrated in Figure 2, right panel. From the pregnancy week 5–6 level to the week 9–12 level, the fT4 97.5th percentile increased with 4.1% and the 2.5th percentile increased with 3.3%. The corresponding absolute increases in fT4 concentration percentiles were 0.74 pmol/L (97.5th percentile) and 0.38 pmol/L (2.5th percentile).
Dynamic and stable phases of thyroid test references
To define reference intervals that might be useful in daily clinic, we tried to identify simple patterns of change in reference limits, that would fall within the 95% CIs depicted in Figure 2. For this analysis, we stratified early pregnancy into periods with relatively stable reference limits and with dynamic changes in reference ranges. The 2 stable periods were the “normal TSH period” that included gestational weeks 5–6, where nonpregnancy reference limits for TSH and fT4 values might be used, and the “low TSH period” that included gestational weeks 9–12, where TSH reference limits were lower and fT4 reference limits were slightly higher than nonpregnancy values. Between these 2 phases, a fall in TSH and slight increase in fT4 took place, and after the week 9–12 low TSH period, a new dynamic phase with an increase in TSH and a fall in fT4 started. Our data covering weeks 13–19 were limited (n = 524), but a positive correlation was observed between week of gestation in this period and serum TSH (r = 0.12, P = .008).
Considering the TSH 97.5th percentile change from week 6 (end of the normal TSH period) to week 9 (start of the low TSH period) this corresponded to a decrease of approximately 0.4 mU/L. During that same dynamic phase, the 2.5th percentile (corresponding to the lower reference range limit for TSH) decreased to around 0.1 mU/L. One intriguing detail of our results was the quite high 2.5th percentile values for TSH observed in gestational weeks 5 and 6 (0.69 and 0.57 mU/L, respectively) (Table 2).
Reverse changes in fT4 fitting the TSH pattern gave a gradual and approximate 4% increase in both upper and lower fT4 reference limits over the weeks 7–9, and this moderately higher level remained stable during the pregnancy weeks 9–12.
Multiples of the median
We explored the feasibility of using a uniform range of MoM values to identify “normal values” of TSH and fT4 in early pregnancy. As shown in Table 3, the 2.5th and 97.5th percentiles for TSH MoM values varied considerably as pregnancy progressed, with a considerably higher 97.5th percentile and a lower 2.5th percentile around week 10 than at the beginning and at the end of the first trimester. On the other hand, only small variations in fT4 MoM 2.5th and 97.5th percentiles over the weeks were observed (Table 3).
MoM With 95% CI for TSH and fT4 in 6671 Healthy Danish Pregnant Women
| Pregnancy Week | 5–6 | 7 | 8 | 9 | 10 | 11 | 12 | 13–19 |
|---|---|---|---|---|---|---|---|---|
| n | 639 | 884 | 1193 | 1287 | 1006 | 690 | 448 | 524 |
| TSH MoM | ||||||||
| 2.5th percentile | 0.37 | 0.22 | 0.16 | 0.12 | 0.059 | 0.066 | 0.095 | 0.11 |
| 95% CI | 0.33–0.43 | 0.17–0.27 | 0.11–0.20 | 0.094–0.14 | 0.048–0.11 | 0.049–0.11 | 0.045–0.14 | 0.078–0.17 |
| Median | 1.00 | 1.00 | 1.00 | 1.00 | 1.00 | 1.00 | 1.00 | 1.00 |
| 97.5th percentile | 2.19 | 2.54 | 2.86 | 3.10 | 3.18 | 3.12 | 3.44 | 2.65 |
| 95% CI | 2.07–2.34 | 2.32–2.64 | 2.70–3.05 | 2.79–3.29 | 2.90–3.39 | 2.94–3.35 | 3.02–3.86 | 2.48–3.01 |
| fT4 MoM | ||||||||
| 2.5th percentile | 0.80 | 0.81 | 0.81 | 0.80 | 0.82 | 0.81 | 0.82 | 0.81 |
| 95% CI | 0.79–0.82 | 0.79–0.82 | 0.79–0.82 | 0.79–0.82 | 0.80–0.83 | 0.79–0.83 | 0.81–0.84 | 0.78–0.82 |
| Median | 1.00 | 1.00 | 1.00 | 1.00 | 1.00 | 1.00 | 1.00 | 1.00 |
| 97.5th percentile | 1.26 | 1.26 | 1.26 | 1.28 | 1.29 | 1.27 | 1.30 | 1.25 |
| 95% CI | 1.24–1.31 | 1.25–1.30 | 1.25–1.31 | 1.27–1.31 | 1.26–1.33 | 1.24–1.32 | 1.25–1.38 | 1.21–1.27 |
Participant characteristics and reference ranges
Multivariate models indicated that TSH and/or fT4 values in pregnancy weeks 9–12 were significantly influenced by previous pregnancy, region of living in Denmark, prepregnancy BMI, and smoking habits. For some variables, CIs for TSH reference limits were overlapping after stratification according to these predictors (Table 4), but some differences of possible clinical importance were observed. Thus, the TSH 97.5th percentile was lower in multiparous women compared with women who were expecting their first child, and in women living in west Denmark (more iodine deficient) compared with women living in east Denmark. On the other hand, the TSH 97.5th percentile was higher in obese women than in nonobese women (Table 4). No significant difference in TSH was observed between smokers and nonsmokers, but fT4 was significantly lower in smokers (Table 4).
Predictors of TSH and fT4 in Gestational Week 9–12 (n = 3431) in Univariate, Stratified Analysis
| Multiparous (n = 1776) | Nulliparous (n = 1655) | P Valuea | |||
|---|---|---|---|---|---|
| TSH | |||||
| 2.5th percentile (95% CI) | 0.080 | (0.055–0.11) | 0.12 | (0.081–0.18) | <.001 |
| Median (95% CI) | 0.96 | (0.92–1.01) | 1.12 | (1.08–1.16) | |
| 97.5th percentile (95% CI) | 3.10 | (2.94–3.27) | 3.39 | (3.24–3.59) | |
| fT4 | |||||
| 2.5th percentile (95% CI) | 11.95 | (11.77–12.05) | 11.97 | (11.82–12.09) | .3 |
| Median (95% CI) | 14.72 | (14.64–14.84) | 14.73 | (14.63–14.87) | |
| 97.5th percentile (95% CI) | 19.12 | (18.76–19.43) | 18.87 | (18.65–19.14) | |
| Living in West Denmark (n = 2137)b | Living in East Denmark (n = 1281)b | P Valuea | |||
|---|---|---|---|---|---|
| TSH | |||||
| 2.5th percentile (95% CI) | 0.068 | (0.055–0.10) | 0.13 | (0.095–0.16) | <.001 |
| Median (95% CI) | 1.01 | (0.97–1.04) | 1.09 | (1.03–1.14) | |
| 97.5th percentile (95% CI) | 3.09 | (2.96–3.30) | 3.53 | (3.16–3.74) | |
| fT4 | |||||
| 2.5th percentile (95% CI) | 12.01 | (11.87–12.12) | 11.88 | (11.71–12.02) | .1 |
| Median (95% CI) | 14.76 | (14.68–14.88) | 14.70 | (14.59–14.83) | |
| 97.5th percentile (95% CI) | 19.10 | (18.81–19.28) | 18.85 | (18.51–19.11) | |
| BMI ≥30 kg/m2 (obesity) (n = 254)c | BMI <30 kg/m2 (n = 3113)c | P Valuea | |||
|---|---|---|---|---|---|
| TSH | |||||
| 2.5th percentile (95% CI) | 0.13 | (0.010–0.22) | 0.090 | (0.063–0.11) | .008 |
| Median (95% CI) | 1.16 | (1.00–1.28) | 1.03 | (1.01–1.06) | |
| 97.5th percentile (95% CI) | 3.45 | (3.14–3.89) | 3.20 | (3.06–3.37) | |
| fT4 | |||||
| 2.5th percentile (95% CI) | 11.67 | (10.22–12.10) | 11.97 | (11.88–12.07) | .06 |
| Median (95% CI) | 14.62 | (14.48–14.83) | 14.74 | (14.67–14.85) | |
| 97.5th percentile (95% CI) | 18.73 | (17.69–19.52) | 18.91 | (18.82–19.21) | |
| Smoking in Pregnancy (n = 850)d | Not Smoking in Pregnancy (n = 2580)d | P Valuea | |||
|---|---|---|---|---|---|
| TSH | |||||
| 2.5th percentile (95% CI) | 0.13 | (0.057–0.19) | 0.090 | (0.062–0.11) | .7 |
| Median (95% CI) | 1.03 | (0.97–1.09) | 1.04 | (1.01–1.08) | |
| 97.5th percentile (95% CI) | 3.02 | (2.84–3.38) | 3.31 | (3.13–3.50) | |
| fT4 | |||||
| 2.5th percentile (95% CI) | 11.80 | (11.57–12.00) | 12.01 | (11.91–12.10) | <.001 |
| Median (95% CI) | 14.48 | (14.34–14.62) | 14.84 | (14.74–14.94) | |
| 97.5th percentile (95% CI) | 18.34 | (17.78–18.81) | 19.11 | (18.87–19.37) | |
The table includes predictors, which were significantly associated with TSH and/or fT4 in a multivariate linear regression model, including all variables in the table as well as maternal age at birth of the child, year of early pregnancy blood sampling, maternal origin, and maternal prepregnancy alcohol intake.
P value is result of the independent Student's t test.
Missing (n = 13) not included.
Missing (n = 64) not included.
Missing (n = 1) not included.
Discussion
Principal observations
First trimester results of thyroid function testing in healthy pregnant women varied according to gestational week, and the use of one set of reference limits for the entire period would be a misleading simplification, even if results were converted to MoMs. For TSH, results suggested the use of nonpregnancy reference limits up to and including week 6 of pregnancy, the use of a 0.4 mU/L lower than nonpregnancy upper TSH limit during weeks 9–12, and a lower TSH reference limit of 0.1 mU/L during weeks 9–12. TSH may even be below 0.1 mU/L in weeks 10–11. fT4 variation was much smaller and results suggested the use of nonpregnancy reference limits except for 4% higher values during weeks 9–12. A number of participant characteristics influenced TSH reference limits, and this may be useful information when evaluating individual patients.
Comparison with other studies
Current guidelines from several international clinical societies (6, 7, 20) advocate the use of trimester specific reference ranges for thyroid function tests in pregnancy, and if such reference limits are not available to use a fixed TSH upper reference limit of 2.5 mU/L in the first trimester. In the present study, an upper TSH reference limit as low as 2.5 mU/L was not observed in any week of early pregnancy. The use of such limit would have classified 667/6671 (10%) of healthy participants to be hypothyroid, which is 4 times above the 2.5% that it should be according to the definition of reference limits. In the weeks 5–6 group 120/639 (19%) of participants would be diagnosed with hypothyroidism and in need of replacement therapy. Several recent studies have also concluded, that an upper TSH reference of 2.5 mU/L in the first trimester of pregnancy may lead to over diagnosing and over therapy, as recently reviewed by Medici et al (21).
An important finding of our study is that a uniform first trimester upper TSH reference limit, whether this is the 2.5 mU/L currently advocated or a higher value is not a sufficient description of “biochemical normality of thyroid function testing” in early pregnancy. TSH reference limits are highly variable in the first trimester, and results of studies on reference limits will depend on the distribution of gestational week in the women studied.
Many of the studies reporting on thyroid function tests in the first trimester of pregnancy did not cover the early weeks in detail (24, 29–31). However, studies that included gestational weeks 5–6 (23, 32, 33), observed considerably higher TSH values during these weeks, similar to the present study, and they support the use of nonpregnancy TSH reference limits until and including week 6. Nonpregnancy reference limits for total T4 and T3 may also be used during the first 6 weeks of pregnancy (19). After week 6, total T4and T3 limits start increasing with around 5% of nonpregnancy values per week of gestation until a new 50% higher stable level is reached at week 16. In contrast, fT4 limits showed only a small 4% increase in the present study, with the slightly higher levels in weeks 9–12.
Mechanisms involved
The main mechanism behind the lower TSH and higher fT4 reference limits in weeks 9–12 of pregnancy is undoubtedly the high hCG production in the placenta. hCG activates the thyroidal TSH receptor, and TSH and fT4 correlate to serum hCG levels (34), eg, the higher hCG levels of twin pregnancies are associated with lower TSH levels (35, 36).
During weeks 9–12, the thyroid-stimulating effect of hCG clearly dominates the increase in thyroid hormone metabolism caused by high utero-placental D3. However, we observed a relatively high TSH in weeks 5 and 6 of pregnancy, and we speculate if the D3 effect may overweigh the hCG effect in very early pregnancy. A profound increase occurs in the uterus content of D3 soon after egg implantation (11, 37), and studies of pregnant women performed in the United States (33) and China (23) also revealed a relatively high TSH in very early pregnancy. In contrast, a Finish study did not report higher than nonpregnancy TSH reference limits in the first pregnancy weeks (32). More studies on TSH variation in the first few weeks of pregnancy are needed.
Various individual characteristics influenced the TSH reference limits, as also observed in other studies (24, 32). The clinical relevance of adjusting limits according to such characteristics is unknown. For the time being, we suggest using overall limits according to pregnancy week, and to consider individual characteristics only in patients with borderline test results.
Implications for pregnancy outcome studies
Thyroid test results in pregnant women and their newborns are affected by complex physiology, and this may lead to misinterpretation (38). The utero-placental unit is very important for a successful pregnancy, and the unit also exerts strong effects on the maternal thyroid physiology in early pregnancy. Thus, associations between pregnancy complications and small aberrations in thyroid function in early pregnancy may not indicate a causal effect of the thyroid function but be due to confounding (8), and positive results of controlled intervention studies are necessary to prove causation. Another important consideration in association studies is time bias. Miscarriage is common in early pregnancy. Thus, miscarriage will be more common in women included in a study in pregnancy weeks 4–6, than in women included in weeks 7–8, and as illustrated by the results of the present study, serum TSH will be higher in the women included in weeks 4–6. Accordingly, women with miscarriage during follow up are likely to have had higher TSH at inclusion. Such bias may influence studies of association between small elevations in TSH in early pregnancy and miscarriage.
Study limitations
Participants were randomly selected among participants of a large population-based cohort study, but only part of Danish pregnant women had participated in DNBC, and serum for analyses was available in only 89% of the selected participants. This may have induced selection bias. We excluded 12.5% of the randomly chosen DNBC participants to establish reference ranges for healthy pregnant women. We had no results of thyroid antibody measurements to assist selection. Nearly all women were of Danish ancestry, and results may be different in other ethnic groups (39). We excluded women with TSH more than or equal to 4.5 mU/L (up to 80 mU/L) or fT4 more than or equal to 21 pmol/L (up to 42 pmol/L) (n = 148). If these participants were included, TSH 2.5th/97.5th percentiles were: weeks 5–6, 0.60/5.14 mU/L (95% CI 0.52–0.69/4.32–6.46) and weeks 9–12, 0.056/3.54 mU/L (0.048–0.077/3.36–3.74). The present study gave no information on the clinical relevance of the estimated reference limits, and the use of other analytical methods may lead to reference limits that are different (40).
Conclusion
TSH reference limits are highly variable during the first trimester of pregnancy. The use of uniform limits of TSH normality for the entire first trimester as advocated in several guidelines is an oversimplification that may lead to frequent misclassification. More studies are needed to expand knowledge on the clinical relevance of the reference range limits derived from testing of healthy pregnant women.
Acknowledgments
This work was supported by the Obel Family Foundation. This research has been conducted using the Danish National Biobank resource, which is supported by the Novo Nordisk Foundation. The Danish National Research Foundation has established the Danish Epidemiology Science Centre that initiated and created the Danish National Birth Cohort (DNBC), and the Cohort is furthermore a result of a major grant from the Novo Nordisk Foundation. Additional support for the DNBC is obtained from the Pharmacy Foundation, the Egmont Foundation, the March of Dimes Birth Defects Foundation, the Augustinus Foundation, and the Health Foundation.
Disclosure Summary: The authors have nothing to disclose.
Abbreviations
- BMI
body mass index
- CI
confidence interval
- D3
deiodinase type 3
- DNBC
Danish National Birth Cohort
- fT4
free T4
- hCG
human chorionic gonadotropin
- MoM
multiple of the median.
References
Author notes
P.L. and S.L.A. contributed equally to this work.
