


Abstract
Hip fracture incidence has been declining and life expectancy improving. However, trends of postfracture outcomes are unknown.
The objective of the study was to compare the refracture risk and excess mortality after osteoporotic fracture between two birth cohorts, over 2 decades.
Prospective birth cohorts were followed up over 2 decades (1989–2004 and 2000–2014).
The study was conducted in community-dwelling participants in Dubbo, Australia.
Women and men aged 60–80 years, participating in Dubbo Osteoporosis Epidemiology Study 1 (DOES 1; born before 1930) and Dubbo Osteoporosis Epidemiology Study 2 (DOES 2; born after 1930) participated in the study.
Age-standardized fracture and mortality over two time intervals: (1989–2004 [DOES 1] and 2000–2014 [DOES 2]) were measured.
The DOES 2 cohort had higher body mass index and bone mineral density and lower initial fracture rate than DOES 1, but similar refracture rates [age-standardized refracture rates per 1000 person-years: women: 53 (95% confidence interval [CI] 42–63) and 51 (95% CI 41–60) and men: 53 (95% CI 38–69) and 55 (95% CI 40–71) for DOES 2 and DOES 1, respectively). Absolute postfracture mortality rates declined in DOES 2 compared with DOES 1, mirroring the improvement in general-population life expectancy. However, when compared with period-specific general-population mortality, there was a similar 2.1- to 2.6-fold increased mortality risk after a fracture in both cohorts (age-adjusted standardized mortality ratio, women: 2.05 [95% CI 1.43–2.83] and 2.43 [95% CI 1.95–2.99] and men: 2.56 [95% CI 1.78–3.58] and 2.48 [95% CI 1.87–3.22] for DOES 2 and DOES 1, respectively).
Over the 2 decades, despite the decline in the prevalence of fracture risk factors, general-population mortality, and initial fracture incidence, there was no improvement in postfracture outcomes. Refracture rates were similar and fracture-associated mortality was 2-fold higher than expected. These data indicate that the low postfracture treatment rates are still a major problem.
Osteoporotic fractures represent a significant public health problem due to disability, increased risk of subsequent fracture, and premature mortality (1–4). Over the last 2 decades, the incidence of osteoporotic fracture, in particular hip fracture, appears to have declined significantly (5, 6). Additionally, overall life expectancy has improved, particularly in developed countries, due to an improvement in nutrition, health services, and the management of chronic diseases (5). However, it is unclear whether the factors that have contributed to the decline in initial fracture incidence and/or the improvement in medical care and overall survival have had any impact on the outcomes of osteoporotic fracture, such as the risk of subsequent fracture or premature mortality.
Studies from North America, Australia, and Europe have reported a decline in hip fracture incidence of 1%–4%/y, depending on country and study design (7–11), whereas several studies from Asia reported either a plateau or an increase in the hip fracture incidence (12–15). The reduction in fracture incidence observed in the Western countries is more consistent in women than men. Various explanations have been proposed for this trend including medical advancement and lifestyle and behavioral changes over the last few decades. For example, in a recent study from Oslo, Norway, the increase in the use of hormone replacement therapy between the 1970s and 1990s paralleled the decline in fracture incidence in postmenopausal women (16). A decade later, with increasing bisphosphonate use for fracture prevention, several studies have shown an association between increased bisphosphonate prescriptions and decline in hip fracture incidence (17, 18). Furthermore, fracture liaison services had been implemented in many countries in which a decline in hip fracture incidence has been reported, supporting an increase in medication prescribing (19, 20). However, the relationship between the increase in prescription medication and a decline in hip fracture incidence is only associative, and there is no evidence for a direct cause-effect relationship. In fact, several recent papers show that osteoporosis is still poorly managed in the community (21, 22). Thus, it is unclear whether improved medical treatment has indeed caused the decline in hip fractures in developed countries.
The last 2 decades have also been characterized by a significant increase in life expectancy, perhaps due to a better management of chronic diseases and cancer. However, it is unclear whether mortality risk after an osteoporotic fracture has similarly improved. A recent study from England reported an improvement in in-hospital hip fracture survival, which the authors linked to better timing of operative repair (23). However, several other studies have shown that 1-year mortality after a hip fracture has not improved over the last few decades (24–26).
There are far fewer data on other types of osteoporotic fractures including whether there is a similar decline in incidence or whether the outcomes of subsequent fracture risk and premature mortality have changed.
The aim of this study was to compare subsequent fracture and mortality risk after all types of initial osteoporotic fractures for two birth cohorts with similar age ranges from the Dubbo Osteoporosis Epidemiology Study (DOES): DOES 1 (born before 1930) and DOES 2 (born after 1930) over two periods of time 1989–2004 (DOES 1) and 2000–2014 (DOES 2).
Materials and Methods
Study population, setting, and design
This study includes two births cohorts recruited from the same area, with similar age (60–80 y) but separated on the basis of birth year (before 1930, and after 1930). The cohorts studied had a similar recruitment, aim, and design, as published previously (27). Briefly, the main aim of the study was to record all minimal trauma fractures, risk factors, and outcomes occurring in the community. Despite a similar recruitment and a similar follow-up time, the DOES 1 cohort is older than DOES 2. Due to this age difference, we restricted the population to an age range of 60–80 years and age standardized all rates. Thus, the study population consists of the entire Dubbo population (aged 60–80 y) over two study periods. The original cohort (DOES 1) included 3516 individuals (1915 women and 1601 men), whereas the second cohort (DOES 2) included 4166 individuals (2244 women and 1922 men). The cohorts were followed up prospectively over two similar intervals of time between 1989 and 2004 (DOES 1) and between 2000 and 2014 (DOES 2) (Figure 1).

Flow chart of participants for DOES 1 and DOES 2 cohorts.
This study has been approved by the St Vincent's Hospital Human Research Ethics Committee.
Fracture assessment and mortality data
All fractures occurring in the community were identified through the two (and more recently, three) radiological services in the city of Dubbo. There was a short interval of time between 2010 and 2014 when the radiological report from one of the private services could not be obtained systematically. However, the vast majority of fractures during this time would have been captured by the radiology service at Dubbo Base Hospital, which performed the bulk of the emergency x-rays and follow-up for any fracture that required orthopedic review. In addition, all subjects participating in the detailed study group (see below) were asked about fractures at their 2 yearly interviews, and these were subsequently verified. The circumstance surrounding the fracture was obtained by the study coordinator by direct interview. Only minimal trauma fractures such as those that result after a fall from a standing height or less were included in the study. High trauma fractures and pathological fractures (Paget's disease, metastatic cancer) were excluded. Fractures of the skull, fingers, and toes were also excluded from analysis. Fractures were analyzed in three groups: hip, vertebral, and nonhip, nonvertebral fractures. A further stratification of nonhip nonvertebral fractures into major (including all proximal fracture sites) and minor (including distal sites and clavicle) was used in the assessment of mortality risk.
Vertebral fractures were identified through x-ray reports, but there was no screen at baseline for vertebral deformities. Vertebral fractures were classified as clinical if there was a reason for the x-ray, such as back pain, or asymptomatic if there was no direct cause and a fracture was found incidentally on an x-ray for another cause.
Mortality status was identified using systematic searches of the funeral director lists, local newspapers, and Dubbo media reports and was verified by death certificates from the New South Wales Registry of Births, Deaths, and Marriages.
Detailed study group
Approximately 60% of the above-mentioned individuals in the community participated in a detailed ongoing assessment after signing an informed consent form. Individuals who participated in the detailed study attended a clinic visit at approximately 2-year intervals. Risk factors for fracture and osteoporosis including falls, medical history, and medication were collected and bone mineral density (BMD; femoral neck and spine) measured by dual-energy x-ray absorptiometry using a GE LUNAR densitometer and anthropometric measurements (height, weight) as well as muscle strength (quadriceps strength) and balance were measured.
Statistical analysis
Baseline characteristics were compared between the two cohorts using a Student's t tests for continuous variables and χ2 for categorical variables.
Incidence of initial osteoporotic fracture was calculated for the entire Dubbo population in the two time intervals: between 1989 and 1999 for the DOES 1 cohort and between 2000 and 2009 for the DOES 2 cohort. Incidence rates were calculated as the annual rate, dividing the fracture cases by the midyear population obtained from the Australian Bureau of Statistics. Fracture cases were then excluded from the population at risk for subsequent years. This methodology has been described in detail in a previous publication (3). The comparison between the incidence in initial fracture rate between DOES 1 and DOES 2 was performed directly by stratifying both cohorts to the 2005 Australian general population structure.
Absolute rates of subsequent fracture were based on the first subsequent fracture, assuming a Poisson distribution (3). In this analysis, time was calculated from the first osteoporotic fracture after the age of 60 years to the second fracture or death or end of the study (January 1, 2004, for DOES 1 or January 1, 2014, for DOES 2). The cohort difference in subsequent fracture rates between DOES 1 and DOES 2 was performed indirectly using the Mantel-Hansel method, which estimates the pooled age-adjusted rate difference using the weighted 5-year age strata derived from the two cohorts instead of a reference population.
Absolute mortality was assessed using Kaplan-Meier survival rates, separately for women and men and stratified according to the two cohorts. Mortality rates were calculated as the number of deaths per 100 person-years of follow-up. Time to follow-up was calculated from the date of the first osteoporotic fracture until death or the end of the study. To ascertain the change in the postfracture excess mortality risk, two age-adjusted general population mortality rates were constructed based on the yearly mortality rates for the intervals corresponding to the two fracture cohorts (1989–2000 and 2000–2010 for DOES 1 and DOES 2 cohort, respectively). Given that mortality rates in Dubbo were similar to that of other major cities, Australian general population mortality rates were used for this analysis (28).
Age-adjusted standardized mortality ratios (SMRs) were calculated for all types of fractures and separately for the three major fracture groups: hip, vertebral, and nonhip nonvertebral fracture for the two birth cohorts separately. The expected number of deaths was estimated using Australian mortality rates from the Australian Bureau of Statistics for the two follow-up periods. A direct comparison of DOES 1 and DOES 2 SMRs was obtained using Proc STDrate in SAS (SAS Institute). All statistical analyses were performed using SAS version 9.4.
Results
Characteristics of the study population
There were 538 individuals aged between 60 and 80 years with incident fracture (385 women and 153 men) in DOES 1 and 494 (337 women and 157 men) in DOES 2. Nonhip nonvertebral fracture represented approximately half of all fractures in both cohorts. However, the distribution of hip and vertebral fractures differed between the two cohorts. Hip fractures were more common in DOES 1 vs DOES 2 for women (12% vs 6%, P = .03) but not significant for men (14% vs 9%, P = .74), whereas vertebral fractures were more common in DOES 2 vs DOES 1 for both women (25% vs 37%, P = .005) and men (22% vs 44%, P = .0001) (Table 1).
Baseline Characteristics of the Participants With Incident Fractures (Detailed Study Group)
| DOES 1 | DOES 2 | |||
|---|---|---|---|---|
| Women | Men | Women | Men | |
| Number | 385 | 153 | 337 | 157 |
| Age, ya | 72 (5) | 72 (5) | 69 (5)b | 69 (4)b |
| Femoral neck BMD, g/cm2a | 0.74 (0.12) | 0.85 (0.18) | 0.82 (0.13)b | 0.90 (0.17)c |
| Weight, kga | 64 (12) | 76 (15) | 72 (15)b | 82 (13)c |
| Height, cma | 159 (6) | 171 (8)c | 160 (6) | 173 (6)c |
| BMI, kg/m2a | 25 (4) | 26 (4) | 28 (6)b | 27 (4)c |
| Fracture typed | ||||
| Hip | 48 (12) | 21 (14) | 21 (6)b | 14 (9) |
| Vertebral | 97 (25) | 34 (22) | 124 (37)b | 69 (44)b |
| Nonhip | ||||
| Nonvertebral | 240 (62) | 98 (64) | 192 (57) | 74 (47) |
| Antiresorptive medicationb | 3 (0.8) | 0 (0) | 61 (18)b | 12 (8)c |
Values represent mean (SD).
P < .0001.
P < .05 for the comparison between DOES 1 and DOES 2.
Number (percentage).
Most the participants from both cohorts participated in the detailed study (360 of 538 [67%] participants [260 women and 100 men] in DOES 1 and 282 of the 494 [57%] participants [206 women and 76 men] in DOES 2). Risk factors for fracture differed significantly between the two cohorts. Despite having the same age range of 60–80 years, individuals in DOES 1 were older and had lower femoral neck BMD and lower weight and body mass index (BMI) than DOES 2 (Table 1). This difference in the fracture risk factors between DOES 1 and DOES 2 was similar for both women and men.
The uptake of antiresorptive medication was also significantly different between these cohorts. In DOES 1 less than 1% of the women and no men were treated with bisphosphonates, compared with 18% of the women (n = 61) and 8% of the men (n = 12) in DOES 2. Most bisphosphonate treatment was initiated after the initial incident fracture (median 1.8 y [interquartile range 0.49–5.0]).
Incidence of initial and subsequent osteoporotic fracture
Initial fracture rates
All minimal trauma fractures in individuals aged between 60 and 80 years were recorded over two 10-year intervals: 1989–1999 for DOES 1 and 2000–2009 for DOES 2. This corresponded to 30 433 person-years of follow-up for DOES 1 (16 851 and 13 582 for women and men, respectively) and, given the larger population living in the Dubbo region, 35 381 person-years for DOES 2 (18 776 and 16 605 for women and men, respectively) (Figure 1).
To account for any age difference between the cohorts, fracture incidence was standardized to the 2005 Dubbo population. The age-adjusted standardized fracture incidence was significantly higher for DOES 1 than DOES 2 in women (22 fractures per 1000 person-years of follow-up [95% confidence interval [CI] 20–25] and 18 fractures per 1000 person-years [95% CI, 16–20] for DOES 1 and DOES 2, respectively; P = .01) and higher, but not significantly so, for men (11 fractures per 1000 person-years [95% CI 10–13] and nine fractures per 1000 person-years [95% CI 8–11] for DOES 1 and DOES 2, respectively; P = .09).
Subsequent fracture rates
There were 180 subsequent fractures (130 in women and 50 in men) for DOES 1 and 143 (99 in women and 44 in men) for DOES 2 over a similar follow-up (mean years [SD] 7.5 [4.2] for DOES 1 and 7.1 [3.5] for DOES 2).
After taking into account the difference in age, subsequent fracture rates were similar for the two cohorts for women (subsequent fractures per 1000 person-years: 51 [95% CI 41–60] vs 53 [95% CI 42–63], P = .75) and for men (subsequent fractures per 1000 person-years: 55 [95% CI 40–71] and 53 [95% CI 38–69], P = .85). This was true for all types of initial fracture (Table 2). The similarity in subsequent fracture rates was confirmed by the age-adjusted Cox proportional hazards model. The difference in age-adjusted subsequent fracture rates between the two cohorts ranged between 10% and 12% and was not significant (age adjusted hazard ratio [HR] 1.10 [95% CI 0.83–1.46] and 0.88 [95% CI 0.57–1.35] for women and men, respectively).
Age-Standardized Refracture Rates for DOES and DOES 2 Cohorts
| DOES 1 | DOES 2 | P Value | |||
|---|---|---|---|---|---|
| Subsequent Fractures, n | Rate (95% CI) | Subsequent Fractures, n | Rate (95% CI) | ||
| Women | |||||
| All fractures | 130 | 51 (41–60) | 99 | 53 (42–63) | .75 |
| Hip | 20 | 93 (37–149) | 11 | 186 (96–275) | .09 |
| Vertebral | 35 | 73 (49–97) | 37 | 55 (35–75) | .26 |
| Nonhip, nonvertebral | 75 | 40 (30–50) | 51 | 43 (32–55) | .69 |
| Men | |||||
| All fractures | 50 | 55 (40–71) | 44 | 53 (38–69) | .85 |
| Hip | 8 | 82 (20–122) | 6 | 97 (52–198) | .79 |
| Vertebral | 15 | 108 (27–161) | 17 | 55 (26–84) | .07 |
| Nonhip, nonvertebral | 27 | 42 (26–58) | 21 | 50 (29–70) | .57 |
Secular changes in absolute mortality postfracture and general population between 1989 and 2000 and between 2000 and 2010
General population
Mortality rates in the general Australian population declined considerably over the 2 decades studied: 1989–1999 and 2000–2010 for both women and men. For women, mortality rates decreased from 2.3 deaths per 100 person-years (95% CI 2.1–2.5) between 1989 and 1999 to 1.3 deaths per 100 person-years (95% CI 1.2–1.5) between 2000 and 2010. A similar trend of declining mortality over the last 2 decades was observed for men (3.9 deaths per 100 person-years [3.7–4.2] between 1989 and 1999 and 2.4 deaths per 100 person-years [95% CI. 2.2–2.6] between 2000 and 2010). Notably, the greatest improvement in survival was observed for the older age groups (70–79 y) in both women and men. For example, mortality was reduced by approximately 60% in both women and men in the 70–79 year age group compared with approximately 40% decrease for the 60–69 year age group.
Fracture cohorts
Similar to the general population improvement in survival, overall, absolute postfracture mortality rates were significantly lower in the DOES 2 fracture cohort compared with the DOES 1 fracture cohort for both women and men (Figure 2). However, despite the improvement in survival in both the general and fracture populations in DOES 2 compared with DOES 1, the DOES 2 fracture population still had a significantly higher mortality compared with the corresponding general population. The relative difference between the fracture and general population survival curves, in other words the divergence between the two curves, was greatest during the first 5 years after the fracture, and the magnitude of this divergence was similar for DOES 1 and DOES 2 (Figure 2). However, for the second half of the follow-up, the difference in survival between the fracture and general population in DOES 2 was not as pronounced as in DOES 1.
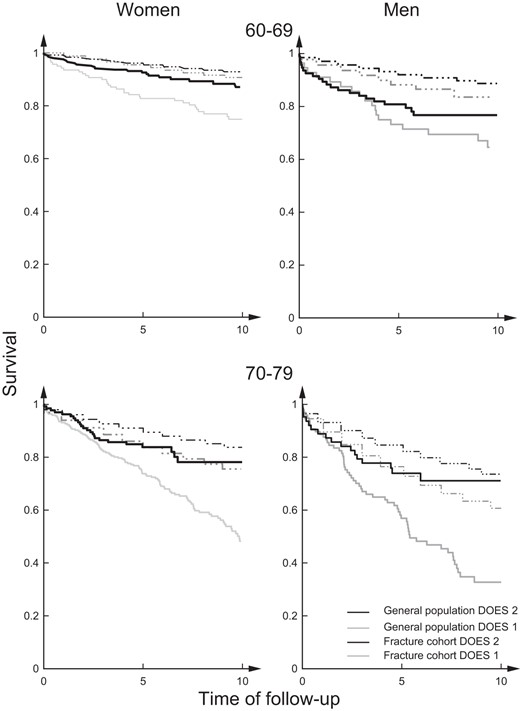
Kaplan-Meier survival curves for DOES 1 and DOES 2 fracture cohorts and age- and period-matched general population.
Men had higher absolute mortality rates than women in both the general and fracture population in both cohorts. However, both women and men experienced a similar decreasing trend of postfracture mortality, resulting in similar SMRs (age-adjusted SMRs: DOES 1: 2.48 [95% CI 1.87–3.22] and 2.43 [95% CI 1.95–2.99], and DOES 2: 2.56 [95% CI 1.78–3.58] and 2.05 [95% CI 1.43–2.83] for women and men, respectively).
The pattern of postfracture mortality depended on the fracture type (Figure 3). Interestingly, the greatest improvement in absolute postfracture survival was observed for vertebral fracture (Figure 3) and for nonhip nonvertebral fracture, particularly after 5 years or more after the fracture, whereas hip fracture mortality did not change.
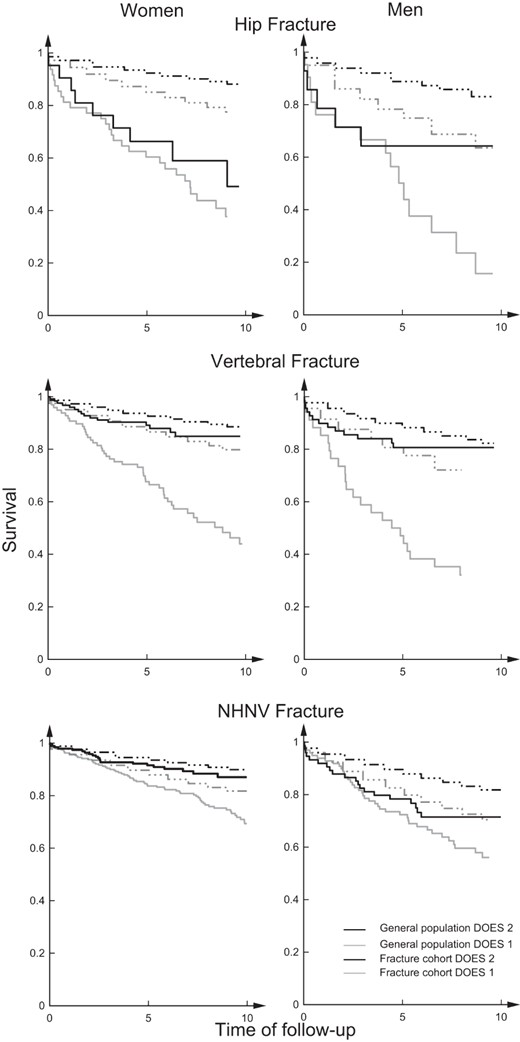
Kaplan-Meier survival curves for DOES 1 and DOES 2 fracture cohorts and age- and period-matched general population according to fracture type: hip fracture, vertebral fracture, and nonhip, nonvertebral fracture.
Thus, the improvement in the overall postfracture survival was driven by vertebral and nonhip nonvertebral fractures. Compared with DOES 1, survival for DOES 2 improved by 66% for vertebral fractures (age adjusted HRs vertebral 0.34 [95% CI 0.12–0.93]) and 54% for nonhip nonvertebral fractures (age-adjusted HR 0.46 [95% CI 0.22–0.97]). Survival posthip fracture also improved but not significantly (age adjusted HR.0.23 [95% CI 0.02–2.65] for DOES 2 vs DOES 1). A further stratification of the nonhip nonvertebral fractures by severity revealed that the improvement in the postfracture mortality was greatest and significant for minor fractures in women and major fractures in men.
Secular changes in relative postfracture mortality risk between 1989 and 2000 and between 2000 and 2010
To determine the secular changes in the excess mortality after the fracture, age-adjusted SMRs were calculated for absolute mortality observed for each fracture cohort vs the expected mortality rates of the general population corresponding to the 2 decades investigated. Importantly, despite the improvement in the absolute mortality rates discussed above, the overall age-adjusted SMRs were greater than 2-fold higher than expected for the first 5 years after the fracture in both DOES 1 and DOES 2 cohorts (Figure 4). Moreover, the age-adjusted SMRs were not significantly different between the two cohorts in either women (2.43 [95% CI 1.95–2.99] vs 2.05 [95% CI 1.43–283] for DOES 1 and DOES 2, respectively) or men (2.48 [95% CI 1.87–3.22] vs 2.56 [95% CI 1.78–3.58] for DOES 1 and DOES 2, respectively) (Figure 4).
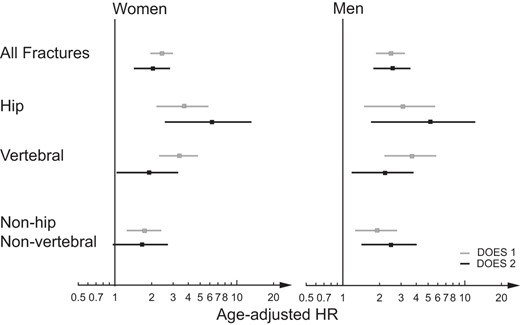
Age-adjusted SMR for the first 5 years after the fracture according to fracture type and gender.
There were no apparent differences between the patterns of excess mortality of the two cohorts according to the type of initial fracture (Figure 4).
Discussion
This is the first study to our knowledge to explore the secular changes in the total burden of postfracture outcomes of refracture and mortality over two nonoverlapping periods of time; 1989–1999 and 2000–2009 and two births cohorts of DOES 1 (born prior 1930) and DOES 2 (born after 1930). Despite a decline in the initial osteoporotic fracture rates, the absolute refracture rates were similar for the two cohorts. Excess mortality after the fracture was also similar for the two cohorts, after accounting for the overall population decline in mortality.
The novelty of this study lies in the examination of the postfracture outcomes after the osteoporotic fracture in two birth cohorts and over two distinct intervals of time. The decline in the initial fracture risk as well as in the absolute mortality rates may be explained by the differences in both cohort and period studied. The cohort effect was assessed by comparing the differences in the profile of fracture risk factors among two historical consecutive cohorts. Fracture risk factors profiles were significantly different among the two cohorts. Individuals in the DOES 2 cohort had a higher BMI and prevalence of obesity than those in the first cohort, presumably due to changes in nutrition and lifestyle. This increase in body weight may explain the significantly higher bone mass in the DOES 2 cohort compared with DOES 1. The period effect found in this study was predominantly that of the uptake of antiresorptive medication. In the current study, bisphosphonate use was almost absent (<1%) prior to 2000 and increased to greater than 20% in the subsequent decade (2000–2010). This finding is consistent with bisphosphonates becoming more available and widely used, particularly after 2000 (29). However, the study was not designed to examine the effect of these factors on the initial fracture incidence.
There was a decline in initial osteoporotic fracture incidence in DOES 2 compared with DOES 1. Similar to previous studies, the secular decline in the initial fracture rate was more marked for women than men and for hip fracture compared with nonhip fractures (6, 30). It is possible that the greater improvement in life expectancy in men led to a secular increase in the elderly male population at risk of hip fracture.
However, despite this decline in the initial fracture rates, the refracture risk was similar for the two cohorts. The reason for these high rates of refracture, despite a lower initial fracture incidence and a slight raise in bisphosphonate uptake in the second cohort, is unclear. It is possible that the better survival of DOES 2 compared with DOES 1 participants meant a higher number of participants survived the initial fracture and therefore were at risk of sustaining future fractures. The effect of bisphosphonates on subsequent fracture rates was previously ascertained in a fracture liaison service study (31). However, the major difference between our study and this fracture liaison study lies in the fact that, in the latter, all individuals were treated, whereas in ours only a small proportion (20%) received antiresorptive medication. Furthermore, given that this information was available on only 60% of the entire cohort, as few as 15% of the whole fracture cohort may have actually been on treatment. Thus, any effect of treatment may not have been detectable.
Consistent with the similar refracture risks for the two cohorts, postfracture mortality was also similar, particularly for the first 5 years after the fracture in both women and men after all types of fractures. Age-adjusted SMRs were approximately 2-fold higher compared with the nonfracture population for both cohorts, with higher SMRs for hip fractures and lower for nonhip nonvertebral fractures, as expected. Data on secular trends of mortality postosteoporotic fracture are scarce and available only for hip fracture. Several studies have reported a similar trend of stable 1-year mortality after hip fracture over the last 2 decades (24–26). However, a Norwegian study reported a decline in the excess mortality after hip fracture in patients older than 85 years. The difference from the Norwegian study and the current study is that the current study included younger participants (60–80 y), was conducted over a later time period, and had a shorter length of follow-up.
Notably, despite the high excess mortality after the fracture, the overall pattern of absolute mortality after the fracture declined over time for both cohorts, consistent with the decline in the population mortality over the time studied. Interestingly, although mortality after the fracture was similar in the first 5 years after the fracture, individuals in the DOES 2 cohort experienced lower mortality rates in the 5–10 years after the fracture compared with those in DOES 1. It is possible that this lower later mortality reflects the overall improvement in the life expectancy of the general population, whereas the higher earlier mortality reflects the nonchanging fracture-related mortality.
This study did not assess the differences in the specific causes of death after the fracture in the two cohorts. In a recent British study, the causes of death after hip fracture did not vary significantly between the two periods studied: 2001–2008 and 2009–2010 (24). The leading causes of mortality after hip fracture were cardiovascular, respiratory, and infections for both periods. The authors did not find any changes in the causes of deaths for the two time periods, except a nonsignificant decline in the mortality due to infectious diseases in women.
This study has a number of strengths. There was a thorough documentation of all incident fractures occurring in the Dubbo community for two birth cohorts over 2 consecutive decades. This resulted in a large and representative sample of fractures, which allowed for gender- and fracture-type stratification. The inclusion of two birth cohorts was unique and permitted the interpretation of results after allowing for differences in fracture risk factors.
However, there are some limitations. The population was almost entirely Caucasian and therefore may not be generalized to other populations. This study did not examine specific causes of death. However, death certificates are notoriously unreliable and unlikely to lead to significant new insights. The secular trend of postfracture outcomes could not be studied according to individual fracture types due to small number of fractures. It is possible that the assessment of vertebral fractures in the second cohort was influenced by study awareness, resulting in more fractures reported than earlier. This could explain the greater proportion of asymptomatic vertebral fracture in DOES 2 compared with DOES 1 and may explain the better outcomes observed in this fracture group.
In summary, this study demonstrated similar rates of refracture and excess fracture-associated mortality risk over a 20-year period of study (1989–1999 and 2000–2010). Despite a small reduction in the initial fracture rates, subsequent fracture remained elevated. Excess mortality also remained elevated across the period of study with an approximately 2-fold increased risk for both cohorts for the first 5 years after the fracture in both women and men and after all types of fractures. However, the second cohort had a better long-term survival compared with the first cohort, consistent with the improvement in the life expectancy of the general population. The reasons for the persistent poor outcomes after fracture are not clear but suggest that more intensive intervention in the prevention and treatment of osteoporotic fractures are required.
Acknowledgments
The study sponsors had no role in the study design; the collection, analysis, and the interpretation of the data; the writing of this report; or the decision to submit this paper for publication.
The authors are solely responsible for the contents of this paper and do not reflect the views of the National Health Medical Research Council.
This work was supported by the National Health Medical Research Council Australia Projects 1073430 (to D.B.), 1008219 (to J.R.C.), and 1070187 (to T.T., D.A., T.V.N., J.R.C., and J.A.E.). Other funding bodies are an Osteoporosis Australia-Amgen grant; the Bupa Health Foundation (formerly MBF Foundation); the Ernst Heine Foundation; and untied grants from Amgen, Merck Sharp & Dohme, Sanofi-Aventis, Servier, and Novartis.
Disclosure Summary: D.B., T.T., D.A. and T.V. N. have no competing interests to declare. J.A.E. has consulted for and/or received research funding from Amgen, deCode, Eli Lilly, Merck Sharp and Dohme, Novartis, Sanofi-Aventis, and Servier. J.R.C. has been supported by and/or given educational talks for Merck Sharp and Dohme, Amgen, and Sanofi-Aventis.
Abbreviations
- BMD
bone mineral density
- BMI
body mass index
- CI
confidence interval
- DOES
Dubbo Osteoporosis Epidemiology Study
- HR
hazard ratio
- SMR
standardized mortality ratio.
