


Abstract
Compelling evidence suggests that the beneficial effects of weight-loss diet interventions on improvement of cardiometabolic risk factors may be partly through modulating secretion of adiponectin from adipose tissue.
To investigate the effects of long-term weight-loss diets with different compositions of macronutrients on longitudinal changes in circulating adiponectin concentrations and how such changes, if they exist, affect cardiometabolic risk.
In the 2-year Preventing Overweight Using Novel Dietary Strategies trial, 811 overweight or obese adults were randomly assigned to 1 of 4 diets varying in macronutrient intakes. The current analysis was restricted to participants who had baseline adiponectin measurement (n = 768). Circulating concentrations of adiponectin and cardiometabolic outcomes were repeatedly measured at baseline, 6 months, and 2 years.
Circulating concentrations of adiponectin and cardiometabolic risk factors.
Weight-loss diet interventions significantly increased circulating adiponectin concentrations over 2 years, similarly in 4 diet groups (P value for difference >.05). We found that the increase of adiponectin was significantly associated with reduction of waist circumference and low-density lipoprotein cholesterol, but associated with increase of high-density lipoprotein cholesterol (P < .001 for each), after adjusting for age, sex, ethnicity, follow-up time, diet group, baseline body mass index, baseline level of respective outcome trait, and concurrent weight change.
Our findings indicate that long-term interventions by weight-loss diets varying in macronutrients similarly increase circulating adiponectin, which may particularly improve abdominal fat distribution and lipid metabolism independently of weight change.
Obesity is a major risk factor for various chronic diseases such as diabetes and coronary heart disease (1). Dietary interventions have shown effectiveness on weight loss and improvement of cardiometabolic risk factors (2–4). Although the underlying mechanisms remain unclear, growing evidence has suggested that the protective effect may be partly through modulating metabolism of adipose tissue (5–7). Beyond its role in storage of energy, adipose tissue is now recognized to be a key component of endocrine system and may regulate metabolism through secreting a group of bioactive molecules known as adipokines (8). Adiponectin is one of the best studied adipokines that possess beneficial effects on glucose and lipid metabolism, insulin sensitivity, inflammation, and vascular homeostasis (9–11).
Elevation of circulating adiponectin by either genetic or pharmacological approaches has shown effectiveness in preventing obesity and related cardiometabolic disorders (12–15). Several previous clinical trials have shown that weight-loss diets might improve longitudinal concentrations in circulating adiponectin (4, 16, 17), although the results were not entirely consistent (18, 19). Notably, these previous dietary intervention studies are largely limited by small sample size and/or short-term in intervention (20). Very few studies have assessed the long-term effect of weight-loss diets on longitudinal changes in adiponectin concentrations; and how such changes may affect dynamic changes in cardiometabolic risk. In addition, little is known about whether overweight people have a better response in the long-term adiponectin changes to weight-loss diets that emphasize a specific macronutrient composition.
In the 2-year Preventing Overweight Using Novel Dietary Strategies (POUNDS Lost) trial, thus far the longest and largest comparator study on weight-loss diets (3), we investigated the effects of long-term weight-loss diets with different compositions of macronutrients on changes in circulating adiponectin concentrations and their relations with changes in cardiometabolic risk factors over the intervention.
Materials and Methods
Study design and participants
The POUNDS Lost trial is a 2-year randomized, clinical trial to compare the effects of energy-reduced diets with different compositions of fat, protein, and carbohydrate on body weight. The study design, methods, and primary results have been described in detail elsewhere (3). Briefly, a total of 811 overweight and obese participants with a body mass index (BMI) of 25–40 kg/m2 and aged 30–70 years were randomly assigned to 1 of 4 diets: the target percentage of energy derived from fat, protein, and carbohydrate in the 4 diets were 20%, 15%, and 65% (low fat, average protein); 20%, 25%, and 55% (low fat, high protein); 40%, 15%, and 45% (high fat, average protein); and 40%, 25%, and 35% (high fat, high protein). Thus, 2 diets were low fat and 2 were high fat, and 2 were average protein and 2 were high protein, constituting a 2-by-2 factorial design. The 4 diets also allowed for a dose-response test of carbohydrate intake that ranged from 35% to 65% of energy. Each participant's caloric prescription represented a deficit of 750 kcal per day from baseline, as calculated from the person's resting energy expenditure and activity level. Major criteria for exclusion were the presence of diabetes mellitus treated with oral medications or insulin or unstable cardiovascular disease, the use of medications that affect body weight, and insufficient motivation as assessed by interview and questionnaire. Random assignments to 1 of 4 diet groups were generated by the data manager at the coordinating center on request of a study dietitian after eligibility of a participant was confirmed. The diets consisted of similar foods and met guidelines for cardiovascular health, and carbohydrate-rich foods with a low glycemic index were recommended in each diet. For the present study, we restricted to participants who had baseline adiponectin measurement (n = 768). The study was approved by the human subjects committee at the Harvard T.H. Chan School of Public Health and Brigham and Women's Hospital, by the Pennington Biomedical Research Center of the Louisiana State University System, and by a data and safety monitoring board appointed by the National Heart, Lung, and Blood Institute. All participants gave written informed consent.
Measurements of anthropometrics and dietary intake
In the morning before breakfast on 2 days at baseline, 6 months, and 2 years, body weight was measured by calibrated hospital scales and waist circumference was measured using a nonstretchable tape measure, 4 cm above the iliac crest. Height was measured at baseline. BMI was calculated as the weight in kilograms divided by the square of the height in meters. Dietary intake was assessed in a random sample of 50% of the participants, by a review of the 5-day diet record at baseline and by 24-hour recall during a telephone interview on 3 nonconsecutive days at 6 months and 2 years.
Measurements of adiponectin and other biomarkers
Fasting blood samples, 24-hour urine samples, and measurements of energy expenditure were obtained on 1 day, and blood pressure (BP) was measured on 2 days at baseline, 6 months, and 2 years. Resting metabolic rate and respiratory quotient were calculated based on oxygen consumption and carbon dioxide production during 30 minutes. Concentration of plasma adiponectin was measured at the clinical laboratory at the Boston Children's Hospital, using an ELISA from ALPCO Diagnostics as previously described (21). Concentrations of serum lipids, glucose, and insulin were measured at the Pennington Biomedical Research Center. Total cholesterol, high-density lipoprotein (HDL) cholesterol, low-density lipoprotein (LDL) cholesterol, and triglycerides were measured on the Synchron CX7 (Beckman Coulter). LDL cholesterol was calculated from the total cholesterol, HDL cholesterol, and triglyceride (22), except when triglycerides concentration exceeded 400 mg/dL, in which case, LDL cholesterol was measured directly on all samples of the participant. BP was measured with the use of an automated device (HEM-907XL; Omron). Glucose and insulin were measured using an immunoassay with chemiluminescent detection on the Immulite analyzer (Diagnostic Products Corp). For indicators of glucose-insulin homeostasis, we calculated homeostasis model assessment of insulin resistance (HOMA-IR) by fasting insulin (μU/mL) × fasting glucose (mg/dL)/(18.01 × 22.5) and HOMA of β-cell function (HOMA-β) by 3.6 × fasting insulin (μU/mL)/(fasting glucose [mg/dL] − 63). Biomarkers of nutrient intake were used to validate the self-reported adherence to macronutrient targets as follows: HDL cholesterol for carbohydrate, urinary nitrogen excretion for protein, and respiratory quotient for fat.
Statistical analysis
Adiponectin, fasting insulin, HOMA-IR, and HOMA-β were log-transformed before analysis to improve normality. We performed an intention-to-treat analysis, with zero change from baseline imputed for missing adiponectin data (3). We also conducted unimputed analysis by excluding participants with missing adiponectin data at 6 months or 2 years in sensitivity analysis. Interrelations between concentrations of adiponectin and cardiometabolic risk factors at baseline were evaluated by using Pearson correlation. We compared changes in adiponectin concentrations and cardiometabolic risk factors across diet groups at 6 months and 2 years using generalized linear models (PROC GLM). To evaluate whether the effects of diets on changes in adiponectin concentrations were modified by sex, we added an interaction term of diet group and sex, with statistical significance of multiplicative interaction determined by using the Wald's test. We also conducted longitudinal analyses to test the effect of diet composition on the trajectory of changes in adiponectin over time by adding interaction term of diet group and time point.
Linear mixed models (PROC MIXED) using variance components structure were applied to assess concurrent change in adiponectin in relation to trajectory of changes in cardiometabolic risk factors. The cardiometabolic risk factors included body weight, waist circumference, blood lipids, BP, and indicators of glucose-insulin homeostasis. Covariates in the model included age, sex, ethnicity, diet group, time, and baseline level of respective outcome trait. Results other than body weight were further adjusted for baseline BMI and concurrent weight change. To test whether the associations differ by sex or time, we added interaction terms of changes in adiponectin and sex or time point. In secondary analyses, we also used generalized linear models to assess the relations of changes in adiponectin with changes in cardiometabolic risk factors at 6 months and 2 years, respectively. All P values were nominal and 2 sided, and P < .05 was considered statistically significant. Statistical analyses were performed with SAS version 9.4 (SAS Institute, Inc).
Results
Baseline characteristics
Table 1 shows the baseline characteristics of the participants. The average age was 50.7 years; 63.8% of the participants were female and 79.3% were white. All participants were overweight or obese with a mean BMI of 32.6 kg/m2, and 35% of them were hypertensive; otherwise, the participants were healthy in general.
Baseline Characteristics of the Study Participants
| Characteristic | Values |
|---|---|
| Age, years | 50.7 ± 9.2a |
| Female, % | 63.8 |
| Race or ethnicity, % | |
| White | 79.3 |
| Black | 15.4 |
| Hispanic | 3.8 |
| Asian or other | 1.6 |
| Dietary intake per day | |
| Energy, kcal | 1971.5 ± 574.6 |
| CHO, % | 44.7 ± 7.5 |
| Fat, % | 37.0 ± 5.8 |
| Protein, % | 18.1 ± 3.3 |
| Weight, kg | 92.7 ± 15.5 |
| BMI, kg/m2 | 32.6 ± 3.9 |
| Waist circumference, cm | 103.2 ± 13.1 |
| Use of medication, % | |
| Antihypertensive agents | 27.6 |
| Lipid-lowering agents | 18.9 |
| Adiponectin median, IQR | 8.0, 7.0 |
| Hypertension, % | 35.0 |
| Systolic BP, mm Hg | 119.3 ± 13.4 |
| Diastolic BP, mm Hg | 75.3 ± 9.4 |
| Glucose, mg/dL | 91.5 ± 11.7 |
| Insulin median, IQR | 10.4, 8.4 |
| HOMA-IR median, IQR | 2.3, 2.1 |
| HOMA-β median, IQR | 1.3, 1.0 |
| Total cholesterol, mg/dL | 202.0 ± 36.6 |
| LDL cholesterol, mg/dL | 125.4 ± 31.8 |
| HDL cholesterol, mg/dL | 49.2 ± 14.3 |
| Triglycerides, mg/dL | 139.1 ± 79.4 |
| Resting metabolic rate, kcal/d | 1542.9 ± 297.5 |
| Respiratory quotient | 0.84 ± 0.04 |
Values are mean ± SD for continuous variables and percentage for categorical variables unless otherwise indicated.
At baseline, circulating adiponectin concentration was inversely correlated with weight, waist circumference, triglycerides, glucose, insulin, HOMA-IR, HOMA-β, and systolic and diastolic BP, with correlations ranging from −0.12 (systolic BP) to −0.30 (waist circumference) (Figure 1). Adiponectin concentration was also positively correlated with HDL cholesterol (r = 0.40) and total cholesterol (r = 0.09) but weakly correlated with LDL cholesterol (r = 0.04). The correlation coefficients were generally attenuated with additional adjustment for age and sex (data not shown).
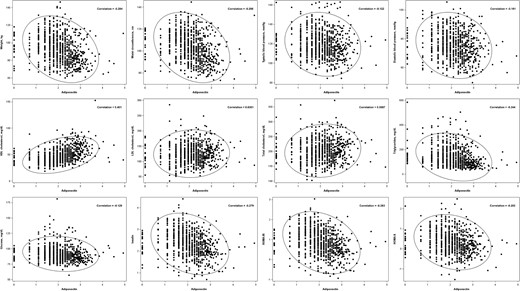
Pearson's correlation coefficients between concentrations of adiponectin and cardiometabolic risk factors at baseline.
Adiponectin, insulin, HOMA-IR, and HOMA-β were log transformed before analysis.
Effects of weight-loss diets on cardiometabolic risk factors
The effects of weight-loss diets on changes in body weight and other cardiometabolic risk factors have been reported previously (3). Briefly, most of the weight loss occurred in the first 6 months and participants regained body weight from 6 months to 2 years (Supplemental Table 1). In general, all diets reduced cardiometabolic risk factors over the intervention. At 2 years, the 2 low-fat diets decreased LDL cholesterol and total cholesterol more than did the high-fat diets (P = .006 and 0.01, respectively). No significant differences among diet groups were observed for weight loss and changes in other cardiometabolic risk factors.
Effects of weight-loss diets on circulating adiponectin
Adiponectin concentrations increased in response to weight-loss diets in all 4 intervention arms over 2 years (Table 2). As compared with baseline, the increase was statistically significant at 2 years but not 6 months. After adjustment for age, sex, ethnicity, baseline BMI, and baseline adiponectin concentration, increase of adiponectin concentration did not show statistically significant difference across the diet groups (P value for difference >.05). Although participants regained some of the lost weight from 6 months to 2 years, adiponectin concentrations continued increasing during the weight-regain phase, with expected greater changes after accounting for concurrent weight change. In longitudinal analyses, we did not observe any statistically significant interaction between diet group and time point (P value for interaction = .73), indicating that the effect of diet interventions on the trajectory of changes in adiponectin concentrations did not differ over time. Results were similar in unimputed analysis by excluding participants with missing adiponectin data at 6 months or 2 years.
Adjusted Mean Changes in Adiponectin Concentrations by Diet Groups at 6 Months and 2 Years
| High-Fat, High-Protein Group | High-Fat, Average-Protein Group | Low-Fat, High-Protein Group | Low-Fat, Average-Protein Group | P Value for Difference | P Value for Interaction | |
|---|---|---|---|---|---|---|
| Total population | ||||||
| 6 months | ||||||
| Model 1a | 0.05 ± 0.06 | 0.03 ± 0.06 | 0.05 ± 0.06 | 0.05 ± 0.06 | .98 | .05 |
| Model 2b | 0.08 ± 0.07 | 0.04 ± 0.06 | 0.07 ± 0.06 | 0.08 ± 0.06 | .92 | .06 |
| 2 y | ||||||
| Model 1a | 0.18 ± 0.06c | 0.12 ± 0.06c | 0.14 ± 0.06c | 0.09 ± 0.05 | .38 | .04 |
| Model 2b | 0.23 ± 0.07c | 0.17 ± 0.07c | 0.17 ± 0.06c | 0.15 ± 0.06c | .61 | .18 |
| Men | ||||||
| 6 months | ||||||
| Model 1a | −0.02 ± 0.08 | −0.02 ± 0.07 | 0.17 ± 0.08c | 0.05 ± 0.08 | .04 | NA |
| Model 2b | −0.02 ± 0.08 | −0.00 ± 0.08 | 0.19 ± 0.08c | 0.09 ± 0.08 | .04 | NA |
| 2 y | ||||||
| Model 1a | 0.13 ± 0.08 | 0.09 ± 0.08 | 0.30 ± 0.08c | 0.13 ± 0.08 | .05 | NA |
| Model 2b | 0.18 ± 0.10 | 0.16 ± 0.09 | 0.32 ± 0.10c | 0.16 ± 0.09 | .24 | NA |
| Women | ||||||
| 6 months | ||||||
| Model 1a | 0.09 ± 0.08 | 0.07 ± 0.08 | −0.00 ± 0.08 | 0.04 ± 0.08 | .57 | NA |
| Model 2b | 0.15 ± 0.10 | 0.10 ± 0.10 | 0.04 ± 0.09 | 0.08 ± 0.10 | .52 | NA |
| 2 y | ||||||
| Model 1a | 0.23 ± 0.08c | 0.17 ± 0.08c | 0.09 ± 0.08 | 0.08 ± 0.08 | .09 | NA |
| Model 2b | 0.30 ± 0.10c | 0.21 ± 0.09c | 0.14 ± 0.09 | 0.17 ± 0.09 | .21 | NA |
Data are expressed as adjusted least square mean ± SE for changes in adiponectin concentrations. Adiponectin concentrations were log transformed before analysis.
Adjusted for age, ethnicity, baseline BMI, and baseline adiponectin concentration. Results in the total population were further adjusted for sex.
Further adjusted for concurrent weight change.
Significant changes compared with baseline with P < .05.
We found that sex significantly modified the effects of weight-loss diets on changes in adiponectin at 2 years (P value for interaction = .04), which however did not withstand further adjustment for concurrent weight change (P value for interaction = .18). Men who were assigned to low-fat, average-protein diet group showed a greater increase in adiponectin concentrations, whereas women had better responses in adiponectin changes to the 2 high-fat diets.
Associations of changes in adiponectin with changes in cardiometabolic risk factors
We employed a longitudinal analysis by integrating 6-month and 2-year information to assess the multivariable-adjusted associations of concurrent changes in adiponectin concentrations with changes in cardiometabolic risk factors. Because changes in total cholesterol and LDL cholesterol were highly correlated in the study (Pearson r = 0.93; P < .001), we evaluated the independence of the associations between changes in adiponectin and these 2 outcomes by mutually adjusting for each other in the models. After adjustment for age, sex, ethnicity, follow-up time, diet group, baseline BMI, and baseline level of respective outcome trait, increase of adiponectin was associated with significant reduction of weight, waist circumference, LDL cholesterol, and HOMA-β (P < .01 for each) but significant increase of total cholesterol and HDL cholesterol (P < .001 for both).
With additional adjustment for concurrent weight change (Figure 2), the associations with waist circumference and blood lipids remained significant (P < .001 for each), whereas the association with HOMA-β was attenuated to be not significant. Notably, the associations with changes in HDL and LDL cholesterol were robust after a mutual adjustment for other biomarkers, whereas the association with changes in total cholesterol was greatly attenuated after adjusting for changes in HDL cholesterol. Increase of adiponectin was also associated with increase of glucose and systolic BP (P = .03 and 0.04, respectively); the positive association with systolic BP, but not glucose, became nonsignificant when adjusting for other biomarkers. Changes in adiponectin were not significantly associated with changes in other cardiometabolic risk factors including triglycerides, insulin, and HOMA-IR. We also found that sex significantly modified the association between changes in adiponectin and weight (P value for interaction = .02) but not other cardiometabolic risk factors. Increase of adiponectin was associated with greater reduction of body weight in men (β = −1.59, P = .001) than women (β = −0.88, P < .001).
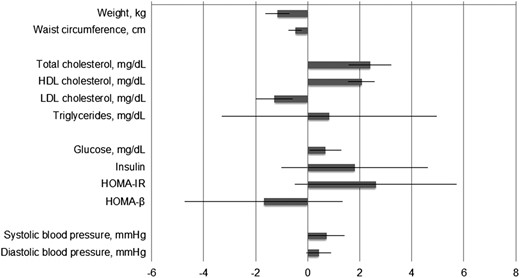
Change in cardiometabolic risk factors for 1 unit concurrent change in adiponectin concentration.
Adiponectin, insulin, HOMA-IR, and HOMA-β were log transformed before analysis. Associations were assessed by using linear mixed model integrating 6-month and 2-year information with adjustment for age, sex, ethnicity, time, diet group, and baseline value of respective outcome trait. Results for cardiometabolic risk factors other than weight were further adjusted for baseline BMI and concurrent weight change. Results for total cholesterol and LDL cholesterol were further mutually adjusted. Regression coefficients for insulin, HOMA-IR, and HOMA-β were scaled by 100 for a better presentation.
The interaction between changes in adiponectin and time point was significant for weight, HOMA-IR, and systolic and diastolic BP (P value for interaction = .002, .03, .009, and .03, respectively). In secondary analyses on the associations between changes in adiponectin and changes in cardiometabolic risk factors at 6 months and 2 years separately (Supplemental Table 2), we found that increase of adiponectin was associated with decreased weight at 2 years, but not 6 months, whereas increase of adiponectin was associated with decreased waist circumference at both 6 months and 2 years. The positive association with changes in HDL cholesterol was significant at both time points, whereas the inverse association with changes in LDL cholesterol became statistically nonsignificant at 2 years.
Discussion
In this 2-year randomized controlled trial, we found that weight-loss dietary intervention significantly increased circulating adiponectin concentrations over time, regardless of macronutrient composition of the diets. The increase of adiponectin concentration was significantly associated with reduction of waist circumference and LDL cholesterol, as well as improvement of HDL cholesterol. The associations of adiponectin with central adiposity and the lipid profile were independent of weight change.
Our findings that weight-loss diets increased circulating adiponectin are consistent with the results from some (4, 16, 17, 23–25) but not all (18, 19, 26, 27) previous clinical trials. Variations in sample size, duration of intervention, degree of calorie restriction, and body weight reduction achieved may partly explain the inconsistent findings. Our results expand previous findings by using the largest and longest dietary intervention currently published, and incorporating a thorough comparison of major weight-loss diets varying in macronutrient composition. We also assessed time-course effects on circulating adiponectin by using repeated measurements over 2 years of intervention. Notably, most those previous studies showed short-term effects of dietary interventions, whereas our data indicated that the long-term (2-y) dietary effects on improvement of adiponectin were even stronger regardless weight regain. Our findings refute the previous postulations that the effects of weight loss interventions on adiponectin concentration might be short term (within the first few months of intervention) (28). It has been reported that adipose tissue mRNA expression of adiponectin increased in response to a calorie-restricted diet (29). We found that the increase of adiponectin level was independent of weight change, suggesting that weight-loss diets might alter the secretion of adiponectin through mechanisms beyond alterations of the amount of body fat.
Among various cardiometabolic risk factors tested, including blood lipids, BP, and indicators of glucose-insulin homeostasis, increase of adiponectin showed the strongest and most robust associations with elevation of HDL cholesterol and reduction of LDL cholesterol. The positive association with changes in total cholesterol might be largely driven by changes in HDL cholesterol. These data provide support for the potential role of adiponectin in the regulation of lipid metabolism. The close connections between adiponectin, HDL, and LDL have been reported previously in observational studies (30–32). For example, serum adiponectin concentrations were positively correlated with the cholesterol content in large LDL and HDL particles, but inversely correlated with the cholesterol content in large very-low-density lipoprotein and small LDL particles (30). The association between adiponectin and coronary heart disease was attenuated or even abrogated by adjusting for HDL and LDL cholesterol (31, 32). In addition, among overweight or obese subjects with type 2 diabetes, changes in adiponectin mediated the effect of intensive lifestyle intervention on the increase of HDL cholesterol (33), further raising the possibility that elevation of adiponectin could lower cardiometabolic risk mainly through improvement of HDL cholesterol.
The biological mechanisms linking adiponectin and lipid metabolism have not been fully understood. By activating AMP-activated kinase and peroxisome proliferator-activated receptor, adiponectin increases free fatty acid oxidation, improves insulin sensitivity, and reduces triglyceride, all of which may influence HDL and LDL cholesterol concentrations. However, the observation that changes in adiponectin were related to changes in HDL and LDL cholesterol independently of changes in body weight, triglycerides, and insulin resistance implied that adiponectin might affect lipids through other pathways. As an important antiatherogenic factor, HDL plays a crucial role in removing excess cholesterol from peripheral tissues and transporting it back to the liver by reverse cholesterol transport. In fact, experimental evidence has suggested that adiponectin could accelerate reverse cholesterol transport by increasing cholesterol efflux from macrophages and increasing HDL assembly through ATP-binding cassette transporters pathway and apolipoprotein A-1 synthesis in the liver (34–37). Taken together, we postulate that the protective effects of adiponectin on cardiometabolic risk are mainly through favorable changes in HDL metabolism.
Our data indicated that increase of circulating adiponectin was related to reduction of overall and abdominal adiposity. The inverse correlation of circulating adiponectin with BMI and waist circumference was well documented in previous cross-sectional studies (38–40). Adiponectin may induce weight loss by stimulating glucose utilization and fatty acid oxidation in peripheral tissues (13, 41) and affect energy expenditure by targeting the central nervous system and increasing oxygen consumption and thermogenesis (42). Comparing males with females, the greater reduction of body weight associated with increase of adiponectin was consistent with findings from a recent report, highlighting potential sex differences in the associations (43). In our study, the relation between increase of adiponectin concentrations and reduction of waist circumference was independent of weight change, suggesting that adiponectin may particularly affect abdominal fat distribution presumably through mechanisms different from those influencing overall adiposity. Further experimental studies are warranted to verify these postulations. Despite the role of adiponectin in regulating BP and sensitizing insulin (10, 11), we did not link changes in adiponectin to changes in BP and insulin sensitivity. These data suggest that adiponectin may not be involved in the regulation of weight-loss diet-induced improvement of BP or glucose-insulin homeostasis.
To the best of our knowledge, the current study is the first to explore not only the effects of weight-loss diets with different macronutrient compositions on dynamic changes in circulating adiponectin, but also their relations with changes in cardiometabolic risk factors in a long-term diet intervention. The major strengths of our study include the use of thus far the largest and longest dietary comparator trial on weight-loss diets, and analyses of dynamic changes in circulating adiponectin and cardiometabolic risk factors using repeated measurements over 2 years of intervention. It is recently suggested that analyses of concurrent changes in lifestyle factors and metabolic outcomes could provide more consistent, statistically robust, and biologically plausible relationship (44). Therefore, our data on dynamic changes in adiponectin and cardiometabolic risk factors are optimal to inform the biological plausibility of their relations. However, we acknowledge that the associations described do not establish causality. Several potential limitations should be considered. First, even though the current study focused on adiponectin, we acknowledged that ghrelin and other adipokines such as leptin, which were unfortunately not available in our study samples, might be also closely related to weight loss and cardiometabolic changes. A more thorough assessment of these biomarkers is needed to further expand our understanding of their roles in improvement of cardiometabolic profiles in the context of dietary interventions. Second, we tested the associations between adiponectin and multiple traits of cardiometabolic risk factors, leading to multiple statistical comparisons. However, the analysis was based on an a priori hypothesis driven by effects of adiponectin, which is biologically plausible. Third, most of the participants (80%) in our study are white, and the participants of our study are overweight or obese; therefore, future studies are warranted to investigate whether the findings are applicable to general populations, especially those with different ethnicities. Finally, the power to detect a long-term effect of real differences in macronutrients intake was reduced because the adherence to various diets declined after 6 months.
In conclusion, we found that long-term weight-loss diets favorably increased circulating adiponectin concentrations, which might benefit the improvement of body adiposity, abdominal fat distribution, and lipid profiles. Our findings highlight the potential of elevating adiponectin through dietary modification as an important intervention approach against obesity and obesity-related disorders. Clinicians should recommend weight-loss diets to overweight or obese patients in order to achieve cardiometabolic benefit in the long term.
Acknowledgments
We thank all participants in the POUNDS Lost trial for their dedication and contribution to the research. ClinicalTrials.gov identifier, NCT00072995.
Author contributions: W.M. performed study concept and design, statistical analysis, interpretation of the data, drafting of the manuscript, critical revision of the manuscript for important intellectual content, and approval of the final manuscript for submission; T.H. and Y.Z. performed statistical advice, interpretation of the data, critical revision of the manuscript for important intellectual content, and approval of the final manuscript for submission; M.W., G.A.B., and F.M.S. performed critical revision of the manuscript for important intellectual content and approval of the final manuscript for submission; and L.Q. performed study concept and design, statistical advice, interpretation of the data, drafting of the manuscript, critical revision of the manuscript for important intellectual content, and approval of the final manuscript for submission. L.Q. will take full responsibility of the work.
The study was supported by National Heart, Lung, and Blood Institute Grants HL071981, HL034594, and HL126024; National Institute of Diabetes and Digestive and Kidney Diseases Grants DK091718, DK100383, and DK078616; the Boston Obesity Nutrition Research Center Grant DK46200; and the United States–Israel Binational Science Foundation Grant 2011036. L.Q. was a recipient of the American Heart Association Scientist Development Award (0730094N).
Disclosure Summary: The authors have nothing to disclose.
Abbreviations
- BMI
body mass index
- BP
blood pressure
- HDL
high-density lipoprotein
- HOMA-β
HOMA of β-cell function
- HOMA-IR
homeostasis model assessment of insulin resistance
- LDL
low-density lipoprotein
- POUNDS Lost
Preventing Overweight Using Novel Dietary Strategies.
