


Abstract
Administration of ghrelin inhibits the acute insulin response to glucose and worsens IV glucose tolerance in healthy subjects. Evidence from preclinical studies suggests that ghrelin may have differential effects on glucose metabolism during fasting and feeding. Our objective was to test the effects of ghrelin on glucose and insulin responses during a meal tolerance test.
Acyl ghrelin (0.26 and 2.0 μg/kg/h) or saline was infused in 13 healthy subjects on three separate occasions in randomized order. Ghrelin was infused for 45 minutes to achieve steady-state levels and continued for 240 minutes after ingestion of a liquid test meal. Primary outcomes were area under the curve for glucose and insulin secretion.
We found that ghrelin infusions of 0.26 and 2.0 μg/kg/h raised steady-state plasma total ghrelin levels to 1.7- and 4.8-fold above fasting concentrations, but did not alter fasting plasma glucose or insulin levels. During the meal tolerance test, ghrelin decreased insulin sensitivity, impaired β-cell function, and induced glucose intolerance. The high-dose ghrelin infusion also raised postprandial glucagon like peptide 1 secretion without affecting glucose dependent insulinotropic polypeptide, glucagon, or peptide YY concentrations.
We conclude that both physiologic and pharmacologic doses of ghrelin worsen the glucose and β-cell responses to meal ingestion in healthy humans. The increase in postprandial glucagon like peptide 1 secretion by ghrelin suggests a novel enteroendocrine connection, but does not mitigate the glucose intolerance.
Ghrelin is a small peptide secreted into the circulation primarily from neuroendocrine cells in the gastric mucosa that stimulates GH secretion and hunger (1, 2). Two ghrelin isoforms, acyl- and desacyl-ghrelin, are detectable in the circulation, with acylation acknowledged to be necessary for activation of the ghrelin receptor (1). Small amounts of ghrelin are also produced in endocrine ϵ cells in the pancreatic islet (3). The ghrelin receptor, also called the GH secretagogue receptor, and the enzyme ghrelin O-acyl-transferase (4, 5) that acylates ghrelin are expressed in human or rat pancreatic islets (6, 7). Preclinical studies suggest a direct effect of ghrelin to suppress insulin secretion and impair glucose tolerance (8, 9), findings we and others have replicated in humans (10–13). In these studies, we observed that infusion of exogenous acyl ghrelin to periphysiologic and pharmacologic doses suppressed glucose-stimulated insulin secretion (GSIS) and worsened IV glucose tolerance in healthy humans (12), whereas desacyl ghrelin had no effect (13). However, it was not clear whether acyl ghrelin would have the same effects on insulin secretion and glucose tolerance after a mixed meal when incretin hormones are at play.
Plasma ghrelin levels peak before meals and decline to a nadir during the hour after eating, with changes varying 2- to 3-fold across the fasting-feeding cycle in healthy subjects (14). In contrast, secretion of most gastrointestinal hormones increase after eating. For example, glucagon like peptide 1 (GLP-1), peptide YY (PYY), and glucose dependent insulinotropic polypeptide (GIP) peak in the hour after meals and play roles in postprandial nutrient metabolism (15, 16). In fact, many of the physiological functions of GLP-1 appear to oppose those of ghrelin. For example, GLP-1 enhances insulin secretion, delays gastric emptying, and reduces food intake in the postprandial period (17), whereas ghrelin suppresses insulin secretion, speeds gastric emptying, and stimulates food intake (18). Of note, administering ghrelin before an oral glucose load has recently been shown to improve glucose tolerance and stimulate postprandial GLP-1 secretion in rodents (19). However, the interplay between ghrelin and other gut peptides in humans is not well-understood. In the present study, we examined the effect of ghrelin administration on glucose tolerance, β-cell function, insulin sensitivity, and incretin hormone secretion during a mixed meal.
Patients and Methods
Subjects.
Healthy volunteers between the ages of 19 and 31 years with a body mass index (BMI) between 18 and 29 kg/m2 were recruited from the greater Cincinnati area. Subjects with a history or clinical evidence of impaired fasting glucose or diabetes mellitus, active medical problems or endocrinopathies, or who were on medications known to alter glucose metabolism were excluded.
All study procedures were conducted at the Cincinnati Children's Medical Center Clinical and Translational Research Center. All study participants gave informed consent for the study by signing a form approved by University of Cincinnati and Cincinnati Children's Medical Center Institutional Review Boards. Synthetic acyl-ghrelin is used under a research Investigational New Drug (79009) from the US Food and Drug Administration.
Experimental protocol.
Subjects arrived at the Clinical and Translational Research Center between 7:30 and 8:00 am after a 10–12 hour fast on three occasions separated by at least 1 week. IV catheters were placed in veins of both forearms for blood sampling and infusion of test substances. The arm with the sampling catheter was placed in a 55 C chamber to arterialize venous blood.
Synthetic human acyl-ghrelin (referred to henceforth as ghrelin for simplicity) was obtained from Bachem, as detailed previously (20). On the morning of the three study days, infusions of either saline or synthetic ghrelin, at doses of 0.26 or 2 μg/kg/h (equivalent to 0.1 or 0.6 nmol/kg/h), were started at time –45 and continued for 285 minutes. Treatments were allocated to the subjects in a randomized order, and study visits were separated by at least 1 week. Based on previous reports, the 0.26 μg/kg/h dose was expected to raise total ghrelin level to less than 2 times the normal preprandial level that can be seen in physiologic states such as fasting (14), whereas the 2 μg/kg/h dose is one we have documented to suppress IV GSIS (12).
Following 45 minutes of ghrelin infusion, sufficient to reach a steady state (20), subjects consumed a liquid mixed nutrient meal consisting of 45% carbohydrate, 15% protein, and 40% fat over 10 minutes (time = 0). Thereafter, a total of 20 blood samples were obtained at scheduled time points throughout an additional 180 minutes. Tubes contained 5 μL of aprotinin for every 50 μL of blood and 4 mM 4-(2-Aminoethyl) benzenesulfonyl fluoride hydrochloride; 100 μL 1 N hydrochloric acid was added to every milliliter of plasma for ghrelin measurement. Blood samples were placed on ice and plasma separated by centrifugation within 1 hour; plasma or serum were stored at –80 C until assay. Vital signs were monitored every 15 minutes during the study procedure.
Plasma samples from one of our previous studies using a ghrelin infusion rate of 2 μg/kg/h to healthy humans during an IV glucose stimulus (12) were assayed to test the effects of ghrelin on GLP-1 release in the fasting state.
Assays.
Details of biochemical assays were described previously (20). Briefly, blood glucose concentrations were determined at the bedside using a glucose analyzer (YSI 2300 STAT Plus; Yellow Springs Instruments). Plasma immunoreactive insulin and C-peptide levels were measured using a double-antibody RIA (21). Total GLP-1, GIP, glucagon, PYY, and pancreatic polypeptide were measured by ELISA, as previously described (22). Serum leptin level was measured using a commercial kit (MSD). Total immunoreactive ghrelin was measured by RIA according to the manufacturer's recommendations (20). Separate measures of acyl- and desacyl-ghrelin used sensitive and specific two-site sandwich ELISAs, as previously described (23). Serum concentrations of human GH were measured by a sandwich immunoassay using the automated Immulite 2000 chemiluminescent assay system (Siemens) (20). Cortisol levels were measured using the Corti-Cote RIA kit (MP Biomedicals). Triglycerides were measured with an enzymatic assay from Randox Laboratories. Free fatty acids (FFAs) were determined with a colorimetric assay from Wako Chemicals. All samples were run in duplicate, and all specimens from a given participant were run in the same assay.
Calculations.
Fasting values of insulin and glucose were taken as the mean of samples drawn before ghrelin infusion, and basal levels from –15 to 0 minutes before the meal tolerance test (MTT). Integrated values of glucose, insulin, C-peptide, GLP-1, and GIP were expressed as area under the response curve (AUC) over the level before meal ingestion. Insulin secretion rate (ISR) was derived from plasma C-peptide concentrations using a deconvolution model with population estimates of C-peptide (24) using MLAB (Civilized Software Inc). To correct for differences in postprandial glucose among the three conditions, insulin secretion in response to the meal was summed as δAUC ISR/δAUC G0–180min. Insulin sensitivity during the meal was computed with the oral glucose insulin sensitivity (OGIS) index (or insulin resistance as 1/OGIS) (25, 26). Because changes in insulin sensitivity can influence β-cell response, we computed the insulin secretion-to-insulin resistance ratio as (δAUC ISR/δAUC G0–180min) × OGIS0–180min (26). Insulin clearance was calculated for both fasting and fed states by dividing ISR by fasting insulin and AUC ISR0–180min by AUC Insulin0–180min, respectively (27).
The pharmacokinetic data were analyzed by both compartmental and noncompartmental analysis using WinNonlin 5.2 (Pharsight Inc.). Peak plasma levels of acyl ghrelin and desacyl ghrelin (Cmax) were estimated. AUC0-last was calculated by dividing the last measured concentration by γ (elimination rate constant, obtained from slope of terminal log-linear portion of concentration vs time curve).
Statistical analysis.
The primary analysis was the comparison of insulin secretion and insulin sensitivity measures between ghrelin and saline infusions. Secondary analysis included ghrelin effects on postprandial islet hormone and gut hormone secretion. These comparisons were made using ANOVA with three treatment levels (control and ghrelin infusion rates of 0.26 and 2 mg/kg/h) and time of sampling as a repeated measure. Dependent variables included the primary and secondary outcome measures listed previously. AUC of outcome variables of interest for the three treatment levels were compared using a single-factor ANOVA. A nonparametric variation of the ANOVA model (Friedman test) was used when a significant departure of the data from parametric assumption was noted. Dunnett's multiple comparison test was used for post hoc analysis. Data were analyzed using GraphPad Prism, version 6.0 (GraphPad Software). All results are expressed as mean ± SEM or median (interquartile range) unless otherwise noted.
Results
Subject characteristics.
Thirteen healthy subjects (eight males and five females) aged 23.7 ± 0.8 years with a BMI of 24.0 ± 0.8 kg/m2 completed the study. The mean fasting blood glucose for the group was 5.3 ± 0.2 mM; the mean fasting plasma insulin was 60.8 ± 5.9 pM.
Ghrelin pharmacokinetics.
At baseline, plasma acyl- and desacyl-ghrelin concentrations were 78.4 ± 55 and 98.5 ± 61 pg/ml, respectively, corresponding to an acyl:desacyl ghrelin ratio of 0.8 (approximately 1:1.25). Steady-state plasma levels were reached after approximately 45 minutes for both doses of ghrelin infusion (Figure 1). The low- and high-dose acyl ghrelin infusions raised the total ghrelin level to approximately 2- and 5-fold fasting values (Figure 1A), and acyl ghrelin to approximately 9- and 51-fold above the baseline concentrations (Figure 1B). The values of Cmax and AUC0-last corresponding to the 2 μg/kg/h dose ghrelin infusion were about 4 and 6 times higher than that with the 0.26 mu]g/kg/h dose, respectively (Cmax, 4.24 ± 0.59 vs 0.99 ± 0.46 ng/ml; AUC0-last, 610 ± 111 vs 109 ± 25 min/ng/ml). Plasma desacyl ghrelin, presumably derived from the breakdown of acyl ghrelin, demonstrated a similar fold increase as acyl ghrelin in response to the high and low infusion rates (Cmax, 0.87 ± 0.29 vs 0.25 ± 0.08 ng/ml; AUC0-last, 124 ± 35 vs 34 ± 12 min/ng/ml) (Figure 1C). During the 0.26 and the 2 μg/kg/h acyl ghrelin infusion, the acyl:desacyl ghrelin ratios calculated from Cmax and AUC varied from 4 to 5 and 3 to 5, respectively.
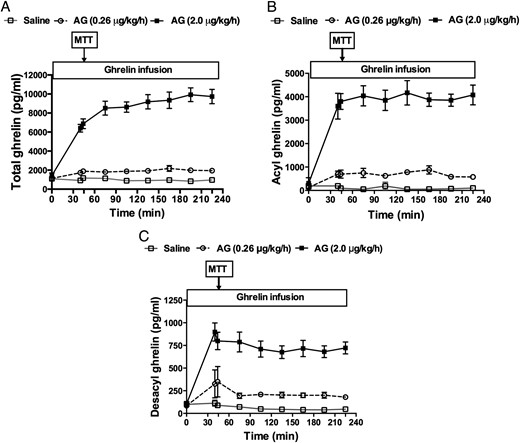
Plasma total (A), acyl (AG) (B), and desacyl ghrelin (DAG) (C) levels during continuous IV infusions of saline, 0.26 μg/kg/h, or 2 μg/kg/h of synthetic AG in healthy men and women.
The meal tolerance test (MTT) was started 45 minutes after ghrelin or saline infusions began and lasted for 240 minutes. The last ghrelin measurement was taken at 180 minutes of the MTT. White square, saline; white circle, AG 0.26 μg/kg/h; black square, AG 2 μg/kg/h.
Effects of exogenous ghrelin on glucose tolerance and insulin secretion.
IV ghrelin infusion (0–45 minutes) had minimal effects on fasting plasma glucose (main effect, P = .07) or insulin (main effect, P = .85) concentrations. However, during the 4-hour MTT, both the low- and high-dose ghrelin infusions increased glucose AUC compared to saline (Table 1), indicating impairment of glucose tolerance (Figure 2, A and D). Postprandial insulin and C-peptide were increased during the high-dose ghrelin infusion (Table 1; Figure 2, B and E; Figure 2, C and F). Compared with the saline control, there was no effect of low-dose ghrelin on the AUC of insulin or C-peptide (Table 1; Figure 2, B and E; Figure 2, C and F). When β-cell function was adjusted for the level of blood glucose as δAUC ISR/δAUC G0–180min, the value was significantly reduced by the high-dose but not the low-dose ghrelin infusion (Table 1 and Figure 2G). The variability of body weight/BMI did not appear to affect the results obtained among young subjects (ages 19–27 years) in our study. No difference was observed in postprandial insulin secretion or glucose tolerance between male and female subjects (data not shown).
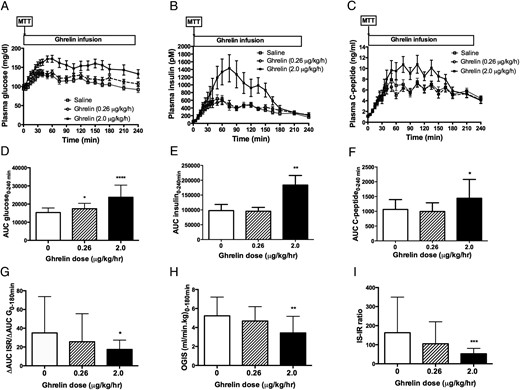
Effects of acyl ghrelin infusion on plasma glucose (A), insulin (B), and C-peptide (C) levels during the 4-hour MTT.
The low-dose (0.26 μg/kg/h) and high-dose (2 μg/kg/h) acyl ghrelin (AG) infusion increased AUC glucose level and therefore worsened postprandial glucose tolerance (D), whereas the high-dose ghrelin infusion increased the postprandial unadjusted insulin (E) and C-peptide (F) secretion. In addition, the high-dose ghrelin infusion also reduced the insulin secretion rate (ISR) adjusted for glucose (δAUC ISR/δAUC G0–120min, a measure of insulin secretion) (G), insulin sensitivity (OGIS0–120min) (H), and insulin secretion-to-insulin resistance ratio (IS-IR ratio = δAUC ISR/δAUC G0–120min × OGIS0–120min) (I), whereas the low-dose ghrelin infusion had no effect on these parameters. *, P < .05; **, P < .01; ***, P < .001; ****, P < .0001. White square and white bar, saline; white circle and hatched-stripe bar, AG 0.26 μg/kg/h; black square and black bar, AG 2 μg/kg/h.
Effects of Exogenous Ghrelin on Glucose Tolerance and Insulin Secretion in Healthy Humans During an MTT
| Saline | Ghrelin (0.26 μg/kg/h) | Ghrelin (2 μg/kg/h) | P Value | |
|---|---|---|---|---|
| AUC Glucose0–240 min (mmol/liter) | 853 ± 38 | 968 ± 46* | 1319 ± 103**** | <.0001 |
| AUC Insulin0–240 min (nmol/liter) | 77 (53–107) | 94 (63–111) | 187 (81–270)** | .0031 |
| AUC C-peptide0–240 min (nmol/liter) | 354 ± 31 | 331 ± 27 | 481 ± 59* | .0066 |
| ΔAUC ISR0–180 min | 556 ± 63.2 | 507 ± 49**** | 784 ± 100**** | <.0001 |
| δAUC ISR/[δAUC G0–180 min (pmol/min/mg/dl) | 20.2 (16.1–38.6) | 17.6 (10.8–22.6) | 14.6 (9.9–20.8)* | .0366 |
| OGIS0–180 min (ml/min/kg) | 5.23 ± 0.53 | 4.68 ± 0.40 | 3.43 ± 0.47** | .0035 |
| IS-IR ratio | 107.7 (79.7–154.8) | 69.8 (55.5–96.9) | 51.1 (30.1–78.9)*** | .0004 |
| Kd (pmol/mm) | 1168 ± 355 | 884 ± 213 | 719 ± 241 | .55 |
| Slope (pmol/min/mm) | 245 (179–359) | 228 (99–285) | 239 (97–358) | .50 |
| Total insulin clearance (ml/min) | 1.62 ± 0.16 | 1.44 ± 0.14 | 1.08 ± 0.10** | .0024 |
| Fasting insulin clearance (ml/min) | 2.02 ± 0.17 | 1.99 ± 0.16 | 2.10 ± 0.16 | .69 |
Comparisons were made between low-dose ghrelin (0.26 μg/kg/h) and high-dose ghrelin (2 μg/kg/h) infusions vs saline infusion.
Abbreviations: G, glucose; ISR, insulin secretion rate; IR, insulin resistance; IS, insulin secretion; IS-IR, insulin secretion-to-insulin resistance ratio; Kd, rate sensitivity, a measure of β-cell sensitivity to glucose.
, P < .05;
, P < .01;
, P < .001;
, P < .0001.
Insulin sensitivity, calculated as OGIS0–180min, was significantly reduced by the high-dose but not the low-dose ghrelin infusion (Table 1; Figure 2H). Similarly, the insulin secretion-to-insulin resistance ratio, δAUC ISR/δAUC G0–180min × OGIS0–180min, was reduced by high-dose, but not low-dose ghrelin (Table 1; Figure 2I). Parameters of β-cell sensitivity to glucose, as measured by the slope and rate sensitivity, did not differ between ghrelin and saline treatment (Table 1). Finally, the total metabolic clearance of insulin was significantly reduced by high-dose, but not low-dose ghrelin infusion (Table 1). Fasting insulin clearance was however unchanged by ghrelin administration (Table 1).
Effects of exogenous ghrelin on incretins, pituitary and other islet hormones.
The high-dose ghrelin infusion raised postprandial GLP-1 levels nearly 3-fold relative to saline infusion (AUC GLP-1: high-dose ghrelin, 3724 ± 768, low-dose ghrelin 2041 ± 240.4, saline, 1574 ± 352 min/pg/mL, P = .01; high-dose ghrelin vs saline P < .01). However, ghrelin had no effect on GIP secretion (AUC GIP: high-dose ghrelin, 82 575 ± 3056; low-dose ghrelin 66 534 ± 4167, saline 70 250 ± 9482 min/pg/mL, P = .21) (Figure 3, A–D), or on plasma GLP-1 level when glucose was given IV (Figure 3, E and F). Similar to what we previously observed during an IV glucose tolerance test (11, 12), high-dose ghrelin increased human GH and cortisol secretion during the mixed meal (Figure 4, A and B). However, postprandial glucagon, PYY, leptin, and pancreatic polypeptide secretions were not affected (Figure 4, C–F). In contrast to the high-dose ghrelin infusion, the low-dose ghrelin treatment did not have any effect on postprandial GLP-1, GH, or cortisol secretion (Figure 3A; Figure 4, A and B).
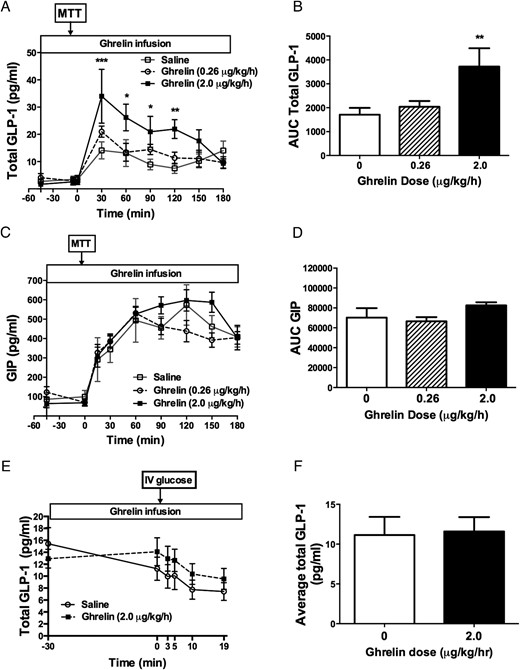
Effects of acyl ghrelin infusion on incretin hormone secretion during MTT (A–D) and IV glucose tolerance test (E–F) in healthy men and women.
Continuous ghrelin infusion at 2 μg/kg/h increased postprandial total GLP-1 (A, B) but not GIP (C, D) levels. In contrast, ghrelin had no effect on GLP-1 secretion following an IV glucose bolus during IV glucose tolerance test (E, F). **, P < .01. White square, saline; white circle, AG 0.26 μg/kg/h; black square, AG 2 μg/kg/h; white square and white bar, saline; white circle and hatched-stripe bar, AG 0.26 μg/kg/h; black square and black bar, AG 2 μg/kg/h.
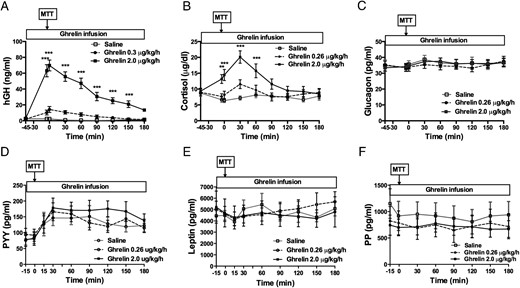
Effects of acyl ghrelin infusion on pituitary hormone and other islet hormone secretion during MTT.
High-dose (2 μg/kg/h) ghrelin increased human GH (A) and cortisol (B) secretion, whereas postprandial concentrations of glucagon (C), PYY (D), leptin (E), or pancreatic polypeptide (PP) (F) were not affected. The low-dose ghrelin treatment did not have any effect on postprandial secretion of these hormones (A–F). **, P < .01; ***, P < .001. White square, saline; white circle, acyl ghrelin 0.26 μg/kg/h; black square, acyl ghrelin 2 μg/kg/h.
Effects of exogenous ghrelin on circulating lipids.
Serum triglyceride levels were significantly higher toward the later part of the MTT when subjects were receiving high-dose ghrelin infusion as compared to saline (Figure 5A), but the overall AUC values (0–225 minutes) were not different among treatments (AUC triglycerides: high-dose ghrelin, 7496 [5818–12 488]; low-dose ghrelin, 6954 [5256–9399]; saline, 6301 [4462–9195] min/mg/dl; P = .43 (Figure 5B). Similarly, serum FFA levels between 0 and 75 minutes were also significantly increased with high-dose ghrelin infusion when compared to saline infusion. These effects were not seen with the low-dose ghrelin administration (AUC FFA: high-dose ghrelin, 35.7 [32.0–54.9]; low-dose ghrelin, 30.5 [26.8–33.4]; saline, 25.2 [17.5, 28.7] mmol/L; P = .01; high-dose ghrelin vs saline, P < .001; low-dose ghrelin vs saline, P > .05) (Figure 5, C and D).
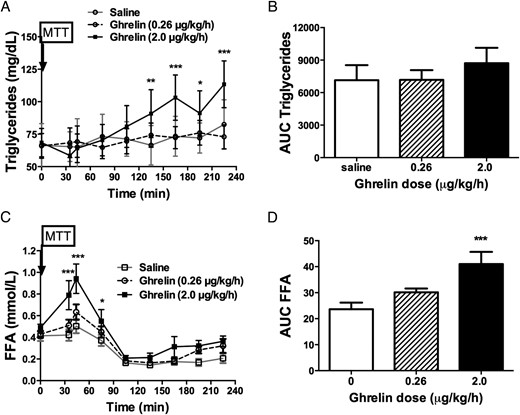
Effects of acyl ghrelin infusion on circulating lipids.
High-dose (2 μg/kg/h) ghrelin infusion increased serum triglyceride levels at 90, 120, 150, and 180 minutes during the MTT, corresponding to the 135, 165, 195, and 225 minutes after the beginning of ghrelin infusion (A). No difference was seen when AUC for triglycerides was compared (B). The high-dose ghrelin also increased serum FFA concentrations at 35, 44, and 75 minutes after ghrelin infusion began (C) as well as the AUC for FFA (AUC FFA) during the ghrelin infusion period (D). *, P < .05; **, P < .01; ***, P < .001. White square and white bar, saline; white circle and hatched-stripe bar, acyl ghrelin 0.26 μg/kg/h; black square and black bar, acyl ghrelin 2 μg/kg/h.
Side effects.
Ghrelin infusions were well-tolerated. No adverse events were reported except for dizziness in one subject during the 2 μg/kg/h dose ghrelin infusion that was mild and resolved spontaneously without intervention.
Discussion
A role for ghrelin in the regulation of glucose metabolism in humans has been suggested by accumulating experimental data. In fasted humans, ghrelin administration enhances GH secretion and lipolysis, suppresses insulin release and insulin action, and causes glucose intolerance (12, 28). In the current study, we extended the examination of ghrelin effects on glucose metabolism to the fed state. During meal absorption, high-dose ghrelin caused insulin resistance and hyperinsulinemia, but with glucose intolerance and a net impairment of β-cell function. The low-dose ghrelin infusion also caused postprandial glucose intolerance, but without the changes in levels of circulating hormones seen with the higher dose. Raising ghrelin levels to a pharmacological range in the postprandial period also increased GLP-1 secretion, supporting coordinated secretion of regulatory peptides from the gut. Taken in the context of previous findings, these results support a physiologic role for ghrelin to mediate prandial metabolism.
The concentrations of circulating ghrelin achieved in this study were supraphysiologic. Although total ghrelin levels in response to the low-dose infusion were comparable to what has been described in fasting humans (29), the ratio of acyl- to desacyl- peptide was substantially increased. At first glance, this would appear to cast these results as more of a function of pharmacology than physiology. However, several points must be considered before reaching this conclusion. First, ghrelin may not regulate glucose metabolism or GLP-1 secretion as a hormone, and the plasma levels in our experiment may only be mimicking actions that normally occur in local compartment (ie, paracrine signaling in the islet or gut, where ambient levels are elevated above normal plasma concentrations). Second, it seems unlikely that the ghrelin infusions given to our subjects had off-target effects; that is, the results we report are invariably from interactions of ghrelin with its cognate receptor. Third the system is wired to affect plasma glucose at least raises the possibility that it has evolved for this purpose. Therefore, the results reported here need to be interpreted beyond simply a comparison of endogenous plasma levels and those obtained by experimental infusion.
The physiological importance of ghrelin in the regulation of insulin secretion has also been suggested by observations made in preclinical studies (30). Pharmacological treatment with ghrelin attenuates GSIS in rodents (31), and ghrelin loss of function increases insulin levels in mice (32). Consistent with these findings, we have demonstrated that ghrelin administration to fasted subjects during an IV glucose tolerance test potently suppresses the acute insulin response to glucose (11, 12). In the current study, the stimulus was a mixed meal, and our healthy, fed subjects also had a significant decrease in β-cell function with the high-dose administration of ghrelin (Figure 3C). The concordance between the results with IV glucose and mixed meal ingestion are most consistent with a direct effect of ghrelin on islet cells. There remains some question as to which pancreatic endocrine cells express the ghrelin receptor, but there is evidence that the receptor is present on human β cells (6, 33). Taken together with the results of preclinical studies demonstrating a role for ghrelin to protect against hypoglycemic during starvation (34), our results in humans support a role for ghrelin in the response to both long- and short-term fasting, restraining insulin secretion during refeeding after periods of nutrient deprivation. While plasma acyl ghrelin levels are highest during fasting, it remains to be tested whether the effect to inhibit insulin secretion increases with duration of fasting in humans when desacyl ghrelin becomes the dominant circulating ghrelin isoform (23). Overall, our data suggest that regardless of the nutrient status (fasting vs fed), elevated circulating ghrelin levels have a similar effect on β-cell function and glucose tolerance in healthy humans.
The results of the present study show that ghrelin decreases insulin sensitivity, and that high-dose ghrelin also increases GH, FFA, and cortisol concentrations. It is well-known that GH, FFA, and cortisol impair insulin sensitivity and the augmented secretion of these hormones might be responsible for the ghrelin's effect on insulin sensitivity; however, low-dose ghrelin infusion also impairs insulin sensitivity without affecting GH, FFA, and cortisol. Vestergaard et al previously showed that ghrelin acutely decreased peripheral, but not hepatic, insulin sensitivity together with increasing lipolysis in individuals with hypopituitarism who lack endogenous GH and ACTH secretion (28). These findings would suggest that the effect of ghrelin on insulin sensitivity is independent of GH and cortisol secretion. Our findings are in supportive of this view. However, the contribution of increased GH secretion to the postprandial hyperglycemia induced by ghrelin cannot be excluded based on the current study design.
Our observations that ghrelin stimulates GLP-1 secretion are in keeping with the results reported by Gagnon et al, who showed that intraperitoneal injection of ghrelin into mice 15 minutes before administration of oral glucose enhanced glucose-stimulated GLP-1 secretion and improved glucose tolerance (19). This effect was specific to ghrelin, dependent on the activation of the GLP-1 receptor and enteral, but not IV, glucose administration. Similar data have been reported in humans (35). In our study, ghrelin administration selectively increased postprandial total GLP-1, without affecting GIP or PYY levels. Moreover, ghrelin had no effect on plasma GLP-1 during an IV glucose tolerance test. Although this suggests that the effect of ghrelin on enteroendocrine L cells occurs only during nutrient absorption, plasma levels of GLP-1 in fasting humans are low and detecting differences in this state may be beyond the capability of current assays. One important difference between our study of humans and that of Gagnon and colleagues using mice was that we observed worsened glucose tolerance with ghrelin stimulation of GLP-1, whereas they saw improved glucose tolerance (19). This could be due to the difference in study design. We infused ghrelin throughout the MTT, whereas they gave a single bolus 15 minutes before oral glucose (19). This raises the interesting question of whether elevating ghrelin level in the preprandial vs the postprandial period may be associated with differential effects on prandial glucose homeostasis. Furthermore, it is intriguing to speculate that the endogenous rise in ghrelin levels before eating contributes to meal-anticipatory GLP-1 secretion, as has been demonstrated in rodents (36). The mechanism by which ghrelin augments GLP-1 secretion in response to meal ingestion is not understood, but may be related to acceleration of gastric emptying (37). It seems plausible that, in addition to the direct action of ghrelin on the L cells as shown by Gagnon et al, ghrelin promotes GLP-1 release by accelerating glucose delivery to the intestine (38).
It is notable that raising ghrelin levels to a supraphysiological range during a meal stimulated GLP-1 secretion but not sufficiently enough to overcome the negative effect of ghrelin on glucose tolerance. Stimulation of GLP-1 by ghrelin is paradoxical at first glance, as the known actions of the two peptides seem to be antagonistic rather than synergistic. In contrast to the effect of ghrelin on GLP-1 release, both central and peripheral administration of a GLP-1 receptor agonist reduces circulating ghrelin (39). Similarly, in patients with Prader-Willi syndrome, who have dramatically elevated ghrelin levels, these are significantly reduced after being treated with a GLP-1 analog (40). Thus, the interrelationship between ghrelin and GLP-1 has the outlines of a negative feedback loop, although this hypothesis needs more directed study to establish.
In summary, findings from this study, taken together with our previous work, suggest that exogenous ghrelin decreases β-cell function and glucose tolerance and induces acute insulin resistance regardless of the route of glucose entry. Under physiological conditions, most evidence is that ghrelin opposes GLP-1 action or secretion; however, at pharmacologic levels, ghrelin may stimulate GLP-1 secretion. This distinction is interesting and potentially important when considering the ghrelin system as a target for therapeutics. Our observations also raise the possibility that chronic inhibition of acyl ghrelin or ghrelin O-acyl-transferase activity can improve β-cell function and glucose tolerance.
Acknowledgments
Funding for this research is provided by National Institute of Health (NIH)/National Institute of Diabetes and Digestive and Kidney Diseases (5K23DK80081 and 5R01DK097550 to J.T. and R0157900 to D.D.) and supported in part by US Public Health Services Grant #UL1 RR026314 from the National Center for Research Resources, NIH.
Author contributions: J.T. designed the study, collected and analyzed the data, and was the primary author. H.W.D. assisted with data collection, contributed to discussion, and reviewed/edited the manuscript. A.G. assisted with data analysis, contributed to discussion, and reviewed/edited the manuscript. D.D. contributed to discussion and reviewed/edited the manuscript.
Disclosure Summary: The authors have nothing to disclose.
Abbreviations
- AUC
area under the curve
- BMI
body mass index
- Cmax
peak plasma level
- FFA
free fatty acid
- GIP
glucose dependent insulinotropic polypeptide
- GLP-1
glucagon like peptide 1
- GSIS
glucose-stimulated insulin secretion
- ISR
insulin secretion rate
- MTT
meal tolerance test
- OGIS
oral glucose insulin sensitivity
- PYY
peptide YY.
