


Abstract
Familial hypocalciuric hypercalcemia (FHH) is a genetically heterogeneous condition resembling primary hyperparathyroidism (PHPT) but not curable by surgery; FHH types 1, 2, and 3 are due to loss-of-function mutations of the CASR, GNA11, or AP2S1 genes, respectively.
This study aimed to compare the phenotypes of patients with genetically proven FHH types 1 or 3 or PHPT.
This was a mutation analysis in a large cohort, a cross-sectional comparison of 52 patients with FHH type 1, 22 patients with FHH type 3, 60 with PHPT, and 24 normal adults.
There were no interventions.
Abnormalities of the CASR, GNA11, and AP2S1 genes, blood calcium, phosphate, and PTH concentrations, urinary calcium excretion were measured.
In 133 families, we detected 101 mutations in the CASR gene, 68 of which were previously unknown, and in 19 families, the three recurrent AP2S1 mutations. No mutation was detected in the GNA11 gene. Patients with FHH type 3 had higher plasma calcium concentrations than patients with FHH type 1, despite having similar PTH concentrations and urinary calcium excretion. Renal tubular calcium reabsorption levels were higher in patients with FHH type 3 than in those with FHH type 1. Plasma calcium concentration was higher whereas PTH concentration and urinary calcium excretion were lower in FHH patients than in PHPT patients. In patients with FHH or PHPT, all data groups partially overlapped.
In our population, AP2S1 mutations affect calcium homeostasis more severely than CASR mutations. Due to overlap, the risk of confusion between FHH and PHPT is high.
Familial hypocalciuric hypercalcemia (FHH), also known as familial benign hypercalcemia, is an autosomal-dominant disease with a high degree of penetrance. FHH is genetically heterogeneous: FHH type 1 (Online Mendelian Inheritance in Man [OMIM] #145980) is the most common form and is caused by a heterozygous loss-of-function mutation of the CASR gene (1, 2). CASR encodes the calcium-sensing receptor CaSR, which plays a key role in extracellular calcium homeostasis. CaSR mediates the negative feedback effect of extracellular calcium on PTH secretion. It also down-regulates renal calcium absorption in the thick ascending limb of the loop of Henle. Consequently, lower levels of CaSR activity promote PTH secretion, renal calcium absorption, and eventually higher extracellular calcium concentrations.
Loss-of-function mutations of another two genes, AP2S1 and GNA11, encoding the adaptor-related protein complex 2, σ-2 subunit (AP2σ2) and Gα11 proteins, respectively, have recently been identified as causes of FHH type 3 (OMIM #600740) and FHH type 2 (OMIM #145981), respectively (3, 4), in a smaller proportion of patients. AP2σ2 is crucial for clathrin-mediated endocytosis of plasma membrane proteins such as CaSR and Gα11 is involved in CaSR signaling.
FHH type 3 has been described in two large families: one from Oklahoma (5), in which hyperparathyroidism occurred after the age of 30 years in 15 hypercalcemic individuals, and one from Ireland (6), in which hypercalcemic individuals over the age of 30 years had significantly lower serum phosphate concentrations than younger patients. More recently, five patients bearing heterozygous AP2S1 p.Arg15 mutations were reported to have a phenotype indistinguishable from that of patients with FHH type 1, which is much more common (7).
It therefore remains unclear whether there are clinically relevant phenotypic differences between patients with FHH types 1 and 3. We addressed this question by studying two cohorts of patients with FHH type 1 bearing novel and recurrent mutations of the CASR gene or FHH type 3 bearing mutations of the AP2S1 gene. We compared the phenotype of a subset of patients with FHH type 1 with the phenotype of patients with FHH type 3, patients with primary hyperparathyroidism (PHPT), or normal subjects.
Materials and Methods
Populations
Normal subjects
The control group consists of 24 normal adult volunteers (15 females, nine males; age 25–50 y), studied from January 2000 to December 2002.
FHH types 1 or 3
From January 2000 to December 2014, 220 patients with suspected FHH were referred to the Genetics Department of Georges Pompidou European Hospital (Paris, France) for mutation analysis. FHH type 1 or 3 was genetically confirmed in 152 unrelated patients. We analyzed relatives from 45 families. No FHH type 2 patients were identified.
Genetically negative FHH
The group consists of 10 patients with a FHH phenotype (hypercalcemia and normal or slightly elevated plasma PTH concentration) and no abnormality of the CASR, GNA11, and AP2S1 genes and at least one family member with the same phenotype and/or a failure of surgical removal of parathyroid gland(s) to correct hypercalcemia.
Confirmed primary hyperparathyroidism
This group consists of 60 adult patients with PHPT who have been operated on and cured between March 2000 and March 2015. The diagnosis of PHPT was made according to the usual criteria (8).
This study was conducted in accordance with the Declaration of Helsinki and approved by the French national regulatory board (CNIL, 1898675). All patients gave informed consent for biobanking (DC2009950). The study was approved by the “Comité de Protection des Personnes, Paris-Île de France XI (Ref. 09069)” and informed consent for gene analysis was obtained from each proband and relatives or from their parents, for minors.
Methods of mutation detection
DNA was extracted with a high-salt method or with blood DNA midi kits (QIAGEN columns). CASR and AP2S1 exons and the flanking intron sequences were amplified by PCR and then sequenced with BigDye Terminator kit v3.1 cycle sequencing kits and run on an ABI Prism 3730XL DNA Analyzer Sequencer (PerkinElmer Applied Biosystems). The conditions for CASR gene amplification have been described elsewhere (9). The primers and PCR conditions used for the AP2S1 gene are described in Supplemental Table 1.
DNA mutations were identified with Sequencher software, through comparisons with reference sequences for the CASR and AP2S1 genes: NM_000388.3 and NM_004069.3. Each mutation was confirmed by sequencing a second independent PCR product.
Tools for interpretation of missense and splicing mutations are described in Supplemental Data.
Biological assessment
Plasma and morning urine samples were collected after an overnight fast, for all patients and controls. Data from newborns, infants, and children under the age of 2 years were not included. Estimated glomerular filtration rate (eGFR) was estimated from plasma creatinine concentration ([creatinine]P, μmol/L) in patients under the age of 18 years, according to the 2009 Schwartz formula (10): 35.56 (height in cm)/[creatinine]P μmol/L. In patients over the age of 18 years, eGFR was calculated with the Modification of Diet in Renal Disease formula: 186.3 × ([creatinine]P ÷ 88.4)−1.154 × age−0.203 (11).
Analytical methods for chemical phenotyping are described in Supplemental Data.
Statistical analysis
Results are reported as means ± 1 SD or as medians and interquartile ranges (IQRs), as appropriate. Quantitative values were compared by Kruskal-Wallis test and post-hoc Dunn's multiple comparison test using Prism V6 (GraphPad Software). P-values were adjusted to account for multiple comparisons. Qualitative values were compared by χ2 test. Variables with age-dependent reference values (plasma phosphate concentration and urinary calcium/creatinine ratio) are expressed as z score, calculated as follows: z score = (measured value − mean normal value) ÷ SD. The logarithm of urinary calcium to creatinine ratio, calculated to normalize the distribution of individual values, was used to calculate z score. The reference values for newborns, infants, children and adolescents used were those provided by Matos et al (12). We used nonparametric Spearman correlation test to assess dependence between quantitative variables. P < .05 was considered significant.
Results
Genetic data
We detected 101 different mutations of the CASR gene in 185 patients from 133 families. Sixty-eight of these mutations were previously unknown (Table 1). Overall, 85% of these mutations were missense, 6% were nonsense, 4% were frameshift, 3% were in-frame, and 2% were splice mutations (Figure 1A). The new mutations comprised four frameshift, six nonsense, two splice, three in-frame, and 53 missense mutations. We checked for the presence of the newly identified mutations in the Exome Aggregation Consortium project database (http://exac.broadinstitute.org/), which provides the exome sequences of 60 706 unrelated individuals. Only the p.Ala140Val and p.Val504Met missense variants were present in this database, at very low frequencies (8.244e-06 and 4.118e-05). Furthermore, in silico analyses predicted the new missense and in-frame mutations to be pathogenic (Supplemental Table 3). For some missense mutations additional evidence of pathogenicity can be deduced from the structure-function correlation literature data (13–16); these data are summarized in Table 1. Thirty-three previously described missense mutations (1, 2, 7, 9, 17–32) were detected in 48 independent families (Supplemental Table 4).
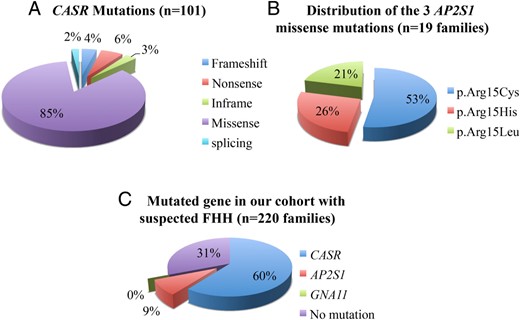
A, CASR mutations detected in this study; percentages by type. B, Distribution of the three AP2S1 missense mutations in 19 families. C, Percentages of FHH types in our cohort of 220 families.
New Mutations of the CASR Gene Detected in 85 Independent Families With HHF Type 1 (68 Mutations)
| Patient | Type of Mutation | Nucleotidea | Protein | Exon/Intron | Protein Domainc | Possible Effects |
|---|---|---|---|---|---|---|
| EP180001 | Frameshift | c.186del | p.Arg62Serfs*13 | 3 | ECD | Truncated protein or unstable mRNA |
| HF059001 | Frameshift | c.704del | p.Ile235Thrfs*22 | 4 | ECD | |
| HF259001 | Frameshift | c.2029dup | p.Cys677Leufs*31 | 7 | TMD1 | |
| HF185001 | Frameshift | c.3104del | p.Pro1035Leufs*21 | 7 | ICL1 | |
| HT687001 | ||||||
| HF426001 | Nonsense | c.23G>A | p.Trp8* | 2 | ECD | |
| HF024001 | Nonsense | c.272T>A | p.Leu91* | 3 | ECD | |
| HF171001 | Nonsense | c.679C>T | p.Arg227* | 4 | ECD | |
| HF130001 | Nonsense | c.2024G>A | p.Trp675* | 7 | ECL1 | |
| HF421001 | Nonsense | c.2386A>T | p.Lys796* | 7 | ICL3 | |
| HF009001 | Nonsense | c.2608G>T | p.Glu870* | 7 | ICD | |
| HF247001 | ||||||
| HF194001 | Splicing | c.1608 + 3A>C | p.?b | 5 | ECD | The skip of exon 5 causes an inframe deletion of 77 residues |
| HF186001 | Splicing | c.1609-1G>T | p.? (Loss of splice acceptor site) | 6 | ECD | The skip of exon 6 creates a frameshift starting at codon Asp578, with a new reading frame ends in a STOP codon 48 positions downstream. |
| HF437001 | In frame | c.707-715del | p.Cys236_Asp238del | 4 | ECD | |
| HF515001 | In frame | c.1963_1965delCTC | p.Leu655del | 7 | TMD2 | |
| HF109001 | In frame | c.2331_2332insAGC | p.Ile777_Gly778insSer | 7 | TMD5 | |
| HF144001 | Missense | c.110T>C | p.Leu37Pro | 2 | ECD | |
| HF601001 | Missense | c.152T>G | p.Leu51Arg | 2 | ECD | |
| HF639001 | ||||||
| HF019001 | Missense | c.200G>T | p.Gly67Val | 3 | ECD | |
| HF111001 | Missense | c.220A>G | p.Met74Val | 3 | ECD | |
| HF276001 | ||||||
| HF285001 | Missense | c.230C>T | p.Ala77Val | 3 | ECD | |
| HF448001 | ||||||
| HF458001 | Missense | c.240G>T | p.Glu80Asp | 3 | ECD | |
| HF020001 | Missense | c.246C>G | p.Asn82Lys | 3 | ECD | |
| HF157001 | Missense | c.301T>C | p.Cys101Arg | 3 | ECD | Alteration of intramolecular disulfide bridges impairing the surface expression (13) |
| HF553001 | Missense | c.303C>G | p.Cys101Trp | 3 | ECD | |
| HF318001 | Missense | c.419C>T | p.Ala140Val | 3 | ECD | |
| HF143001 | Missense | c.434C>T | p.Thr145Ile | 3 | ECD | Near residues 147 and 170, which are part of Ca+2 binding site 1 |
| HF524001 | Missense | c.449C>G | p.Ser150Cys | 3 | ECD | |
| HF457001 | Missense | c.484A>T | p.Ile162Phe | 3 | ECD | |
| HF360001 | Missense | c.513C>A | p.Ser171Arg | 4 | ECD | |
| HF646001 | Missense | c.524G>T | p.Ser175Ile | 4 | ECD | |
| HF243001 | Missense | c.547T>C | p.Phe183Leu | 4 | ECD | |
| HF602001 | Missense | c.553C>G | p.Arg185Gly | 4 | ECD | Arg185Gln described (1) |
| HC169001 | Missense | c.570T>G | p.Asp190Glu | 4 | ECD | Residue being part of Ca+2 binding site1 (1,13) |
| HC145001 | Missense | c.905C>T | p.Ser302Phe | 4 | ECD | |
| HF617001 | Missense | c.1034A>T | p.Asn345Ile | 4 | ECD | Near residues 350, which is part of Ca+2 binding site4 (1,13) |
| HF304001 | Missense | c.1289C>T | p.Ala430Val | 4 | ECD | |
| HF403001 | Missense | c.1295A>G | p.Gln432Arg | 4 | ECD | |
| HF716001 | Missense | c.1370C>T | p.Ala457Val | 4 | ECD | |
| HF429001 | Missense | c.1510G>A | p.Val504Met | 5 | ECD | |
| HF489001 | Missense | c.1526G>A | p.Gly509Glu | 5 | ECD | |
| HF518001 | ||||||
| HF054001 | Missense/splicing | c.1608G>T | p.Glu536Asp | 5 | ECD | |
| HF183001 | Missense | c.1624T>C | p.Cys542Arg | 6 | ECD | Equivalent to the Cys-rich domain of mGluR3, probable link between ECD and 7TM (14) |
| HF118001 | Missense | c.1637G>C | p.Cys546Ser | 6 | ECD | |
| HF010001 | Missense | c.1649C>T | p.Thr550Ile | 6 | ECD | |
| HF211001 | ||||||
| HF033001 | Missense | c.1661T>A | p.Ile554Asn | 6 | ECD | |
| HF053001 | ||||||
| HF218001 | ||||||
| HF244001 | ||||||
| HF275001 | ||||||
| HF630001 | ||||||
| HF558001 | Missense | c.1709A>G | p.Asp570Gly | 6 | ECD | |
| HF045001 | Missense | c.1754G>T | p.Cys585Phe | 7 | ECD | Residue belong to Cys-rich domain (13) |
| HF584001 | Missense | c.1803G>C | p.Lys601Asn | 7 | ECD | |
| HF242001 | Missense | c.1901T>C | p.Phe634Ser | 7 | ICL1 | |
| HF401001 | ||||||
| HF263001 | Missense | c.1919C>T | p.Thr640Ile | 7 | ICL1 | |
| HF372001 | ||||||
| HF648001 | Missense | c.1983C>G | p.Cys661Trp | 7 | TMD2 | Residue belong to Cys-rich domain (13); Cys661Tyr described (15) |
| HF313001 | Missense | c.2033G>A | p.Arg678His | 7 | ECL1 | |
| HF693001 | Missense | c.2069T>G | p.Leu690Arg | 7 | TMD3 | |
| HF334001 | Missense | c.2078C>T | p.Ser693Leu | 7 | TMD3 | |
| HF248001 | Missense | c.2228T>C | p.Leu743Pro | 7 | TMD 4 | |
| HF435001 | ||||||
| HF703001 | ||||||
| HF572001 | Missense | c.2237C>T | p.Ala746Val | 7 | ECL2 | |
| HF641001 | Missense | c.2240C>T | p.Pro747Leu | 7 | ECL2 | |
| HF645001 | Missense | c.2384G>A | p.Arg795Gln | 7 | ICL3 | Arg795Trp inactivating in vitro (20) |
| HF300001 | Missense | c.2384G>C | p.Arg795Pro | 7 | ICL3 | |
| HF491001 | Missense | c.2401T>C | p.Phe801Leu | 7 | ICL3 | Mutagenesis of the corresponding residue of bovine CaSR impaired cell signaling in response to elevated Ca (14) |
| HF051001 | Missense | c.2420T>A | p.Ile807Asn | 7 | TMD6 | |
| HF015001 | Missense | c.2425T>A | p.Phe809Ile | 7 | TMD6 | |
| HF376001 | Missense | c.2479A>C | p.Ser827Arg | 7 | TMD6 | |
| HF628001 | ||||||
| HF333001 | Missense | c.2579T>G | p.Ile860Ser | 7 | TMD7 | |
| HF673001 | Missense | c.2582T>C | p.Leu861Pro | 7 | TMD7 | |
| HF127001 | Missense | c.2600A>T | p.Asn867Ile | 7 | ICD | |
| HF320001 | Missense | c.2618G>A | p.Arg873His | 7 | ICD | High extracellular Ca2+ induces binding of calmodulin to the C-tail of CaSR (residues 871–898) that may interfere with phosphorylation and reduce internalization of the receptor (16) |
| EP206001 | Missense | c.2618G>C | p.Arg873Pro | 7 | ICD |
Abbreviations: ECL, extracellular loop; ICD, intracellular domain; ICL, intracellular loop.
Numbering is according to the cDNA sequence (GenBank entry NM_000388.3). The A of the ATG of the methionine initiation codon is defined as nucleotide 1.
Splice site scores are 44% lower for MaxEntScan (9.7 to 5.4) and 9.5% lower for SpliceSiteFinder-like (94.9 to 85.9). No mRNA was available for transcript analysis for this patient.
Protein domains according with Uniprot KB No. P41180.
Sixty-two different CASR mutations (61%) affected the extracellular domain (ECD), 20 (20%) affected the transmembrane domain (TMD), 16 the intra- or extracellular loops (16%), and 3 (3%) affected the intracellular domain (ICD) (Table 1 and Supplemental Table 4).
We analyzed 74 relatives from 40 families. The familial mutation was detected in 52 relatives: 23 parents, 13 brothers or sisters, 12 sons or daughters, 1 niece, 1 maternal uncle, 1 grandfather, and 1 grandson. In all families, the genotype segregated with the disease. In 12 cases, the mutation was inherited from the mother and in 11 cases it was inherited from the father. In two cases, the mutation was absent from both parents.
We detected the three mutations of the AP2S1 gene previously described by Nesbit et al (3) and affecting the arginine residue in position 15, in 24 patients from 19 independent families. The p.Arg15Cys mutation was detected in 10 families, the p.Arg15His mutation in five families and the p.Arg15Leu mutation in four families (Figure 1B and Supplemental Table 5). The parents were analyzed in five families: in two cases, the mutation was inherited from the mother, and in three, it was inherited from the father.
Clinical and chemical phenotypes
We analyzed and compared the available clinical and biological data of the following groups: 52 patients with FHH type 1, 22 patients with FHH type 3, 10 patients with genetically negative FHH, 60 patients with confirmed PHPT, and 24 normal adults.
Characteristics of patients with FHH type 1
The main biological characteristics of the patients with FHH type 1 are shown in Table 2. Median age at diagnosis was 42 years (IQR, 26–56 y). Four patients had a history of renal lithiasis. None had nephrocalcinosis or a history of pancreatitis. Plasma total calcium concentration was slightly high. Median PTH concentration was in the normal range, as was urinary calcium excretion (normalized to urinary creatinine excretion and expressed as a z score). There was a nonsignificant trend for plasma PTH concentration to increase with decreasing 25-OH vitamin D concentration (Figure 2A). Plasma magnesium concentration was normal. Mean plasma phosphate concentration was at the lower limit of the normal range and plasma phosphate concentration was not correlated with PTH concentration (Figure 2B). The eGFR values were within the normal range.
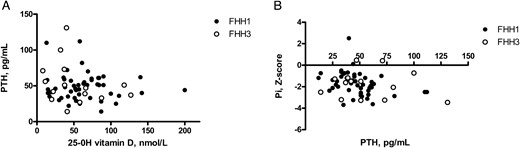
Correlations between plasma 25-OH vitamin D and PTH concentrations (A) and between plasma PTH and plasma phosphate concentrations (B) in patients with FHH types 1 and 3.
A, No significant correlation was found between plasma 25-OH vitamin D and PTH concentrations in patients with FHH type 1 (closed symbols) or FHH type 3 (open symbols). B, No significant correlation was found between plasma phosphate concentration (expressed as a z score) and PTH concentration in patients with FHH type 1 (closed symbols) or in FHH type 3 (open symbols).
Demographic and Biological Characteristics of the Normal Subjects and of the Patients Studied
| Characteristic | Normal Subjects (n = 24) | FHH1 (n = 52) | FHH3 (n = 22) | Genetically Negative Presumed FHH (n = 10) | PHPT (n = 60) | P Value (Kruskal-Wallis test) |
|---|---|---|---|---|---|---|
| Age at diagnosis, y | 32 (30–40) | 42 (26–56) | 34 (21–53) | 49 (25–72) | 61 (51–69)a,b,c | <.001 |
| Sex, F/M | 15/9 | 33/19 | 11/11 | 6/4 | 53/7 | <.01 |
| Total calcium, mm | 2.31 ± 0.10 | 2.62 ± 0.16a | 2.85 ± 0.11a,b | 2.78 ± 0.2a,b | 2.54 ± 0.10a,b,c,d | <.001 |
| PTH, pg/mL | 28.0 (21.3–39.9) | 45.5 (34.3–58.0)a | 49.0 (36.0–75.0)a | 46.0 (31.0–54.5) | 78.0 (51.0–94.5)a,b,c,d | <.001 |
| PTH, >60 pg/mL | 0% | 19% | 27% | 20% | 65% | <.001 |
| 25-OH vitamin D, nmol/L | 34 (27–48) | 57 (40–84)a | 40 (21–71) | 80 (44–99)a | 60 (47–78)a | <.001 |
| Plasma Pi, mm | 1.11 ± 0.16 | 0.83 ± 0.19a | 0.85 ± 0.20a | 1.02 ± 0.21 (n = 6) | 0.81 ± 0.13a | <.001 |
| Plasma Pi, z scoree | 0.0 ± 1.1 | −1.7 ± 1.1a | −1.8 ± 1.2a | −1.4 ± 1.7 (n = 6) | −2.1 ± 0.9a | <.001 |
| Plasma Mg, mm | 0.86 ± 0.06 | 0.82 ± 0.09 | 0.90 ± 0.15 (n = 9) | 0.87 ± 0.04 | 0.79 ± 0.07a,c | <.001 |
| UCa/UCr, mmol/mmol | 0.14 ± 0.07 | 0.18 ± 0.17 | 0.17 ± 0.09 | 0.28 ± 0.31 | 0.54 ± 0.31a,b,c,d | <.001 |
| UCa/UCr, z scoree | 0.0 ± 1.0 | 0.2 ± 1.2 | 0.2 ± 1.0 | 0.4 ± 2.1 | 2.4 ± 1.1a,b,c,d | <.001 |
| UCa/eGFR, μmol/L eGFR | 10.6 ± 5.1 | 12.2 ± 8.5 | 10.1 ± 6.3 | 26.9 ± 22.4 | 34.7 ± 18.9a,b,c | <.001 |
| eGFR, mL/min/1.73 m2 | 89 ± 15 | 95 ± 28 | 109 ± 13 (n = 15)a | 79 ± 28 (n = 6) | 96 ± 23 | <.01 |
| Tumor weight, mg | — | — | — | — | 300 (198–440) |
Abbreviations: F, female; M, male; Pi, inorganic phosphate.
Results are means ± sd or medians (IQR).
P < .05 vs normal subjects.
P < .05 vs FHH1.
P < .05 vs FHH3.
P < .05 vs genetically negative presumed FHH.
Age-specific normal values for adults were calculated from the 24 normal subjects, and age-specific values for children and adolescents were obtained from the literature (12).
No significant correlation was found between age and plasma total calcium concentration or other variables (Supplemental Figure 1). Similar phenotypes were observed for all patients, regardless of the domain of the protein affected by the mutation (Supplemental Table 6).
Characteristics of patients with FHH type 3
Median age at diagnosis was 34 years (IQR, 21–53 y; Table 2). None of the patients had a history of renal lithiasis or nephrocalcinosis; one had a history of acute pancreatitis. Patients with FHH type 3 were shorter than patients with FHH type 1 (mean height of −1.9 ± 1.5 vs −0.6 ± 1.4 SD in patients with FHH type 1; P = .01). Plasma total calcium concentration was high. Median PTH concentration was within the normal range, as was urinary calcium excretion. Mean plasma phosphate concentration was at the lower limit of normal range and eGFR was normal. No correlation was found between age and plasma calcium concentration, PTH concentration or other variables (Supplemental Figure 1). Plasma PTH concentration was not correlated with 25-OH vitamin D values, as observed for FHH type 1 (Figure 2A). Plasma phosphate concentration (expressed as a z score) was not correlated with age or PTH concentration (Figure 2B).
No difference in phenotype was observed between genotypes Arg15Cys, Arg15His or Arg15Leu (Supplemental Table 7). Bone mineral density was measured by dual-energy x-ray absorptiometry in four patients with FHH type 3: all had a lumbar bone mineral density z score below −2 SD.
Characteristics of patients with genetically negative FHH
Seven patients (from three families) had one or more relatives with hypercalcemia. Four patients underwent parathyroid gland(s) removal that failed to correct plasma calcium concentration. Median age at diagnosis was 49 years (IQR, 25–72 y; Table 2). None of the patients had a history of nephrolithiasis or nephrocalcinosis; one had a history of recurrent pancreatitis; three had osteoporosis. Plasma total calcium concentration was high. Median PTH concentration was within the normal range, as was urinary calcium excretion. Mean plasma phosphate concentration was similar to that of normal subjects, and eGFR was normal.
Characteristics of patients with confirmed primary hyperparathyroidism
Median age at diagnosis was 61 years (IQR, 51–69 y; Table 2). Twenty had osteoporosis and 13 had renal stone disease; none had nephrocalcinosis or a history of acute pancreatitis. Plasma total calcium concentration was high. Median PTH concentration was above the normal range, as was urinary calcium excretion. Mean plasma phosphate concentration was at the lower limit of normal range, and eGFR was normal.
Phenotypic differences between FHH and primary hyperparathyroidism
Patients with PHPT were older than patients with FHH type 1 or 3 (P < .01) and were more likely to be female (P < .01). Mean plasma calcium concentration was lower (P < .05) in patients with PHPT than in those with FHH type 3 or genetically negative FHH. Median plasma PTH concentration was higher in patients with PHPT than in those with FHH type 1 or type 3 (P < .05). On average, fasting urinary calcium excretion (expressed in mmol/mmol creatinine or as z score) was significantly higher in patients with PHPT than in those with FHH (P < .05). Although mean or median values significantly differed between patients with PHPT and those with FHH, most of the individual values measured in patients with FHH were in the same range as those measured in patients with PHPT (Figure 3 and Supplemental Table 8).
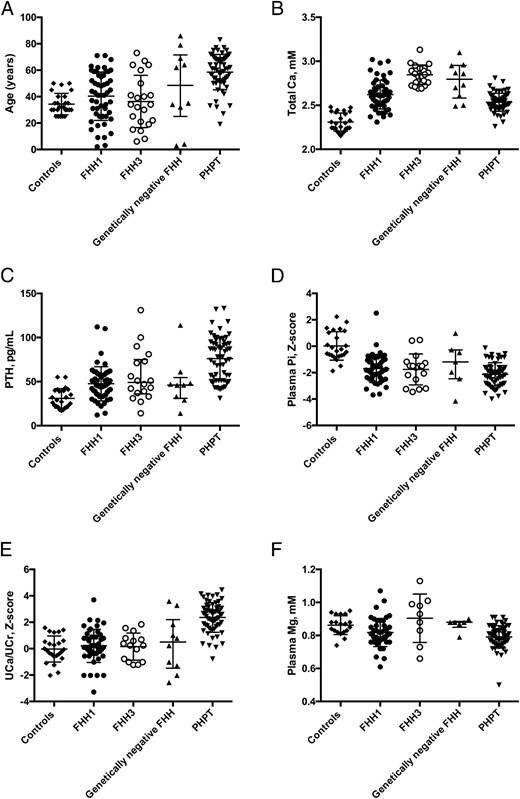
Distribution of individual values in normal subjects and patients.
The figure shows individual values of age at diagnosis (A), total calcium concentration (B), PTH concentration (C), plasma phosphate concentration expressed as z score (D), urinary calcium to creatinine ratio expressed as z score (E), and plasma magnesium concentration (F). Lines show median values, and error bars show interquartile range. Pi, inorganic phosphate.
Phenotypic differences between patients with FHH types 1 and 3
We first analyzed the relationship between total and ionized calcium concentrations. Data for ionized calcium concentration were available for 66 of the 74 patients. This relationship did not differ significantly between patients with FHH type 1 and those with FHH type 3. Total calcium concentration can therefore be considered a good estimator of ionized calcium concentration in both FHH types 1 and 3 (Supplemental Figure 2).
Mean fasting plasma total calcium concentration was higher in patients with FHH type 3 than in patients with FHH type 1, despite the similar plasma PTH concentrations in these two groups. The feedback effect of hypercalcemia on PTH secretion was therefore more severely blunted in FHH type 3 than in patients with FHH type 1. eGFR values and urinary calcium concentrations were similar in patients with FHH types 1 and 3. Despite having similar values of urinary calcium excretion factored by eGFR, patients with FHH type 3 had higher plasma calcium concentration than patients with FHH type 1 (Figure 4), indicating that the rate of renal tubular absorption of filtered calcium was higher in FHH type 3 than in patients with FHH type 1.
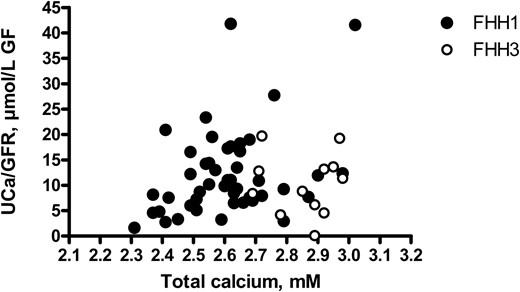
Correlations between plasma total calcium concentration and urinary calcium excretion in FHH types 1 and 3.
No significant correlation was found between plasma total calcium concentration and urinary calcium excretion factored by eGFR in patients with FHH type 1 (closed symbols) or type 3 (open symbols). Values in patients with FHH type 3 were shifted to the right: mean plasma calcium concentration was higher in patients with FHH type 3 than in those with FHH type 1, whereas urinary calcium excretion factored by eGFR did not differ between the two groups.
Discussion
We describe here a large population (n = 220 families) with suspected FHH. One hundred and thirty-three families had FHH type 1, 19 families had type 3, and no patients with type 2 were identified (Figure 1C). In 185 patients from 133 families, we detected 101 CASR distinct mutations, 67% of which have never been described. Most of the detected mutations (85%) are missense mutations causing amino-acid substitutions located within the ECD (61%). All the 68 novel mutations are rare variants; 53 of 68 are missense mutations, which modify highly conserved amino acids and are predicted to be pathogenic by in silico analysis (Supplemental Table 3); 41 of 68 are located in ECD: 10 of them are part or are near of calcium binding sites and five modify cysteine residues that are important for tridimensional structure (Table 1). The global distribution we observed is similar to that described by Hannan et al (1), who observed 91% of missense mutations and 69% affecting the ECD, as well as several mutations in or near the calcium-binding sites, highlighting the importance of the CaSR ECD. The high percentage of potentially pathogenic private mutations confirms the importance to analyze all exons of the CASR gene. In this cohort, the frequency of de novo CASR mutations was estimated at 6.5% (2/31). The familial mutation was detected in 23 of the 25 cases tested, and in six additional cases, the presence of at least one heterozygous brother or sister within the family suggested that one of the parents was heterozygous.
By contrast, the mutations of the AP2S1 gene detected in 24 patients from 19 families corresponded to the three recurrent mutations previously reported to affect the arginine residue in position 15.
Phenotypically, patients with FHH types 1 and 3, genetically negative FHH and PHPT differed from normal subjects for all variables except eGFR. Patients with genetically negative FHH were similar to patients with FHH types 1 or 3; no criterion could be found to differentiate those patients from patients with FHH types 1 or 3.
On average, patients with PHPT had lower total calcium, phosphate, and magnesium concentrations and a higher PTH concentration than patients with FHH types 1 and 3 or genetically negative FHH. They also had a higher urinary calcium excretion than patients with FHH types 1 or 3, showing that the increase in renal calcium absorption was less in patients with PHPT than in patients with FHH types 1 or 3, despite higher PTH concentration. However, most values of the various patients groups overlapped (Table 2, Figure 3 and Supplemental Table 8). Individuals with FHH types 1 or 3 or genetically negative presumed FHH can actually have normal, low, or high levels of urinary calcium excretion; these rates do not seem to be related to the underlying genotype (Supplemental Tables 6 and 7). The overlap of urinary calcium to creatinine ratio (UCa/UCr) values in patients with FHH or PHPT may have major consequences for diagnosis: a diagnosis of PHPT rather than FHH may be considered in patients with high levels of urinary calcium excretion. Plasma PTH concentrations were abnormally high in 23% of the patients with FHH, although normal on average, and largely overlapped with those measured in patients with PHPT. Plasma phosphate concentrations were similar in patients with FHH types 1 and 3 and patients with PHPT: they were shifted toward the lower limit of the normal range in all groups and the overlap between groups was large. When expressed as a z score, plasma phosphate concentration was unaffected by age or PTH concentration, in all groups. A shift in plasma phosphate concentration values in patients with FHH type 3 over the age of 30 years has already been reported in two kindreds (5, 6). This shift is not specific to FHH type 3 as a similar pattern was also observed in FHH type 1 and PHPT. No significant relationship between plasma calcium and phosphate concentrations was detected in our study population with FHH (not shown), suggesting that the shift in plasma phosphate concentration observed here is not directly related to the loss of function of CaSR or AP2σ2.
Some differences in phenotype were observed between patients with FHH types 1 and 3. Mean plasma calcium concentration was significantly higher in patients with FHH type 3 than in those with FHH type 1. The main reason for this was the higher renal tubular absorption rates in patients with FHH type 3 than in those with FHH type 1. Plasma magnesium concentration was higher in patients with FHH type 3 than in those with PHPT. Urinary magnesium excretion values were not available for most of our patients with FHH and we were therefore unable to evaluate renal magnesium handling in patients with FHH types 3 and PHPT. However, as plasma magnesium concentration depends primarily on the renal tubular reabsorption of magnesium (33), patients with FHH type 3 probably reabsorb more magnesium than patients with PHPT. In the kidney, both calcium and magnesium are reabsorbed along the paracellular pathway in the thick ascending limb of the loop of Henle, the principal site of CaSR expression in both humans and rodents (34). In this segment, CaSR inhibition increases paracellular pathway permeability and calcium reabsorption, with no effect on NaCl absorption or transepithelial voltage (34). It remains unclear whether mutations of the gene encoding AP2σ2 can further increase paracellular pathway permeability. Although clathrin mediates endocytosis of the Na+-K+-2Cl− cotransporter NKCC2 (35), there is no evidence that AP2S1 mutations up-regulate NaCl absorption in the thick ascending limb given that the prevalence of hypertension has not been reported to be high in patients with FHH type 3.
Plasma calcium concentration remains high throughout the lives of patients with FHH type 1 or 3. An increase in PTH concentration with age has been reported in the members of one family affected by FHH type 3 (5), despite the presence of normal 25-OH vitamin D concentrations. By contrast, this trend was not observed in a second kindred reported more recently (6). In agreement with the latter, we find no significant correlation between age and PTH concentration in patients with FHH type 3.
During the preparation of this article, Hannan et al (36) reported phenotypic differences between FHH types 1 and 3, with patients with FHH type 3 displaying significantly larger increases in serum calcium and magnesium concentrations associated with a more pronounced suppression of urinary calcium excretion than in patients with FHH type 1. They also observed a phenotype-genotype correlation within the group of patients with FHH type 3. Indeed, the Arg15Leu mutation was found to be associated with the most severe hypercalcemia, whereas the Arg15His mutation was associated with the smallest increases in serum calcium concentration. We were unable to confirm this genotype-phenotype relationship in patients with FHH type 3, despite the inclusion of a study population of similar size to that studied by Hannan (36).
Overall, the data presented here suggest that AP2S1 mutations are responsible for a more severe impairment of calcium homeostasis than CaSR mutations. The negative feedback of extracellular calcium concentration on PTH secretion is more markedly blunted in patients with FHH type 3 than in patients with FHH type 1. Similarly, renal tubular calcium absorption rates are higher in patients with FHH type 3 than in patients with FHH type 1.
Finally, the overlap of biological values between patients with FHH and those with PHPT suggests that the risk of confusion between FHH and PHPT is high.
Acknowledgments
We thank the patients and their families and all the staff of the genetic laboratory and of the physiology department at Georges Pompidou European Hospital. We also thank all the physicians who sent us DNA samples for their patients.
This work was supported by the European Community (FP7EUNEFRON 201590 and the European Community's Seventh Framework Programme (FP7/2007-2013), under Grant Agreement No. 305608 (EURenOmics).
Disclosure Summary: The authors have nothing to disclose
Abbreviations
- AP2σ2
adaptor-related protein complex 2, σ-2 subunit
- [creatinine]P
plasma creatinine concentration
- ECD
extracellular domain
- eGFR
estimated glomerular filtration rate
- FHH
familial hypocalciuric hypercalcemia
- IQR
interquartile range
- OMIM
Online Mendelian Inheritance in Man
- PHPT
primary hyperparathyroidism
- TMD
transmembrane domain.
