


Abstract
The relationship between sex steroids and atherosclerosis is poorly understood.
To describe the association of serum total T (TT), calculated free T (cFT), estrone (E1), estradiol (E2), and SHBG to vascular calcification in adult men.
Observational study (Framingham Heart Study). Analyses are cross-sectional. TT, E1, and E2 were measured by liquid chromatography-tandem mass spectrometry, and SHBG by immunofluorometric assay. Estimates of association were obtained by Tobit regression, which acknowledges the influence of floor effects on outcomes.
General community.
A total of 1654 community-dwelling men from the Offspring and Third Generation cohorts of the Framingham Heart Study.
Coronary artery calcification (CAC), abdominal aortic calcification, and thoracic aortic calcification were measured by computed tomography.
Mean (standard deviation [SD]) age was 49 (10) years. Mean (SD) TT, cFT, and SHBG were: 616 (224) ng/dL, 111 (45) pg/mL, and 46 (23) nmol/L, respectively. Mean (SD) E2 and E1 were 28 (10) and 39 (14) pg/mL. Vascular calcification at all sites was negatively associated with TT and cFT and positively associated with E2 and E1. A 100-ng/dL between-subjects increase in TT was associated with a mean (95% confidence interval) age-adjusted difference in CAC of −23% (−41%, −4%) (P = .02). After model adjustment for other cardiovascular risk factors, the estimated associations between T and vascular calcification scores were statistically nonsignificant.
Decreased circulating T and E2 levels are associated with an age-adjusted increase in CAC, but these associations appear to express relationships either attributable to or mediated by established cardiovascular risk factors.
Age-related declines in circulating T concentrations have been associated with increased morbidity in aging men (1–6), but the association between endogenous T and cardiovascular health in aging is controversial. The association of male sex with the risk of myocardial infarction and other cardiovascular disease events invites the suggestion that T may promote and estrogen may protect against cardiac risk (7), but in studies in men, the opposite has typically been observed (8, 9). The balance of epidemiological data is suggestive of a protective role for T in cardiovascular illnesses and deaths to which the illnesses contribute (3, 10), although these findings are not universal (11) and exhibit some variation with the population under study (12). At the same time, a limited body of evidence suggests the potential for excess cardiovascular risk resulting from T replacement therapy in older men with multimorbidity (13–16).
Coronary artery calcification (CAC) is a subclinical marker of atherosclerosis and a strong independent predictor of the risk of coronary heart disease (CHD). CAC is consistently associated with established cardiovascular risk factors (17, 18). Recent results from the Multi-Ethnic Study of Atherosclerosis (MESA), for example, demonstrate that both the volume and progression of CAC are predictive of incident CHD and related events (19, 20), findings similar to those observed elsewhere (18, 21–24). CAC predicts risk over and above conventional CHD risk factors (25), and CAC may be especially predictive among asymptomatic subjects at low to intermediate risk of disease progression (22, 26).
As markers of cardiovascular risk, abdominal aortic calcification (AAC) and descending thoracic aortic calcification (TAC) have generally received less attention than CAC. A recent meta-analysis, however, confirmed that AAC is a strong independent predictor of coronary events and cardiovascular mortality (27). TAC often tracks with CAC (28, 29), but it may be a stronger predictor of noncardiac and cerebrovascular events (30). Parental occurrence of premature cardiovascular disease predicts AAC and CAC in adult offspring in the Framingham Heart Study (FHS) and of CAC in MESA (31).
There has been relatively little investigation of the direct association of endogenous sex hormones and vascular calcification in male population-based samples. In earlier studies with small sample sizes, there was an inverse relation between estradiol (E2) and generalized arterial calcification in men (32). These data are consistent with a hypothesis of a preventative influence of T on atherosclerosis in male mice being transmitted via its aromatization to E2 (33). In the Rotterdam study, reduced circulating T was predictive of aortic calcification (34), but AAC was not related to total T, E2, or SHBG in men enrolled in MESA (35). More recently, results from the Multicenter AIDS Cohort Study (MACS) showed no association between calculated free T (cFT) and CAC in either HIV-infected or HIV-uninfected men (36), whereas by contrast a study of nonobese Korean men demonstrated a negative association between bioavailable (ie, free + albumin bound) T and coronary calcification among participants in whom some calcification was present (37). The role of estrone (E1) in male cardiometabolic health remains poorly understood (6, 38–40); its relation to vascular calcification has not been explored.
In this analysis, we utilized observational data from the Offspring cohort and Third Generation cohort of the FHS to determine whether total T, cFT, E1, E2, or SHBG exhibits cross-sectional association with CAC, AAC, or TAC either alone or in the presence of conventional CHD risk factors. We measured T, E1, and E2 using liquid chromatography/tandem mass spectrometry (LC-MS/MS), widely considered the reference standard.
Subjects and Methods
The FHS study design has been previously described (41). An original cohort sample of 5209 adult male and female residents of Framingham, Massachusetts, was recruited in 1948. The original FHS cohort was predominantly white and of European ancestry. In 1971, children of the original cohort and their spouses were recruited as a second generation Offspring cohort. Recruitment of a Third Generation cohort, consisting of children of the Offspring cohort, was performed in 2002. All participants executed written informed consent approved by the institutional review board at the Boston University Medical Center.
Analyses described here were based on data from men of the Offspring cohort with sex steroid measurements obtained at Examination 7, occurring between 1998 and 2001, and from men of the Third Generation cohort, who had sex steroid measurements between 2002 and 2005. Data on AAC, TAC, CAC, and covariates were obtained concurrently.
Multidetector computed tomography (MDCT)
Vascular calcification was measured using eight-slice MDCT (Lightspeed Ultra; GE Healthcare) as previously described (42, 43). For the chest, 2.5-mm slices were acquired from the carina to the diaphragm during an inspiratory breath hold at 70% of the cardiac cycle (120 kVp, 320 mA). For the abdomen, 2.5-mm slices (120 kVp, 320 mA) were obtained of a 125-mm abdominal segment using the upper edge of the S1 vertebrae as the anatomic landmark of the lower field. The presence of calcium was determined using a workstation (Acquarius; Terarecon). Calcium was quantified using the Agatston method, adapted for use with MDCT (42, 44); results are expressed here in Agatston units (AUs). Models considering the crude presence of calcification contrasted measurements of CAC, AAC and TAC with AU = 0 to those with AU > 0. We also contrasted those individuals with AU < 100 to those with AU > 100.
Hormone measurement
Blood samples were drawn in the supine position in the early morning after an overnight fast. Sera were aliquoted and immediately stored at −70°C, remaining frozen until the time of assay. Serum total T levels were measured by LC-MS/MS as previously described (41). The functional sensitivity of the total T assay was 0.07 nmol/L, and the interassay coefficient of variation was 15.8% at 0.42 nmol/L, 10.6% at 0.82 nmol/L, 7.9%, at 1.7 nmol/L, 7.7% at 8.4 nmol/L, 4.4% at 18.5 nmol/L, and 3.3% at 35.3 nmol/L, respectively. As part of the Testosterone Assay Harmonization Initiative of the Centers for Disease Control (CDC), quality control samples provided by the CDC were run every 3 months; the bias in quality control samples with T concentrations in the 3.5–35 nmol/L range was consistently < 6.2%. Serum E2 and E1 levels were measured simultaneously using LC-MS/MS after derivatization with dansyl chloride (45). The limit of quantitation for both hormones was 2 pg/mL. Interassay coefficients of variation for E1 were 4.5, 7.7, and 6.9% at E1 concentrations of 29.6, 285, and 773 pmol/L, respectively; and for E2, 6.9, 7.0, and 4.8% at E2 concentrations of 29.3, 283, and 756 pmol/L, respectively.
SHBG was measured using a two-site directed immunofluorometric assay that had a sensitivity of 0.5 nm (Delphia-Wallac, Inc); cFT was estimated from total T, SHBG, E1, and E2 using the law of mass action (46).
Measurement of covariates
Standard anthropometric and risk factor measurements were obtained as previously described (47, 48). Age was determined at the date of the participant examination visit (at which blood was obtained). Body mass index (BMI) was computed from standardized measures of height and weight obtained during clinical study visits. Information regarding medication usage was collected. Glucose, high-density lipoprotein (HDL) and low-density lipoprotein cholesterol, and triglycerides were obtained from measurement of fasting blood samples. Diastolic blood pressure was obtained in the seated position from the average of two measurements taken > 5 minutes apart in the left arm. The presence of type 2 diabetes mellitus (T2DM) was indicated by a fasting serum glucose measurement > 6.94 mmol/L and/or participant use of antidiabetic medications. Hypertension was diagnosed by the presence of a systolic blood pressure ≥ 140 mm Hg, diastolic blood pressure ≥ 90 mm Hg, or reported use of antihypertensive medication. Current smokers reported smoking at least one cigarette per day over the preceding year.
Analytic sample
A total of 1773 participants were included in both the calcium and hormone sampling studies. Of these, 1657 (93%) had complete calcium and hormone data and did not report the use of androgen or antiandrogen therapies. Three additional participants were excluded due to abnormally high circulating T values (total T > 2400 ng/dL or cFT > 350 pg/mL). This left 1654 participants eligible for inclusion in analyses. We also performed sensitivity analyses that were restricted to “healthy older” participants at least 60 years old who did not have prevalent diabetes or a history of cardiovascular disease.
Statistical analysis
Analyses were performed using SAS version 9.2 (SAS Inc) and R version 2.15.2 (R Foundation for Statistical Computing). Exploratory analyses of association included smoothing via generalized additive models (49). Owing to the large number of subjects with undetectable or nearly undetectable levels of calcification, analyses of continuous CAC, AAC, and TAC were performed using Tobit regression, which acknowledges this disproportionately large “spike” at the floor of the sampling distribution of the outcome variable, while positing a linear association between covariates and the outcome above said floor. Analyses of the presence/absence of calcification quantified association between covariates and these dichotomous outcomes via odds ratio estimates derived using logistic regression. For all models, measures of association between sex steroids and measures of calcification were adjusted first for age alone. We then fit a second set of multivariable-adjusted models including all covariates described above (including age).
To provide for ease of interpretation, Tobit regression coefficients were scaled according to the median of the relevant outcome measurement (CAC, AAC, TAC) measured among subjects with detectable calcification. Thus the estimated slope parameter may be interpreted as roughly equivalent to cross-sectional proportionate differences observed among “typical” participants with calcification levels greater than zero.
Sensitivity analyses considered the regressions described above for subjects who were less than and greater than 60 years of age, as well as a parallel set of analyses restricted to the “healthy older” cohort described above.
Results
Characteristics of the participants
A total of 1654 men contributed to the analysis. A description of baseline characteristics and sex hormone levels is provided in Table 1. Mean (SD) total and free T levels were well within the normal range at 617 (224) ng/dL and 111 (45) pg/mL, respectively. Total and free T decreased, whereas E1 and E2 increased (cross-sectionally) with age, as has been previously reported (41, 50). As expected, total and free T were negatively associated with BMI and demonstrated positive association with HDL cholesterol; E1 and E2 demonstrated parallel associations, but these were not as strong.
Description of Baseline Covariates and Hormone Levels
| CAC < 100 AU | CAC ≥ 100 AU | |
|---|---|---|
| n | 1229 | 425 |
| Age, y | 45 (8) | 59 (10) |
| BMI, kg/m2 | 28 (4) | 29 (5) |
| Diastolic blood pressure, mm Hg | 79 (9) | 77 (10) |
| HDL-cholesterol, mg/dL | 46 (12) | 45 (14) |
| Total cholesterol, mg/dL | 196 (34) | 192 (35) |
| Triglycerides, mg/dL | 135 (96) | 153 (112) |
| T2DM | 48 (4%) | 63 (15%) |
| Prevalent cardiovascular disease | 19 (2%) | 65 (15%) |
| Current smoking | 164 (13%) | 53 (12%) |
| Total T, ng/dL | 625 (216) | 596 (246) |
| Free T, pg/mL | 117 (45) | 94 (42) |
| E1, pg/mL | 39 (14) | 47 (17) |
| E2, pg/mL | 28 (10) | 27 (9) |
| SHBG, nmol/L | 43 (21) | 55 (27) |
Data are expressed as mean (SD) or number (percentage); n = 1654.
A description of the vascular calcification measures is given in Table 2. A substantial proportion of participants had zero scores for CAC and AAC; 80% of subjects had no detectable TAC, and 89% had TAC < 100 AU. Among subjects with detectable calcification, the median CAC, AAC, and TAC were 91, 392, and 131 AU, respectively. The Spearman correlation between CAC and AAC was 0.41, whereas the correlation between CAC and TAC was 0.15.
Description of Measures of Vascular Calcification
| Mean (SD), AU | Median, AU | Participants with AU > 0 | Participants with AU ≥ 100 | Median, AU, among participants with AU ≥ 100 | |
|---|---|---|---|---|---|
| CAC | 201 (557) | 2 | 894 (54%) | 425 (26%) | 418 |
| AAC | 845 (2101) | 5 | 912 (55%) | 614 (37%) | 1128 |
| TAC | 147 (788) | 0 | 329 (20%) | 179 (11%) | 404 |
Total and free T
Analyses of association between sex steroids and calcification measures by Tobit regression are presented in Table 3. Regression estimates are scaled according to medians provided in the right most column of Table 2. For instance, among subjects with detectable CAC, the estimated mean absolute difference in CAC per 100 ng/dL cross-sectional increase in total T is −21 AU, with corresponding 95% confidence interval (CI) of −38 to −4 AU. Scaled to the median CAC among subjects with detectable calcification (91 AU), this translates to a cross-sectional mean (95% CI) trend of −23% (−41%, −4%), the CAC of the median participant per 100 ng/dL cross-sectional increase in total T. Using this scaling method, the directionality, magnitude, and statistical significance of age-adjusted associations between sex steroid levels and CAC are similar to those with AAC (Table 3).
Tobit Regression: Weighted Proportionate Difference in Calcification per Difference in Sex Steroid Levels, Scaled to Median Calcification Among Those With Detectable Calciuma
| Age-Adjusted | Multivariable-Adjustedb | |||
|---|---|---|---|---|
| % Difference (95% CI) | P Value | % Difference (95% CI) | P Value | |
| CAC | ||||
| Total T, 100 ng/dL | −23 (−41, −4) | .02 | −0.8 (−20, 19) | .94 |
| Free T, 10 ng/dL | −12 (−22, −2) | .02 | −6 (−16, 4) | .25 |
| SHBG, 10 nmol/L | −5 (−24, 13) | .58 | 12 (−7, 31) | .21 |
| E1, pg/mL | 2 (−1, 4) | .25 | −0.7 (−4, 2) | .65 |
| E2, pg/mL | −4 (−8, 1) | .09 | −5 (−9, −1) | .01 |
| AAC | ||||
| Total T, 100 ng/dL | −21 (−36, −7) | .004 | −0.4 (−15, 14) | .95 |
| Free T, 10 ng/dL | −13 (−21, −5) | .002 | −6 (−14, 2) | .13 |
| SHBG, 10 nmol/L | −0.3 (−15, 14) | .97 | 13 (−1, 28) | .08 |
| E1, pg/mL | 4 (2, 6) | <.001 | 2 (−0.2, 4) | .09 |
| E2, pg/mL | −0.3 (−4, 3) | .86 | −0.6 (−4, 3) | .69 |
| TAC | ||||
| Total T, 100 ng/dL | −45 (−89, −0.8) | .046 | −16 (−61, 29) | .47 |
| Free T, 10 ng/dL | −25 (−53, 3) | .08 | −12 (−39, 15) | .38 |
| SHBG, 10 nmol/L | −11 (−53, 30) | .59 | 8 (−34, 50) | .70 |
| E1, pg/mL | 15 (9, 21) | <.001 | 11 (5, 17) | <.001 |
| E2, pg/mL | −3 (−14, 7) | .55 | 0.2 (−9, 10) | .96 |
See Table 2.
Adjusted for age, BMI, T2DM, HDL-cholesterol, total cholesterol, triglycerides, smoking, diastolic blood pressure, and prevalent cardiovascular disease.
In age-adjusted analyses, there were statistically significant negative associations of total T and cFT with calcification at all sites, whereas there was a positive association of E1 with AAC and TAC. After adjustment for the other covariates, the associations between total and free T and the calcification measures were reduced in magnitude and became statistically nonsignificant. In secondary analyses (results not shown), the associations between total or free T and each of the measures of calcification became nonsignificant after adjustment for age, BMI, and T2DM.
E2 and E1
In the multivariate model, E2 was negatively and significantly associated with CAC, whereas E1 was positively associated with TAC (Table 3). E1 was likewise positively associated with AAC in age-adjusted models, but the magnitude of this effect was reduced substantially and was nonsignificant once other factors were considered. The association between E2 and CAC was essentially unchanged in an alternative model controlling for SHBG in addition to the covariates listed in Table 3.
Sensitivity analysis
Sensitivity analyses suggested that positive associations between E1 and AAC or TAC might be of lesser magnitude among younger as opposed to older subjects, although the evidence in favor of such age × hormone interactions was nonsignificant. Analyses restricted to the healthy older subsample were consistent with this trend; the directionality and significance of associations was similar to those displayed in Table 3, and the magnitude of effects was of modestly greater magnitude. A similar pattern occurred with E2 and CAC—estimates of negative association were somewhat greater in absolute magnitude when attention was restricted to the healthy older subset. By contrast to the pattern for T, E2, or E1, there was no meaningful association of SHBG with vascular calcification even in models adjusting only for age.
In logistic regression models, there was a negative age-adjusted association between T and CAC (dichotomized at 100 AU) that became nonsignificant after adjustment for other cardiovascular risk factors (Figure 1). Similar patterns of association were observed for AAC and TAC. Results were similar in alternative models comparing those with CAC < 100 to those with CAC ≥ 100.
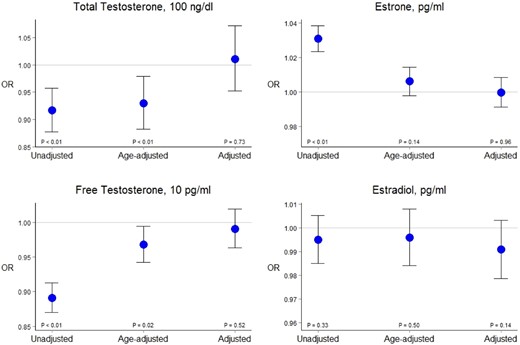
Logistic regression: cross-sectional association of sex hormones and the presence of detectable CAC.
In unadjusted or age-adjusted models, total circulating T concentrations exhibit a statistically significant negative association with CAC (first three CI values, left to right, respectively). After adjustment for conventional risk factors, however, T and CAC are nearly independent (final interval, with point estimate indistinguishable with the null value). Control for age and other factors induced similar effects for free T, E2, and E1.
Discussion
In a cross-sectional analysis of data from men in the Offspring cohort and the Third Generation cohort of the FHS, we observed age-adjusted associations between total or free T and measures of coronary and aortic calcification, but these associations became attenuated and statistically nonsignificant after adjustment for conventional CHD risk factors, notably BMI and diabetes status. In models accounting for age alone, SHBG exhibited no association with any of the measures of calcification, E2 was negatively associated with CAC, and E1 was positively associated with TAC.
In the Tobit regression model, control for other factors was not sufficient to account for the relationship between circulating E1 levels and TAC, with a similar (though nonsignificant) trend in association with AAC.
Age-related changes in sex steroids have been implicated in the development of illnesses of aging, including obesity, T2DM, osteoporosis, sarcopenia, and mobility limitation and frailty. It remains unclear whether age-related declines in T levels are a cause of, or rather tend to co-occur with, the constellation of illnesses and symptoms that are featured in male aging (51). Although the phenotypic resemblance between androgen insufficiency in younger men and typical male aging has long been noted, age-related trends in sex steroids appear to be blunted in men reporting excellent health (52), and serum sex steroid levels are influenced by health behaviors (notably smoking) as well as comorbidities to which they are also thought to contribute (notably changes in body composition) (52, 53). This suggests that the sex hormone alterations attending older age in men may have more to do with comorbidity than with aging per se.
Our finding of an association between both T and E2 with vascular calcification in age-adjusted models, but not in multivariable-adjusted models—consistent with results from MESA and MACS (35, 36)—appears to accord with this interpretation. Our models suggest that the observed association between T, E2, and calcification is due to their joint correlation with conventional CHD risk factors or, alternatively, that the influence of sex steroids on cardiovascular calcification is transmitted along pathways that those risk factors define.
At the same time, the persistence of the association between E1 and TAC, in keeping with prior evidence of a role for E1 in the development of atherosclerosis (39, 40) and in cardiometabolic health more broadly (50), is suggestive of a potential role for estrogens in the development of CHD in men, somewhat reminiscent of that typically observed in women (54). Although it is seemingly counterintuitive that results obtained on E1 do not track those on E2, E1 is synthesized from androstenedione whereas E2 is derived from T, and the two hormones may exhibit differential activity in estrogen receptor subtypes, which in turn exhibit differential association with coronary atherosclerosis (55). This, along with the fact that E2 (but not E1) is a likely direct mediator of T action on atherosclerotic risk (33), lends some plausibility to the notion that E1 might express associations dissimilar from those observed for T, even as E2 does not.
These analyses have several strengths and also certain limitations. We measured T, E2, and E1 using LC-MS/MS, the method with the highest accuracy and sensitivity. The cohort included community-dwelling men over a wide age range (19 to 89 years) in whom cardiovascular risk factors and disease have been well characterized. At the same time, the cross-sectional nature of the relationships renders assertions of causal association speculative. Free T is calculated rather than directly measured, adding to the uncertainty in measurements.
Finally, the FHS cohorts are largely homogenous in terms of ethnicity, geography, and to a lesser degree socioeconomic status, potentially inhibiting the generalizability of results. This sample is also relatively young and healthy; sensitivity analyses suggest that the effects observed might be somewhat stronger among older individuals, but we cannot speculate further.
These results provide additional evidence for the lack of association of either circulating T or E2 with atherosclerosis in aging men, independent of conventional CHD risk factors, but our data suggest a potential independent role for E1. Prospective studies are needed to confirm or rule out this putative association in adult men.
Acknowledgments
This work was supported primarily by National Institutes of Health Grants 1RO1AG31206 and 5R01DK092938 (to S.Bh. and R.S.V.). Additional support was provided by the Boston Claude D. Pepper Older Americans Independence Center Grant 5P30AG031679 from the National Institute on Aging and by a grant from the CDC Foundation. The Framingham Heart Study is supported by the National Heart, Lung, and Blood Institute Contract N01-HC-25195.
Disclosure Summary: The authors have nothing to disclose.
Abbreviations
- AAC
abdominal aortic calcification
- AU
Agatston unit
- BMI
body mass index
- CAC
coronary artery calcification
- cFT
calculated free T
- CHD
coronary heart disease
- CI
confidence interval
- E1
estrone
- E2
estradiol
- HDL
high-density lipoprotein
- LC/MS-MS
liquid chromatography/tandem mass spectrometry
- MDCT
multidetector computed tomography
- TAC
thoracic aortic calcification
- T2DM
type 2 diabetes mellitus.
