


Abstract
This study aimed to investigate whether reported high mortality in childhood recombinant human GH (rhGH)-treated patients was related to birth-characteristics and/or rhGH treatment.
We sought to develop a mortality model of the Swedish general population born between 1973 and 2010, using continuous-hazard functions adjusting for birth characteristics, sex, age intervals, and calendar year to estimate standardized mortality ratio (SMR) and to apply this model to assess expected deaths in Swedish rhGH-treated patients with idiopathic isolated GH deficiency (IGHD), idiopathic short stature (ISS) or born small for gestational age (SGA).
The general population: Swedish Medical Birth Register (1973–2010: 1 880 668 males; 1 781 131 females) and Cause of Death Register (1985–2010).
Three thousand eight hundred forty-seven patients starting rhGH treatment between 1985 and 2010 and followed in the National GH Register and/or in rhGH trials diagnosed with IGHD (n = 1890), ISS (n = 975), or SGA (n=982).
Death.
Using conventional models adjusting for age, sex, and calendar-year, the SMR was 1.43 (95% confidence interval, 0.89–2.19), P = .14, observed/expected deaths 21/14.68. The rhGH population differed (P < .001) from the general population regarding birth weight, birth length, and congenital malformations.
When applying the developed mortality model of the general population, the ratio of observed/expected deaths in rhGH-treated patients was 21/21.99; SMR = 0.955 (0.591–1.456)P = .95.
Expected number of deaths were 14.68 (14.35–14.96) using the conventional model, and 21.99 (21.24–22.81) using the advanced model, P < .001, which had at all ages a higher gradient of risk per SD of the model, 24% (range, 18–42%; P < .001).
Compared with the general Swedish population, the ratio of observed/expected deaths (21/21.99) was not increased in childhood rhGH–treated IGHD, ISS, and SGA patients when applying an advanced sex-specific mortality model adjusting for birth characteristics.
Treatment with human growth hormone (hGH) has been used for more than 50 years (1). Reports of Creuzfelt-Jacobs disease caused by pituitary-derived hGH led to more widespread availability of recombinant human GH (rhGH) from 1985, which made both higher GH doses possible and a broader range of therapeutic indications (2–4). Due to this short history, there is insufficient information on long-term mortality in patients treated with rhGH during childhood (5). So far, knowledge regarding safety has been obtained from patients followed in large postmarketing databases collecting data mainly during and shortly after treatment (6–10). In an attempt to address this gap in knowledge, Safety and Appropriateness of GH treatments in Europe (SAGhE) was established to collect data from rhGH-treated patients between 1985 and 1997 in eight European countries (11, 12). A report of the French SAGhE cohort of 6928 cases suggested that overall mortality was increased in patients treated with rhGH during childhood, ie, patients with idiopathic isolated GH deficiency (IGHD), idiopathic short stature (ISS), or those born small for gestational age (SGA) (13). Despite low patient numbers, the publication reported specific increases in death caused by bone tumors and cerebrovascular diseases (13). The release of these data caused major concerns worldwide (14, 15). In contrast with the French SAGhE cohort, no deaths caused by bone tumor or cerebrovascular diseases were detected in the SAGhE cohorts in Belgium, The Netherlands, and Sweden of 2543 patients (16). In the French SAGhE cohort, rhGH-treated children with IGHD, ISS, or SGA were considered to be at low risk of mortality-related to malignancies compared with the medium risk group of children with syndromes and known diseases, and the high-risk group that comprised children treated for malignancies or kidney diseases (11, 12). One of the main points of criticism has been the comparison of the French SAGhE cohort with the general French population due to the extensive literature on mortality and morbidity associated with being born small, and/or born prematurely (17–19). However, it should be possible to investigate the influence of birth characteristics on mortality in a population previously treated with rhGH in childhood. First, it is crucial to identify the key variables that must be taken into account when comparing GH-treated and untreated individuals from the background population, to elucidate the safety and efficacy of treatment. Pretreatment characteristics of the patients are of interest as they may be related to the underlying diagnosis or pathology, but post-treatment characteristics may also be relevant, such as adult height, body mass index, socioeconomic situation (20, 21), and whether GH-replacement therapy was continuous during adulthood (22).
Development of continuous hazard functions is a way to estimate the number of expected deaths in a population with a high degree of accuracy by adjusting for a number of relevant variables (23). Such functions can describe how the rate of death changes as a function of not only the calendar year and chronological age of the individuals, but also other relevant variables. The methodology deals with nonlinear associations and needs large datasets. The resulting models can provide reliable and accurate calculations of expected mortality after adjusting for all included variables, and can thus replace earlier naive calculations based on large population averages as used in conventional standardized mortality ratio (SMR) calculations.
Aim
Our aim was to use the novel technique of continuous hazard functions to calculate the expected number of deaths in a cohort of rhGH-treated children with IGHD, ISS, or SGA. Functions were adjusted for a set of birth variables in addition to the commonly used covariates chronological age, sex, and calendar year. The hypothesis was that the death hazard coincides with that of individuals in the general population only when taking these covariates into consideration. A secondary aim was to compare the expected number of deaths calculated from such an advanced mortality model considering an extended set of covariates with those calculated from a conventional model, adjusting only for the covariates chronological age, sex and calendar year (24).
Materials and Methods
Ethics
The study was approved by the local ethics committee at the Karolinska Institute, Stockholm, Sweden (dnr: 2010/578-31/1, 2011/109-32/1 and 2011/305-32). The National GH Register study was approved by all Swedish ethics committees (dnr: 1988/62-88). The rhGH clinical trials TRN89-071, TRN88-080, TRN88-177, TRN89-070-01, TRN89-071-01, TRN98-0198-003, TRA6280-003, TRN151:142/01, TRN2009/529-31 were approved by the appropriate Swedish ethics committees. Informed consent was obtained from all children, if old enough, and their parents, for participation in National GH Register and/or clinical rhGH trials. The ethics board at the Karolinska Institute approved the use of information for the present mortality analyses without receiving new informed consent from the patients. All studies were performed in accordance with the 2008 Declaration of Helsinki.
Materials
The advanced model was developed based on data from all 3 661 799 individuals in the general Swedish population born between 1973 and 2010, and applied to data from all 3847 Swedish patients who initiated rhGH treatment during childhood between 1985 and 2010.
General Swedish population
Swedish medical birth register, register of congenital malformations, and register of child cardiology
The general Swedish population born between 1973 and 2010 consisted of 3 714 585 individuals (25–27). Complete information on birth weight, birth length, and GA was available for 3 661 799 individuals, and was used in the modeling. Birth information was missing in 52 786 individuals, with birth length missing in 41 659 cases, Table 1. For the present study, a preliminary analysis was performed using available data to identify parameters of importance. Apart from the aforementioned common variables, two main subgroups of malformations were identified: one related to malformation of the cardiovascular system, and the other related to all other malformations including syndromes. Minor abnormalities such as hip dislocation, have not been included as malformations in the modeling. As expected, malformations have a dramatic effect on mortality early in life but also have an effect later in life. The specific malformations included are tabulated in Supplemental Table 1.
Descriptive Data for the General Population (Individuals Born in Sweden 1973–2010) and for the rhGH-treated (IGHD, ISS, and SGA) Study Population in Sweden
| Group | GA, wk | Birth LengthSDS | Birth WeightSDS | Cardiovascular Malformations | Other Selected Malformations |
|---|---|---|---|---|---|
| General Population | |||||
| All (n = 3 714 585) | 39.8 (1.9) | −0.465 (1.281) | −0.275 (1.101) | 32 167 (0.9%) | 62 716 (1.7%) |
| 40.1 (39.0; 41.0) | −0.452 (−1.251; 0.344) | −0.230 (−−0.930; 0.438) | |||
| n = 3 706 791 | n = 3 672 926 | n = 3 703 471 | |||
| Males (n = 1 908 906) | 39.8 (2.0) | −0.442 (1.279) | −0.300 (1.106) | 15 892 (0.8%) | 47 897 (2.5%) |
| 40.1 (39.0; 41.0) | −0.452 (−1.234; 0.352) | −0.252 (−0.955; 0.415) | |||
| n = 1 904 869 | n = 1 886 351 | n = 1 903 122 | |||
| Females (n = 1 805 679) | 39.8 (1.9) | −0.489 (1.283) | −0.248 (1.095) | 16 275 (0.9%) | 14 819 (0.8%) |
| 40.0 (39.0; 41.0) | −0.471 (−1.254; 0.318) | −0.205 (−0.903; 0.462) | |||
| n = 1 801 922 | n = 1 786 575 | n = 1 800 349 | |||
| rhGH population | |||||
| All (n = 3847) | 38.4 (3.2)b | −1.92 (1.63)b | −1.38 (1.57)b | 81 (2.1%) b | 135 (3.5%)b |
| 39.0 (38.0; 40.0) | −1.78 (−2.76; −0.83) | −1.17 (−2.15; −0.34) | |||
| n = 3508 | n = 3478 | n = 3593 | |||
| Males (n = 2562) | 38.5 (3.1)b | −1.86 (1.59)b | −1.40 (1.56)b | 43 (1.7%)b | 113 (4.4%)b |
| 39.0 (38.0; 40.0) | −1.78 (−2.76; −0.83) | −1.21 (−2.13; −0.40) | |||
| n = 2365 | n = 2338 | n = 2414 | |||
| Females (n = 1285) | 38.2 (3.3)b | −2.03 (1.70)b | −1.34 (1.60)b | 38 (3.0%)b | 22 (1.7%)b |
| 39.0 (38.0; 40.0) | −1.79 (−3.02; −0.91) | −1.11 (−2.23; −0.27) | |||
| n = 1143 | n = 1140 | n = 1179 | |||
| IGHD: all (n = 1890) | 38.7 (2.9)b | −1.68 (1.49)b | −1.16 (1.42)b | 30 (1.6%)a | 51 (2.7%)b |
| 39.0 (38.0; 40.0) | −1.55 (−2.53; −0.74) | −1.02 (−1.88; −0.22) | |||
| n = 1719 | n = 1715 | n = 1769 | |||
| ISS: all (n = 975) | 38.6 (2.8)b | −0.831 (0.863)b | −0.448 (0.841)b | 17 (1.7%)a | 29 (3.0%)a |
| 39.0 (38.0; 40.0) | −1.000 (−1.464; −0.360) | −0.504 (−1.066; 0.100) | |||
| n = 851 | n = 838 | n = 858 | |||
| SGA: all (n = 982) | 37.6 (3.8)b | −3.35 (1.40)b | −2.61 (1.58)b | 34 (3.5%)b | 55 (5.6%)b |
| 39.0 (36.0; 40.0) | −3.02 (−4.02; −2.40) | −2.39 (−3.39; −1.52) | |||
| n = 938 | n = 925 | n = 966 |
Birth lengthSDS and birth weightSDS are based on Niklasson and Albertsson-Wikland (32).
For categorical variables n, (%) is presented. For continuous variables, Mean (sd) Median (Q1;Q3), and n = is presented.
P < .001 when testing for difference against corresponding general population (all, males or females).
P < .01 when testing for difference against corresponding general population (all, males, or females).
Cause-of-death register
The cause of death was retrieved from the Swedish National Cause of Death Register (1961–2010). A census date of 31 December 2010 was used (Supplemental Table 2).
Swedish rhGH-treated population
This analysis included all patients age 0–18 years who had received at least one injection of any brand of rhGH from May 1985 until the censoring date of 31 December 2010. In total, 3847 patients (2562 males, 1285 females) were included; 1890 with IGHD, 975 with ISS, and 982 born SGA (Supplemental Table 3). Patients were categorized by K.A.W., using definitions stated in Supplemental Data, as having IGHD (28, 29), ISS (30–32), or SGA (30–32) based on data recorded at the time of diagnosis and treatment start. For those 102 cases in which information on GHmax, GA or birth size were missing, the diagnosis of the referring physician was used.
All rhGH-treated patients were followed in the National GH Register (33), and/or in clinical trials of rhGH [TRN89-071, TRN88-080 (2), TRN88-177 (34), TRN89-070-01 (3), TRN89-071-01 (3), TRN98-0198-003 (35), TRA6280-003, TRN151:142/01, TRN2009/529-31].
The mean rhGH dose during treatment was 36 μg/kg/d over a median of 5.51 (range, 0.003–18.11) years of treatment. Median chronological age at the censoring date was 20.9 (range, 2.1–41.8) years. Follow-up data were available for a median of 11.7 (range, 0.0–37.5) years and death occurred at a median of 19.3 (range, 7.8–33.5) years. Vital status was available for 98% of patients. Total person-years of observation were 44 836.
Statistical methods, modeling
To estimate the expected rate of death in the treated population, first a Poisson model was constructed, which modeled the mortality of the general population using a continuous hazard function. The hazard function describes the momentary risk of death and from this the probability of death in an interval can be estimated. When summed across a population, this will be equivalent to the expected number of deaths, for estimating the relative risk in that population.
The hazard function was defined as a function of time, allowing the log hazard to vary as a piecewise linear function of age and calendar year, as well as of other variables. The effect of a variable was determined by a model parameter, the β coefficient, which reflects the logarithm of the hazard ratio (HR) for that particular variable. The effect of a variable will be expected to vary in relation to age or some other time factor. For example, a malformation may have a much greater affect early in life compared with later in life. Thus, the models were constructed to allow for the effect of age to vary by including interactions with age such that all the different parameters may vary in a continuous piecewise linear fashion. This is an important difference from the commonly used Cox proportional hazards model, which can handle changes in predictor values over time, but not changes in the coefficients of those predictors. Simplified descriptions of all the predictors are found in Table 2 and the full mathematical expressions are found in Supplemental Table 4. To model differences between genders the model parameters were estimated separately for males and females.
Resulting Hazard Ratios (HR), 95% CIs, and P for the Variables Included in the Mortality Model Based on the General Population of Individuals Born in Sweden 1973–2010 (n = 3 661 799), Separate for Each Sex
| Predictor | Males | Females | ||||
|---|---|---|---|---|---|---|
| HR | 95% CI | P Value | HR | 95% CI | P Value | |
| Piecewise linear age, y | ||||||
| 0–1/2 y | 0.001 | 0.001–0.002 | <.0001 | 0.002 | 0.002–0.003 | <.0001 |
| 1/2–2 y | 0.542 | 0.509–0.578 | <.0001 | 0.463 | 0.431–0.497 | <.0001 |
| 2–12 y | 0.918 | 0.905–0.931 | <.0001 | 0.922 | 0.906–0.938 | <.0001 |
| 12–20 y | 1.226 | 1.205–1.247 | <.0001 | 1.122 | 1.097–1.147 | <.0001 |
| 20–35 y | 0.936 | 0.921–0.952 | <.0001 | 0.945 | 0.924–0.966 | <.0001 |
| 35+, y | 0.892 | 0.782–1.018 | .0895 | 1.090 | 0.913–1.300 | .3394 |
| Piecewise linear, y past 1970 | ||||||
| 0–20 y (1970–1990) | 0.956 | 0.952–0.96 | <.0001 | 0.959 | 0.955–0.964 | <.0001 |
| 20–30 y (1990–2000) | 0.948 | 0.942–0.954 | <.0001 | 0.954 | 0.947–0.962 | <.0001 |
| 30+, y (2000–) | 0.962 | 0.953–0.972 | <.0001 | 0.967 | 0.955–0.978 | <.0001 |
| Piecewise linear GA, wk | ||||||
| <38, wk | 0.741 | 0.735–0.747 | <.0001 | 0.742 | 0.734–0.749 | <.0001 |
| 38–42, wk | 0.823 | 0.809–0.836 | <.0001 | 0.827 | 0.811–0.844 | <.0001 |
| >42, wk | 0.835 | 0.782–0.893 | <.0001 | 0.984 | 0.911–1.062 | .6781 |
| Piecewise linear birth lengthSDS | ||||||
| <−1.5 | 0.856 | 0.837–0.875 | <.0001 | 0.832 | 0.813–0.852 | <.0001 |
| −1.5–0 | 0.897 | 0.865–0.931 | <.0001 | 0.916 | 0.875–0.958 | .0001 |
| 0–1.5 | 1.088 | 1.036–1.141 | .0007 | 1.055 | 0.990–1.125 | .0993 |
| >1.5 | 0.928 | 0.875–0.983 | .0115 | 0.891 | 0.829–0.958 | .0017 |
| Piecewise linear birth weightSDS | ||||||
| <0 | 0.877 | 0.794–0.969 | .0096 | 1.056 | 0.933–1.194 | .3895 |
| >0 | 0.974 | 0.879–1.078 | .6105 | 1.211 | 1.064–1.378 | .0036 |
| Malformations | ||||||
| Cardiovascular | 46.862 | 40.934–53.648 | <.0001 | 33.751 | 28.443–40.049 | <.0001 |
| Other selected | 8.266 | 6.979–9.789 | <.0001 | 19.556 | 15.878–24.086 | <.0001 |
| Simple interactions | ||||||
| Age (y) with, y Past 1970 | 1.002 | 1.002–1.002 | <.0001 | 1.002 | 1.001–1.002 | <.0001 |
| Age (y) with GA, wk | 1.009 | 1.009–1.01 | <.0001 | 1.009 | 1.008–1.010 | <.0001 |
| GA (wk) with, birth weightSDS | 0.998 | 0.995–1.000 | .1085 | 0.992 | 0.989–0.995 | <.0001 |
| Age (y) with, birth lengthSDS | 1.002 | 1.001–1.003 | .0004 | 1.003 | 1.002–1.005 | <.0001 |
| Age (y) with, birth weightSDS | 1.007 | 1.006–1.008 | <.0001 | 1.009 | 1.007–1.011 | <.0001 |
| Piecewise linear interaction between age (y) and cardiovascular malformations | ||||||
| Age, 0–14 wk | 7.7 × 10⁻²¹ | 9.9 × 10⁻²³–6.0 × 10⁻¹⁹ | <.0001 | 1.2 × 10⁻¹⁶ | 6.5 × 10⁻¹⁹–2.3 × 10⁻¹⁴ | <.0001 |
| Age, 14 wk–4 y | 0.852 | 0.804–0.904 | <.0001 | 0.871 | 0.819–0.926 | <.0001 |
| Age, 4+, y | 0.965 | 0.951–0.980 | <.0001 | 0.979 | 0.963–0.996 | .0136 |
| Piecewise linear interaction between age (y) and other selected malformations | ||||||
| Age, 0–14 wk | 1.8 × 10⁻¹⁵ | 6.5 × 10⁻¹⁸–4.8 × 10⁻¹³ | <.0001 | 1.6 × 10⁻¹⁴ | 1.8 × 10⁻¹⁷–1.4 × 10⁻¹¹ | <.0001 |
| Age, 14 wk–4 y | 0.994 | 0.940–1.050 | .8191 | 0.960 | 0.893–1.033 | .2778 |
| Age, 4+, y | 0.971 | 0.960–0.981 | <.0001 | 0.962 | 0.945–0.979 | <.0001 |
WeightSDS and lengthSDS at birth according to Niklasson and Albertsson-Wikland (32).
The HRs shown are per indicated unit for continuous variables, i.e. years, weeks, or SDS for age, calendar year, GA, and birth size.
For the full predictor expressions as well as β coefficients and SE see Supplemental Table 4.
The parameters of the advanced model were estimated using Poisson regression, where each observation period was divided into short consecutive intervals and evaluated using midpoint approximation. For computational reasons, the length of each interval in the regression varied between 1 day (after birth and toward the censoring date) up to 1 year during uneventful periods.
When computing mortality, the model produced by the Poisson regression was used in a similar manner and the hazards for each individual in the population of interest were computed at 1-day intervals and integrated using trapezoidal approximation.
For the conventional model, the same methodology of Poisson regression was used but restricted to only the variables' age and calendar year as well as their interactions, with different parameter estimates per sex. This model mirrors older, simpler computations based on lookup tables, but will also allow for estimation of additional statistics, such as gradient of risk (see below).
Confidence intervals CIs for estimated number of deaths for the two models (conventional, 14.68; and advanced, 21.99) were computed by repeated sampling of the model parameters from a multinomial normal distribution using the covariance matrix estimated by the Poisson regression. These estimates were then used to compute the estimated number of deaths and CIs were computed from the standard error of the results.
Gradient of risk
To quantify any improvement in the advanced model compared with the conventional model, the gradient of risk per 1 SD (36) of the risk score (log hazard) was determined. The gradient of risk represents the HR between two individuals who differ by 1 SD with respect to the combined included variables. The CI of this measure was estimated using repeated sampling (For more details see Supplemental Data). All computations were performed using SAS 9.4 (SAS Institute, Inc.).
Results
Development of an advanced mortality model
Individuals born in Sweden between 1973 and 2010 were included in the estimation of a continuous hazard function for death; applicable for ages, 0–38 years (from Swedish Medical Birth Register start, 1973 until censoring date, 2010). The final parameters for the advanced model are shown in a simplified form in Table 2, and complete specification in Supplemental Table 4.
Many variables were considered as candidates for the final function. The variables included in the final model were selected to reflect important differences between the group of rhGH-treated patients (IGHD, ISS, SGA) and the general population. In fact, GA, birth lengthSDS, birth weightSDS, and the malformations categories significantly differed between the rhGH population and the general population (P < .001) (Table 1).
The separate final continuous hazard functions for males and females both included GA, birth lengthSDS, birth weightSDS, the two groups of congenital malformations (cardiovascular and other malformations), chronological age, and calendar year, as well as 10 interactions between age intervals and other variables, and an interaction between GA and birth weightSDS. All variables, except for the intervals of chronological age and calendar year, were obtained at or close to birth (Table 2).
Effects of age were allowed to differ for the different chronological age intervals: 0.0–0.5; >0.5–2; >2–12; >12–20; >20–35; and greater than 35 years of age. Interactions between age intervals and malformations were allowed to vary: 0–14 weeks; >14 weeks to 4 years; and greater than 4 years, to ensure that the extreme effect of malformations immediately after birth was correctly modeled.
Application of the advanced mortality model
Performance of the constructed advanced mortality model applied to the general population
The advanced mortality model was applied on the data of the general population (n = 1 880 668 males, n = 1 781 131 females), and continuous hazard functions were estimated for males and females separately using Poisson regression (Table 2), and resulted in a ratio of observed/expected number of deaths of 0.997 (95% CI, 0.986–1.009), P = .66. The estimated and observed numbers of deaths in relation to age are presented in Figure 1.
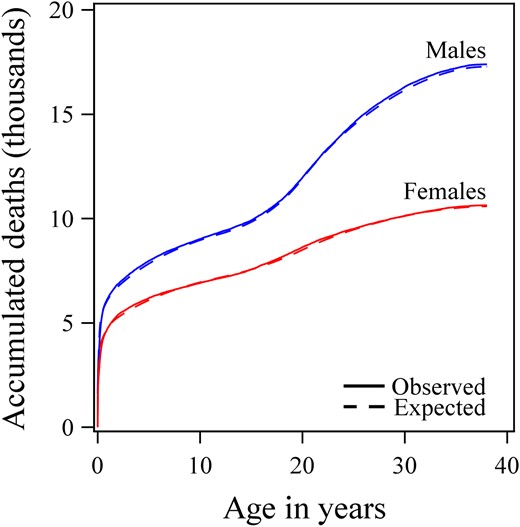
The performance of the advanced model.
Accumulated observed number of deaths (unbroken line) of males (blue) and females (red) born in Sweden between 1973 and 2010 (n = 3 714 585) according to age and compared with values expected by the mortality model (broken line).
Advanced mortality model applied to the rhGH-treated population
When applying the mortality model to the cohort of the patients with IGHD, ISS, and born SGA treated with rhGH in childhood, the observed number of deaths (n = 21) was similar to the expected number of deaths predicted by the model (n = 21.99), Figure 2. SMR calculated as the ratio of observed/expected number of deaths was 0.955 (95% CI, 0.591–1.460), P = .95.
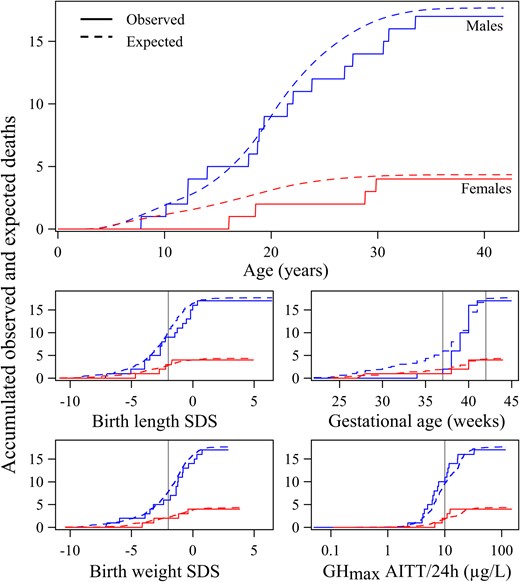
The figure shows how well the advanced model fit the observed data of the rhGH-treated population: Accumulated number of deaths are shown in the top panel according to time (unbroken line) in male (blue) and female (red) patients treated with rhGH during childhood due to short stature related to IGHD, ISS, or being born SGA compared with values expected by the mortality model (broken line); and in the smaller figures according to GA (mid right panel), birth lengthSDS (32), (mid left panel) birth weightSDS (32), (lower left panel) and according to GHmax (μg/L log scale) (lower right panel).
For birth lengthSDS and birth weightSDS, the vertical line represents −2 SDs as the classification boundary for SGA. For GA, the two vertical lines mark the boundaries of what is considered normal. GHmax was the maximal value from either the provocation test, mainly arginine-insulin tolerance test, or from a spontaneous 12–24-h GH profile. Vertical reference line = 10 μg/L, International Reference Preparation 66/217 polyclonal antibodies. See Methods for information.
When the rhGH-treated population was divided into subgroups: 1) born SGA or non-SGA, 2) GH deficient or non-GH deficient, and 3) IGHD, ISS, or SGA, hazard ratios were obtained that did not differ significantly in any subgroup from those found for general population (Supplemental Figure 1).
Birth characteristics.
Figure 2 illustrates the effect of birth characteristics on mortality/SMR, the accumulated number of deaths in males and females, depicted vs GA, birth lengthSDS, and birth weightSDS (see Supplemental Data for more information).
Sensitivity analysis by replacing variables.
To elucidate further the effect of birth variables, the relative risk for the rhGH population was computed but with one of the variables removed from the model. This was performed by replacing the variable with the average for the general population. With birth lengthSDS set to zero, the risk ratio became 1.227; with the birth weightSDS set to zero, the ratio became 1.137; and with the GA set to 40 weeks, the ratio became 1.199. These results represent the expected mortality if the rhGH-treated population had been born with an average length, weight, or GA, and show that this population was born with different characteristics to the general population (Table 2, Figure 3).
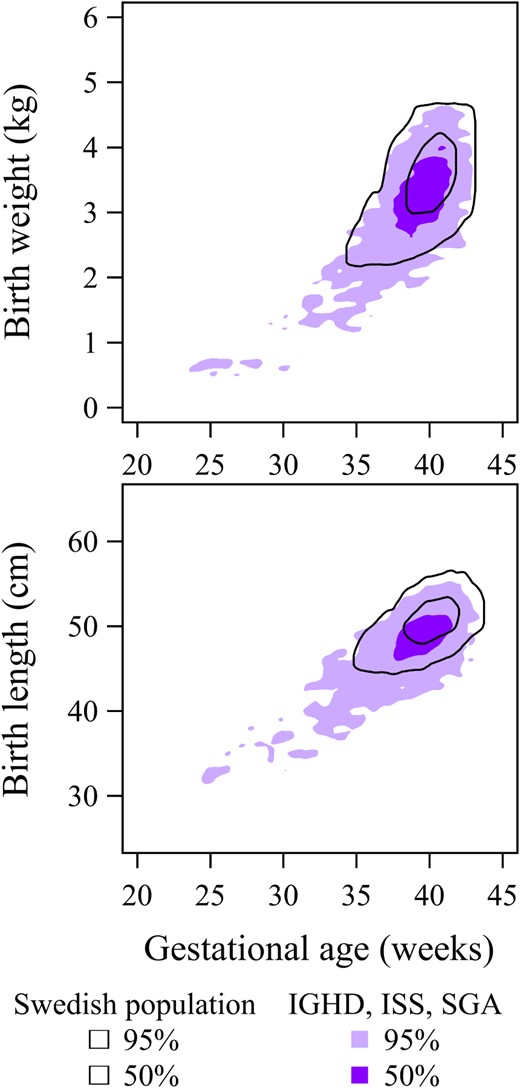
Top panel, Birth weight (kg) vs GA (wk).
Dark purple surface = 50%, and light purple = 95% of individuals who were rhGH-treated during childhood due to short stature related to IGHD, ISS or SGA compared with corresponding contours (black unbroken lines) for the general population born between 1973 and 2010 in Sweden. Bottom panel, Corresponding values for birth length (cm). The rhGH-treated population differ significantly from the general population in terms of birth weight and birth length (both P < .001).
Sensitivity analysis by removing variables.
A different comparison was made by computing variations of the advanced model with one variable removed. This produces a conservative estimate of the effect of a variable when adjusting for other variables. When either length or weight at birth was not taken into account, the expected number of deaths decreased by 6 and 5%, respectively, even when adjusting for all the other variables. The largest change was obtained when removing GA, which caused the expected number of deaths to decrease by 10%, again even when adjusting for all the other variables. The smallest effect was found when excluding birth malformations, which caused an increase of 2%; this was expected to be low given that the rhGH-treated population in the present study did not include patients with known birth malformations.
GHmax level.
Figure 2 shows the relationship between the GHmax (from either spontaneous secretion or provocation tests) and the accumulated number of deaths in males and females. The rhGH-treated patients with IGHD, of whom 40% were born SGA, were expected by the model to contribute to half of the deaths, and in fact, they comprised 49% of those who died.
Conventional SMR
When applying the conventional model to compute SMR, which only adjusted for age, sex and calendar year, the expected number of deaths was 14.68 compared with the observed number of deaths of 21, corresponding to an SMR of 1.43 (95% CI, 0.89–2.19), P = .14. However, this corresponds to an 88% probability that conventional SMR method will estimate a higher HR than the advanced model.
Comparison between the conventional and the advanced model
The uncertainty of the expected number of deaths was estimated using both conventional and advanced model. The advanced model expected 21.99 (95% CI, 21.24–22.81), whereas the conventional model expected only 14.68 (95% CI, 14.35–14.96) deaths. These differed significantly (P < .001).
The conventional SMR model was further compared with the advanced novel model using gradient of risk. The gradient of risk varied greatly with age (Figure 4), but was significantly higher (ie, better for the advanced model than the conventional model at all ages) (P < .001); on average, the gradient of risk of the advanced model was 24% higher (range, 18–42%).
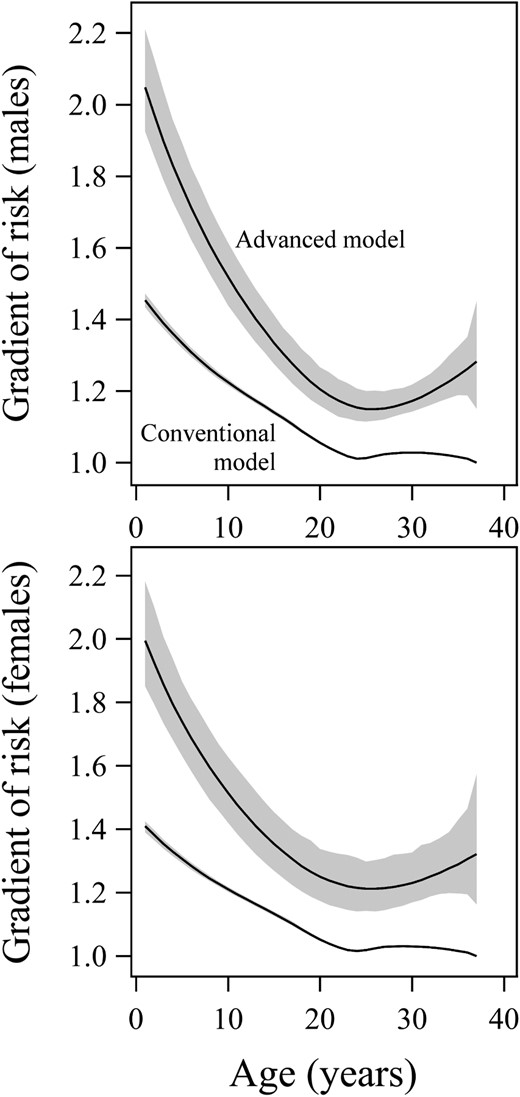
Gradient of risk per 1 SD for the conventional model (lower curves) and the advanced model (upper curves) together with 95% CI for males (top panel) and females (bottom panel).
This is equal to the natural number e to the power of 1 SD of each model's log-hazard function. A higher gradient of risk is associated with improved predictive power to explain the variation. The gradient of risk represents the HR between two individuals who differ by 1 SD with respect to the combined included variables. The larger gradient of risk of the advanced model (compared with the lower of the conventional model) signifies that it can better express the variation within the population. As seen, the gradient varies with age. For the advanced model, it was on average 24% higher, with a range of 18–42%, significant at all ages (P < .001).
Cause of deaths in the rhGH population 1985–2010
During the period of 1985–2010, 21 rhGH-treated patients (17 males, four females) with IGHD, ISS, or SGA died. Two thirds of these deaths were due to accidents and suicide (14 of 21 who died, 11/17 males and 3/4 females). Of the remaining seven patients who died, three males died of infections, two males of primary cardiomyopathy, one male of a coagulation defect and one female of “other endocrine dysfunction” (Supplemental Table 2). Thus, no patient died as a result of a malignancy or cardiovascular disease. Fifteen of these deaths were previously reported, being included in the Swedish SAGhE population comprising those who started rhGH treatment between 1985 and 1997 (16).
Discussion
Principal findings
The present study did not find that rhGH treatment during childhood for IGHD, ISS, or being born SGA increased mortality relative to that seen in the general Swedish population using a developed, advanced mortality model that also considered birth characteristics. With conventional SMR, which only adjusts for age, sex, and calendar year, we obtained a ratio between observed and expected deaths of 1.43, which is close to the SMR of 1.3 obtained in the previous French SAGhE cohort of twice the size of the present cohort (13). However, the apparently increased SMR ratio of 1.43 was not significantly different than that expected in the general population. This is most likely due to the small size of the Swedish rhGH-treated population. In comparison, SMR estimated on the rhGH-treated population was 0.955 using the advanced mortality model with a continuous hazard function also adjusting for gestational age (GA), length, weight at birth, and birth malformations. The expected number of deaths differed significantly when estimated by the conventional model, 14.68; or with the new advanced model, 21.99. This suggests that the increased mortality previously suggested to be linked to rhGH treatment can be fully accounted for by differences in birth characteristics. It also highlights that the previous assumption that individuals with IGHD, ISS, or SGA should have an SMR comparable to that of the general population if not rhGH treated, is incorrect. Sweden is able to provide unique birth data enabling us to develop an appropriate mortality model, but due to few inhabitants there is a rather small rhGH-treated population. Thus, it will be essential to use this novel advanced model for collaborative studies assessing larger rhGH-treated patient populations with the required birth variables.
Advanced mortality model is superior in estimating mortality
A complete continuous hazard model was constructed and used in the present study, as opposed to the commonly used Cox proportional hazards model. The latter has been used to estimate the relative risk of specified variables within a model population, with the advantage that it may be used without specifying the full hazard function (23), as used in the French study (13), and the recently reported Danish study on GH-treated patients during childhood independent on indication (37). However, Cox models cannot estimate the rate of death in a population, nor easily include interactions with chronological age or calendar year. Thus, the Cox model cannot evaluate changes in mortality over time, or be used to study a population other than the one the model was built on. Complete continuous hazard functions, in contrast, can incorporate virtually any covariate or interaction and can be applied to an arbitrary population to compute the expected mortality in that population. The advanced model, estimated from the complete general Swedish population born between 1973 and 2010 could thus be applied to any Swedish subpopulation or population from another country similar to the Swedish population. From our results we conclude that estimation of expected number of deaths will be misleading among rhGH-treated patients if birth variables are not included. In the present study, fewer deaths were estimated, 14.68 vs 21.99, when birth characteristics were not included than when those variables were included. In contrast, multivariate analyses used in the French SAGhE study did not identify birth size as important for SMR (13). Instead, the weight-based rhGH dosing greater than 50 ug/kg/d caused the overall increased SMR; however, given to only 281 patients of whom at least 226 were born SGA. This is in contrast with the Swedish study including randomly assigned rhGH doses of 67 ug/kg/d in clinical trials and in the individualized rhGH-dosing trial (35), the rhGH doses were given as individualized doses, 17–100 μg/kg/d, based on estimated GH responsiveness for growth (35, 38, 39).
Strengths and weaknesses
The development and application of the advanced mortality model presented here was possible due to the existence of large and complete registers containing individual birth and death data for the entire general Swedish population, as well as for the entire rhGH-treated population. Access to such comprehensive data sources made it possible for mortality estimates to be adjusted for variables not previously considered. The present study was undertaken with a fairly short follow-up period due to the limited time during which rhGH treatment has been available. Furthermore, the patient cohort comprised 3847 individuals with the diagnoses of IGHD, ISS, and SGA, who had been treated in Sweden. Although this is a large patient group for a rare condition, the number of deaths, 21, is too low to give statistical power to demonstrate that rhGH treatment in childhood is not associated with increased or decreased mortality. Thus, it will be essential to replicate this study in other countries and in Sweden, when data are available for a greater number of patients followed over a longer period of time or with a higher mortality rate. We estimate that with the low Swedish mortality rate, approximately 10 000 patients would be required to give a power of 80% to identify a potential mortality increase associated with rhGH treatment. However, the French study of only 6892 patients, of whom as many as 93 died, showed significant results with conventional SMR models (13).
Conclusion
The ratio of observed/expected (21/21.99) deaths was equal to that in the general Swedish population when applying advanced sex-specific mortality models adjusting for birth characteristics such as GA, length, weight, and malformations, alongside different intervals of chronological age and calendar year. This suggests that the 50% increased overall mortality, SMR of 1.43, when adjusting for only age, sex, and calendar year as used for conventional SMR compared with SMR of 0.96 when estimated using the advanced model, was related to differences in the birth characteristics between the rhGH-treated patients and the general Swedish population. Thus, the significantly different expectations of deaths (14.68 and 21.99) were related to basic characteristics of the rhGH-treated population rather than rhGH treatment itself. These results should be confirmed using the developed advanced model in collaborative studies including larger groups of rhGH-treated patients with the required birth information.
Abbreviations
- CI
confidence interval
- GA
gestational age
- GHmax
maximum GH level during a spontaneous 12-24-h profile or provocation test
- hGH
human growth hormone
- HR
hazard ratio
- IGHD
idiopathic isolated GH deficiency
- ISS
idiopathic short stature
- rhGH
recombinant human GH
- SAGhE
Safety and Appropriateness of GH treatments in Europe
- SGA
small for gestational age
- SMR
standardized mortality ratio.
Acknowledgments
We thank the Steering committee members of the National GH Registry 1985–2015: Kerstin Albertsson-Wikland, Stefan Aronson, Peter Bang, Jovanna Dahlgren, Maria Elving, Jan Gustafson, Lars Hagenäs, Sten-Anders Ivarsson, Berit Kriström, Claude Marcus, Christian Moell, Karl Olof Nilsson, Svante Norgren; Martin Ritzén, Torsten Tuvemo, Ulf Westgren, Otto Westphal, and Jan Åman. We also acknowledge Birgit Borgström, coprincipal investigator for Swedish SAGhE; and the nonauthor principal investigators of rhGH trials 1985–2010; Claude Marcus and Klas Ekström for the MiniMax study (TRN 151:142/01), and Olle Söder for the NESGAS. The authors are grateful to Harriet Crofts for valuable language editing. The authors would also like to acknowledge all the rhGH-treated individuals and their families; the team of pediatricians and nurses at the 54 Children Hospitals or Clinics in Sweden; the National GH Registry team: Ingela Larsson, Ingela Peacock, Lillemor Ljungberg, Lena Lehto; the Gothenburg Pediatric Growth Research Center Laboratory: Lisbeth Larsson, Paula Hellman; and last but not least the statisticians and data managers of the Statistiska Konsultgruppen: Aldina Pivodic, Mattias Molin, Per Ekman, and Niklas Svensson. The development of the mortality model has been possible due to exiting registries in Sweden. The authors therefore acknowledge Petter Karlberg for initiating the Swedish Medical Birth Registry and Bengt Källén for initiating the Registry for Congenital Malformations.
Contributors: All authors have had full access to the data of the study and can take responsibility for the integrity of the data and the accuracy of the data analysis. All authors have taken part in the design and planning of the study, and writing of the manuscript. Specific contributions from members were as follows: A.M. and N.-G.P., and A.O. were responsible for the advanced mortality model development; K.A.W. and A.N. for the malformation identifications; L.S. was the Swedish principal investigator for Swedish SAGhE; K.A.W. was the initiator and principal investigator for the National GH Register 1985–2010, and the rhGH trials (TRN 89-071, TRN 88-080, TRN 88-177, TRN 89-070-01, TRN 89-071-01, TRN 98-0198-003) in IGHD, ISS and SGA during the study period 1985–2010, coordinator for (TRA 6280-003), and coprincipal investigator for Swedish SAGhE. J.D. was principal investigator for the Maintenance trial of the rhGH-dose study (TRA 6280-003). B.K. was coordinator of the rhGH-dose study (TRN 98-0198-003, TRA 6280-003). S.N. and J.D. were coordinators for the SGA trial (TRN 2009/529-31). K.A.W., P.B., J.D., J.G., B.K., and S.N. took part in the steering committee for the National GH Register, during different time periods between 1985 and 2015.
This work was supported by unrestricted grants to K.A.W. as principal investigator from Swedish Research Council (No. 7509) and Governmental University Hospital Research grants, West Region Research Grants, and the Foundation Växthuset for Children.
Disclosure Summary: K.A.W. received an unrestricted research grant from Pfizer until 2005; and investigator-initiated independent research grants for the National GH Register from Novo Nordisk, Ipsen, Merck Serono, and Sandoz until 2012; and grants for the National GH Registry, as a Swedish Health Care Quality & Efficiency Register from Swedish Association of Local Authorities and Regions until 2012. A.M. is employed by the Statistiska Konsultgruppen. L.S. received lecture fees and investigator-initiated independent research grants from Ferring, Pfizer, Ipsen, Merck Serono, Novo Nordisk, Pfizer, and Sandoz, and is a member of the NordiNet International Study Committee (Novo Nordisk). P.B. received lecture fees, consultant honoraria; grants from Ipsen, Novo Nordisk, Merck Serono, Lilly, and Pfizer; and he chairs the Ipsen IGF deficiency data review committee. J.D. received lecture fees from Ipsen, Novo Nordisk, Merck Serono, Serono Foundation, Pfizer, Novartis, and Sandoz; consultation honoraria from Pfizer; and investigator-initiated independent research grants for trials as well as for the National GH Register from Pfizer and Novo Nordisk since 2013. J.G. received lecture fees and investigator-initiated independent research grants from Novo Nordisk and Pfizer. B.K. received lecture and consultation honoraria from Novo Nordisk, Pfizer, and Sandoz. S.N. received lecture fees, consultation honoraria, and grants from Merck Serono. N.-G.P. and A.O. are employed by the Statistiska Konsultgruppen. A.N. has nothing to declare.
