


Abstract
Pubertal children born small for gestational age with a poor adult height (AH) expectation can benefit from treatment with GH 1 mg/m2/d (∼0.033 mg/kg/d) in combination with 2 years of GnRH analog (GnRHa) and even more so with GH 2 mg/m2/d. Because both GH and GnRHa can negatively influence insulin sensitivity, combining these treatments has raised concerns. The long-term GH dose effects on insulin sensitivity in children treated with combined GH/GnRHa are unknown.
The purpose of this study was to investigate insulin sensitivity and β-cell function by a very precise method during long-term GH treatment, either with or without 2 years of additional GnRHa and to study differences in insulin sensitivity during treatment until AH between GH at 1 or 2 mg/m2/d.
This was a randomized, dose-response GH trial involving 110 short small for gestational age children (59 girls) treated with GH until AH (GH randomized to 1 or 2 mg/m2/d). Sixty-seven children received additional GnRHa treatment. Frequently sampled intravenous glucose tolerance tests were performed and insulin sensitivity (Si), acute insulin response (AIR), and disposition index (DI) were calculated using Bergman's MINMOD. The GH dose effect was evaluated in a subgroup of 48 children who started GH treatment in early puberty (randomized to 1 or 2 mg/m2/d) combined with 2 years of GnRHa.
At AH, after 5.9 years of GH treatment, Si, AIR, and DI were similar between children treated with combined GH/GnRHa and those treated with GH only. In the subgroup of children who started GH treatment in early puberty (randomized to 1 or 2 mg/m2/d) together with 2 years of GnRHa treatment, there were no significant differences in Si, AIR, or DI between the GH dose groups during the treatment.
Combined GH/GnRHa treatment has no long-term negative effects on insulin sensitivity and β-cell function compared with GH only. Started in early puberty, a GH dose of 2 mg/m2/d results in a similar insulin sensitivity at AH as a GH dose of 1 mg/m2/d.
Being born small for gestational age (SGA) has been associated with a higher prevalence of diabetes mellitus type 2 at a relative young adult age (1). We have shown that additional treatment with a GnRH analog (GnRHa) for 2 years at start of puberty can improve adult height (AH) in children who start GH treatment in early puberty with an expected AH of <−2.5 standard deviation score (SDS) (2). Additional GnRHa treatment for 2 years has no long-term negative effects on body composition, blood pressure, and lipids (3). The long-term effects of combined GH/GnRHa treatment on insulin sensitivity and β-cell function in SGA-born children are unknown (4). Some studies in children with central precocious puberty (CPP) showed a deterioration of insulin sensitivity during GnRHa treatment (5, 6). Because GH treatment is also known to reduce insulin sensitivity (7–9), the combination of GH with GnRHa treatment has raised concern. The changes in insulin sensitivity during GH treatment seem to be independent of the GH dose, at least within the dose range studied (8, 10, 11).
We present metabolic data for a longitudinal, randomized, dose-response GH trial involving short SGA children (≥8 years at start) who were treated with GH until AH, either with or without additional GnRHa for 2 years from start of puberty. First, insulin sensitivity and β-cell function at AH were compared between children treated with combined GH/GnRHa and those treated with GH only. We expected that the effects of 2 years of additional GnRHa treatment would be temporary and would normalize after discontinuation of GnRHa treatment, resulting in similar insulin sensitivity and β-cell function at AH between these 2 treatment groups. Second, we investigated the GH dose effect (1 vs 2 mg/m2/d) on insulin sensitivity and β-cell function in a subgroup of children who started GH treatment (randomized to 1 or 2 mg/m2/d) and 2 years of GnRHa treatment in early puberty. We hypothesized that treatment with GH 2 mg/m2/d (∼0.067 mg/kg/d) from the onset of puberty until AH would result in similar insulin sensitivity and β-cell function during treatment until AH compared with GH 1 mg/m2/d (∼0.033 mg/kg/d).
Subjects and Methods
The Dutch SGA study included children when they met the following criteria: (1) birth length and/or birth weight SDS for gestational age less than −2.0 (12); (2) chronological age of ≥8 years; (3) prepubertal stage (Tanner stage 1) or early pubertal stage (breast stage 2–3 in girls and testicular volume of <10 mL in boys) with a GnRHa-stimulating test indicating central puberty (13, 14); (4) height at inclusion of less than −2.5 SDS in prepubertal children or when included in early puberty a height at the start of puberty of <140 cm, which would result in an expected AH less than −2.5 SDS, based on Dutch references (15); (5) well-documented growth data from birth to the start of treatment; and (6) normal karyotype in all girls (2). Children were excluded in cases of a complicated neonatal period with severe asphyxia (defined as Apgar score of ≤3 after 5 minutes), long-term complications of respiratory ventilation (bronchopulmonary dysplasia), endocrine or metabolic disorders, growth failure caused by other disorders (celiac disease, emotional deprivation, severe chronic illness, or chondrodysplasia), chromosomal disorders, short stature homeobox haploinsufficiency or syndromes (except for Silver-Russell syndrome), and use of medication interfering with growth or GH treatment. None of the children were GH deficient according to stimulation tests (GH peak of >7.7 ng/mL) (16) or overnight GH profiles (17, 18).
The SGA study included 135 short SGA children (70 girls) (Figure 1). Nine children dropped out for the following reasons: lack of motivation despite ongoing catch-up growth (n = 3), noncompliance (n = 3), social problems (n = 1), emigration (n = 1), and psychiatric disorder (n = 1). In 4 children, the GH dose was increased because of limited catch-up growth and in 1 child was decreased because of high serum IGF-I levels. Among the 121 children who continued treatment according to protocol, 110 children reached AH (defined as height reached when growth velocity had decreased to <0.5 cm during the last 6 months and bone age was ≥15 years for girls and ≥17 years for boys) or near AH (defined as height velocity between 0.5 and 2 cm during the last 6 months and adult pubertal stage). In the 110 children who were eligible for analyses at AH, a frequently sampled intravenous glucose tolerance (FSIGT) test at AH was performed in 76 children. Reasons for no FSIGT test at AH were patient fear of the intravenous catheters or stopping of GH treatment >24 hours before the FSIGT test.
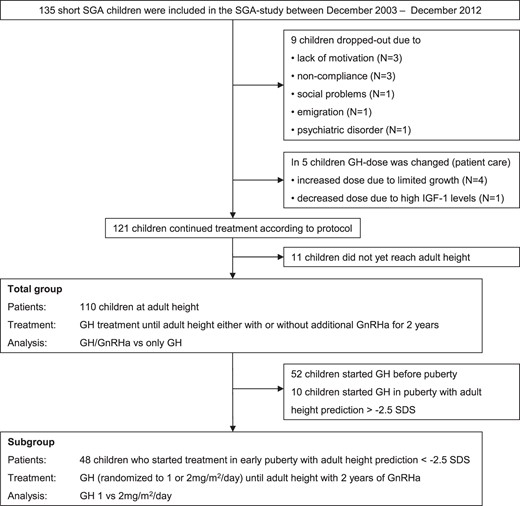
Flowchart of inclusion, drop out, and analyses.
This study was performed according to the Declaration of Helsinki and approved by the medical ethics committees of the participating centers. Written informed consent was obtained from the parents or guardians of each child and from children who were 12 years or older. Owing to ethical considerations, the medical ethics committees did not allow a randomized untreated short SGA group.
Design
The Dutch SGA study is a longitudinal, randomized, dose-response GH trial involving short SGA children of at least 8 years of age. All children received somatropin sc daily (Genotropin; Pfizer Inc). Every 3 months, the GH dose was adjusted to calculated body surface area. Prepubertal children received GH 1 mg/m2/d (Figure 2). When these children entered puberty or when children were in early puberty at start of treatment, they were randomly assigned to treatment with either GH 1 or 2 mg/m2/d after stratification for sex, pubertal stage, and parental height (1 or 2 parents with a height less than −2 SDS vs both parents with a height of at least −2 SDS). Because no model is known to predict AH accurately at the start of puberty, we used a pragmatic, arbitrary cutoff level. A height of <140 cm at the start of puberty was used to identify children with an AH expectation of less than −2.5 SDS, based on Dutch reference values (15, 19); these children received GnRHa (leuprolide acetate depots, 3.75 mg sc every 4 weeks) for 2 years in addition to GH treatment. During GnRHa treatment, puberty was sufficiently suppressed in all children, both clinically and by GnRHa-stimulating tests or overnight gonadotropin profiles (18, 20).
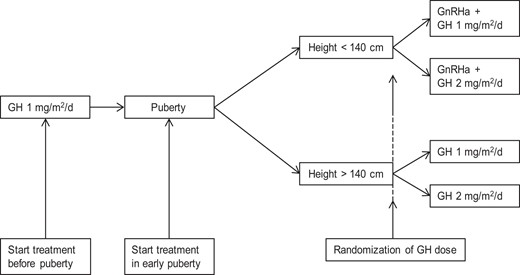
Flow chart of treatment regimen.
Measurements
Height, weight, and Tanner stage were determined at start and every 3 months. Height was measured to the nearest 0.1 cm using a Harpenden stadiometer (Holtain, Ltd). Weight was measured to the nearest 0.1 kg on a digital scale (Servo Balance KA-20-150S; Servo Berkel Prior). Height and weight were transformed into SDS for sex and chronological age according to Dutch references (15), using Growth Analyzer Research Calculation Tools (https://growthanalyser.org).
Assays
At the start of treatment and yearly until AH, blood samples were taken after an overnight fast. After centrifugation, all samples were kept frozen until assayed (−80°C). Serum fasting glucose levels were determined on an Architect ci8200 system (Abbott), and serum fasting insulin levels were measured by IRMA (Medgenix, Biosource Europe). The intra-assay coefficient of variation was 2.1% to 1.5% (6.6–53.3 milligram equivalents [mE]/L) and the interassay coefficient of variation was 6.5% to 6.1% (14.4–100.4 mE/L). Homeostasis model assessment of insulin resistance (HOMA-IR) was performed using the model HOMA-IR = (fasting glucose [millimoles per liter] × fasting insulin [milliunits per liter])/22.5 (21).
Insulin sensitivity and β-cell function
To assess glucose homeostasis, a modified FSIGT test with tolbutamide was performed at AH after an overnight fast (22). Insulin sensitivity (Si), acute insulin response (AIR), and disposition index (DI) were calculated using Bergman's MINMOD Millennium software (23). Si quantifies the capacity of insulin to stimulate glucose disposal, and AIR is an estimate of insulin secretory capacity, measured as the area under the curve from 0 to 10 minutes, corrected for baseline insulin levels. The DI equals AIR · Si and indicates the β-cell function.
In the subgroup of children who started GH treatment (randomized to 1 or 2 mg/m2/d) in early puberty with additional 2 years of GnRHa treatment, an FSIGT test was performed at baseline, after 1 year of combined GH/GnRHa treatment, and at AH attainment. After approval of a protocol amendment, the last 15 children included in the SGA study underwent an additional FSIGT test 3 months after GnRHa treatment only, to determine the independent effects of GnRHa treatment on insulin sensitivity.
Body composition
In all children, body composition at the start and at AH was measured by dual-energy x-ray absorptiometry (DXA) scan (Lunar Prodigy; GE Healthcare, Chalfont St. Giles, UK). All scans of the study group and reference population were performed on the same machine, and tests for quality assurance were performed daily. For measuring total body fat and lean body mass, this type of DXA machine has an intra-assay coefficient of 0.41% to 0.88% for fat tissue and 1.57% to 4.49% for lean body mass (24). Total fat mass was measured and fat mass SDS was calculated according to age- and sex-matched Dutch reference values (25).
In the subgroup of children who started GH treatment (randomized to 1 or 2 mg/m2/d) in early puberty combined with 2 years of GnRHa treatment, DXA scans were performed according to the following schedule: at start and after 1, 2, 2.5, and 4 years of treatment. The scans at AH were performed at the last visit or at a visit in the last year before discontinuation of GH treatment.
Statistics
Statistical analyses were performed using SPSS version 21. Distribution of variables was determined by the Kolmogorov-Smirnov test and normal Q-Q plots. Clinical characteristics are presented as mean (SDS). A one-sample t test was used to compare SDS results with 0 (mean value for age- and sex-matched references). Because of a skewed distribution, fasting insulin and HOMA-IR were square root–transformed, whereas Si, AIR, and DI were log-transformed for analyses. Sample size calculation was based on FSIGT test results in a previous Dutch study in short SGA children (26). The estimated sample size was based on an expected difference in mean Si between 2 groups of 10 × 10−4/min−1 (μU/mL), SD of 10, testing at a significance level of 5%. Seventeen children in each group were sufficient to detect this difference with 80% power.
Total group analyses
Differences at AH between children treated with combined GH/GnRHa and those treated with GH only were evaluated using an independent-sample t test.
Subgroup analyses
To evaluate GH dose-dependent effects and changes in insulin sensitivity and β-cell function from start to AH, additional analyses were performed in a subgroup of children who started GH treatment (randomized to 1 or 2 mg/m2/d) in early puberty combined with 2 years of GnRHa and subsequently continued GH treatment until AH. We used repeated-measurements analysis (linear mixed model) with an unstructured covariance matrix with GH dose as the categorical independent variable and fat mass percentage (FM%) SDS as a covariate. Differences between the 1-mg and 2-mg groups at various time points were evaluated using an independent-sample t test. A paired-sample t test was used to compare insulin sensitivity and β-cell function at start of treatment and after 3 months of GnRHa treatment only. We assessed linear correlations using the Pearson correlation coefficient. P values of <.05 were considered statistically significant.
Results
Clinical characteristics
Table 1 shows the baseline clinical characteristics of the total group of 110 short SGA children (59 girls) who were treated until AH. At start of treatment, mean (SD) age was 11.4 (1.5) years and height SDS was −2.9 (0.6). Sixty-seven children were treated with combined GH/GnRHa and 43 with GH only. The combined GH/GnRHa group consisted of more girls (P = .018) and more children that started treatment in early puberty with a more progressed Tanner stage (P < .001).
Baseline Clinical Characteristics
| Total Group | GH/GnRHa | GH | P Value | |
|---|---|---|---|---|
| No. | 110 | 67 | 43 | |
| Boys/girls | 51/59 | 25/42 | 26/17 | .018 |
| Gestational age, wk | 37.4 (3.3) | 37.4 (3.6) | 37.5 (3.0) | .886 |
| Birth weight SDS | −2.0 (1.0)a | −2.0 (0.9)a | −2.0 (1.0)a | .888 |
| Birth length SDS | −2.7 (1.3)a | −2.8 (1.3)a | −2.6 (1.2)a | .513 |
| Target height SDS | −0.7 (0.7)a | −0.7 (0.7)a | −0.7 (0.7)a | .849 |
| Age, y | 11.4 (1.5) | 11.6 (1.2) | 11.0 (1.8) | .065 |
| Height SDS | −2.9 (0.6)a | −2.9 (0.7)a | −2.9 (0.6)a | .591 |
| Body mass index SDS | −1.0 (1.0) | −0.9 (1.0) | −1.2 (1.0) | .202 |
| IGF-I SDS | −1.17 (1.2) | −1.08 (1.1) | −1.30 (1.5) | .374 |
| Prepubertal/pubertal | 52/58 | 19/48 | 33/10 | <.001 |
| Pubertal stage (14) | ||||
| Tanner 1 | 52 | 19 | 33 | |
| Tanner 2 | 41 | 36 | 5 | |
| Tanner 3 | 17 | 12 | 5 | |
| Fasting glucose, mmol/L | 5.0 (0.5) | 5.0 (0.5) | 4.9 (0.5) | .605 |
| Fasting insulin, mU/L | 5.3 (4.8) | 6.3 (5.5) | 3.8 (3.0) | .406 |
| HOMA-IR | 1.2 (1.2) | 1.5 (1.4) | 0.9 (0.8) | .471 |
Data are expressed as mean (SDS), unless written otherwise. Fasting insulin and HOMA-IR were square root–transformed before analyses and adjusted for Tanner stage at baseline. Bold text indicates a significant P-value (<.05)
Variables in SDS compared with 0 SDS, P < .01.
Insulin sensitivity and β-cell function measured by FSIGT tests
Total group at AH
Table 2 shows the insulin sensitivity and β-cell function at AH measured by FSIGT tests with tolbutamide. The average GH treatment duration was 5.9 years of GH treatment. At AH, FM% SDS was similar between children treated with GH/GnRHa and those treated with GH only (P = .832) (Table 2).
Insulin Sensitivity and β-Cell Function by FSIGT
| Total Group | GH/GnRHa | GH | P Value | |
|---|---|---|---|---|
| No. | 110 | 67 | 43 | |
| GH dose, 1 vs 2 mg/m2/d | 55/55 | 33/34 | 22/21 | .845 |
| At onset of puberty | ||||
| Height SDS | −2.6 (0.7) | −2.7 (0.6) | −2.3 (0.7) | .002 |
| At AH | ||||
| Age | 17.4 (1.2) | 17.4 (1.1) | 17.4 (1.3) | .853 |
| AH SDSa | −1.8 (0.8) | −1.8 (0.9) | −1.7 (0.8) | .526 |
| FM% SDS | 0.4 (0.8) | 0.4 (0.7) | 0.4 (0.9) | .832 |
| Body mass index SDS | −0.2 (1.1) | −0.3 (1.0) | −0.05 (1.1) | .297 |
| FSIGT test (n = 76) | 48 | 28 | ||
| Si × 10−4/min, mU/L | 6.1 (5.2) | 6.8 (5.8) | 5.0 (3.9) | .176 |
| AIR (mU/Liter) | 706.9 (564.4) | 726.3 (616.7) | 673.8 (470.2) | .881 |
| DI (Si × AIR) | 2929.3 (1762.9) | 3159.4 (1871.4) | 2534.7 (1510.2) | .066 |
| Fasting glucose, mmol/L | 5.0 (0.5) | 5.0 (0.5) | 5.1 (0.6) | .506 |
| Fasting insulin, mU/L | 13.6 (6.6) | 13.6 (7.3) | 13.7 (5.2) | .752 |
Data are expressed as mean (SDS), unless written otherwise. Fasting insulin and HOMA-IR were square root–transformed and Si, AIR, and DI were log-transformed before analyses. Bold text indicates a significant P-value (<.05)
AH SDS was calculated using references for Dutch adults (21 years).
FSIGT tests at AH were performed in 76 patients (48 after combined GH/GnRHa and 28 after GH treatment only) at a mean age of 17.4 (1.2) years. Fasting glucose, fasting insulin, Si, and AIR were similar in children treated with combined GH/GnRHa and those treated with GH only (Table 2). DI, a measure of β-cell function, tended to be slightly higher in the combined GH/GnRHa group, but this did not reach statistical significance (P = .066). All children were randomized to GH 1 or 2 mg/m2/d from pubertal onset until AH. In both the combined GH/GnRHa and GH groups, Si, AIR, and DI at AH were similar between children treated with GH 1 mg/m2/d and those treated with GH 2 mg/m2/d. During the 5.9 (1.4) years of study, none of the patients developed diabetes mellitus type 2.
Subgroup of early pubertal children randomized to GH 1 or 2 mg/m2/d and 2 years of GnRHa
In a subgroup of 48 children who started combined GH/GnRHa treatment in early puberty, the GH dose effects on insulin sensitivity and β-cell function were analyzed in detail. All children received GnRHa for the first 2 years in addition to GH (randomized to 1 or 2 mg/m2/d). Twenty-five children (16 girls) were randomized to treatment with GH 1 mg/m2/d (1-mg group) and 23 (15 girls) to GH 2 mg/m2/d (2-mg group). The boy/girl ratio and age at start were similar between the 1-mg and 2-mg groups. Because FM% SDS was significantly lower in the 2-mg group during the entire treatment period (P = .030), all analyses were adjusted for FM% SDS.
In this subgroup, FSIGT tests were performed at start of treatment, after 1 year of combined GH/GnRHa treatment and at AH. At all these time points, Si, AIR, and DI were similar in children treated with GH 1 mg/m2/d and those treated with GH 2 mg/m2/d. In both GH dose groups, Si decreased during the first year of combined GH/GnRHa treatment after which Si remained similar until AH, resulting in significantly lower Si values at AH than at start (Figure 3A). A compensatory increase in AIR was found during the first year of combined GH/GnRHa treatment in both GH dose groups after which it decreased until AH. At AH, AIR was similar to start in both GH dose groups (Figure 3B). During the first year of combined GH/GnRHa treatment, DI remained similar in both GH dose groups. In both GH dose groups, DI was lower at AH than at start, but this did not reach statistical significance (P = .12 and P = .05) (Figure 3C). The 2-mg group had a higher IGF-I SDS at AH than the 1-mg group (1.3 vs 0.8 SDS, P = .042), but Si, AIR, and DI were not significantly different between the GH dose groups.
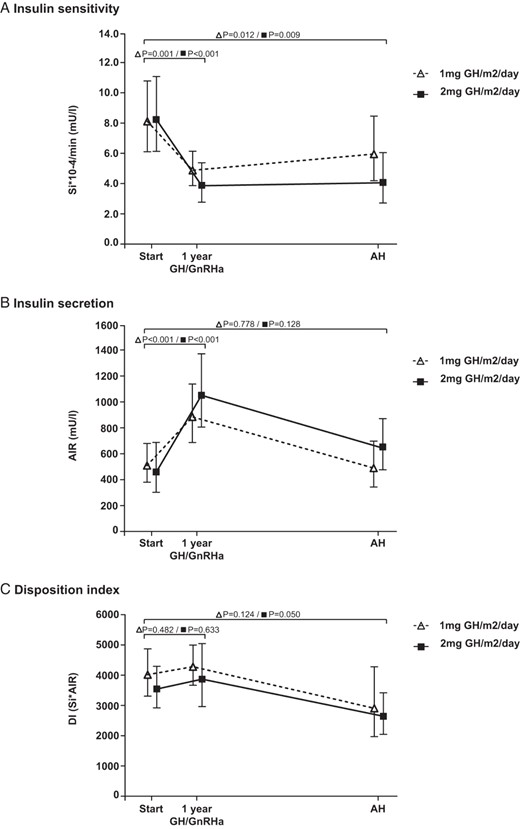
Insulin sensitivity and β-cell function in a subgroup of children who started GH treatment in early puberty with 2 years of GnRHa and subsequent GH until AH. A, Insulin sensitivity. B, Insulin secretion. C, Disposition index. Data are expressed as estimated marginal means with 95% confidence intervals. There were no significant differences between the 2 GH dose groups at any time point during the study.
Insulin sensitivity during 3 months of only GnRHa treatment
To investigate whether the changes during the first year of combined GH/GnRHa treatment were due to the effect of GH or could also be caused by a negative effect of GnRHa on insulin sensitivity, we performed an additional FSIGT test after 3 months of GnRHa treatment without GH in the last 15 children (9 girls) included in this study. After 3 months of GnRHa treatment, there were no significant changes in Si, AIR, or DI compared with baseline values (P = .377, P = .615, and P = .181, respectively).
Insulin sensitivity and β-cell function at AH by HOMA-IR
The FSIGT test is not easily applied in large populations because of its complexity, costs, and invasiveness; thus, we tested in the total group how the FSIGT test results correlated with data obtained by HOMA-IR, which is a more practical, cheaper, and less invasive measure. At start, fasting insulin levels and HOMA-IR were higher in the combined GH/GnRHa group (P = .004 and P = .005, respectively). However, after adjustment for the difference in Tanner stage at baseline, fasting insulin levels and HOMA-IR were similar between the combined GH/GnRHa group and GH group (Table 1). In all 110 children who reached AH, fasting glucose, fasting insulin, and HOMA-IR at AH were similar between children treated with GH/GnRHa and those treated with GH only. The correlation between HOMA-IR and Si measured by the FSIGT test was significant but not strong enough for HOMA-IR to serve as a proxy for Si measured by the FSIGT test in individual patients (r = −0.396, P < .001).
Discussion
This is the first study describing the long-term changes in insulin sensitivity and β-cell function determined by the FSIGT test with tolbutamide in short children born SGA who started GH treatment at ages older than 8 years. They were randomized to GH 1 or 2 mg/m2/d from start of puberty, either with or without additional GnRHa for 2 years. At AH, after an average of 5.9 years of GH treatment, Si, AIR, DI, fasting glucose, and fasting insulin were similar between children treated with combined GH/GnRHa and those treated with GH only. In the subgroup of children who started GH treatment in early puberty (randomized to 1 or 2 mg/m2/d) together with 2 years of GnRHa treatment, there were no significant differences in Si, AIR, or DI between the GH dose groups during the entire treatment.
Our study shows that 2 years of GnRHa in addition to GH treatment results in a similar insulin sensitivity at AH compared with GH treatment only. Short-term studies in girls with CPP compared combined GH/GnRHa treatment with GH only or placebo and showed no negative metabolic side effects (27, 28). A long-term study until AH about the effects of GnRHa treatment in girls with CPP showed lower insulin sensitivity at AH in treated girls than in untreated girls (5). In that study, however, insulin sensitivity was determined by HOMA-IR, which is not comparable with the gold standard FSIGT test with tolbutamide that we used. Furthermore, the difference in insulin sensitivity, could be explained by the higher body mass index in the girls with CPP treated with GnRHa as there is a strong negative correlation between total body fat mass and insulin sensitivity (29). At AH, we found neither a higher fat mass in the SGA children treated with combined GH/GnRHa nor a lower insulin sensitivity. Combined GH/GnRHa treatment tended to cause a slightly higher DI, a measure of β-cell function, than GH treatment only, but the difference was not significant.
In the subgroup of 48 children who all started GH treatment (randomized to 1 or 2 mg/m2/d) in early puberty with additional GnRHa treatment for 2 years, we found similar FSIGT test results during the entire treatment period in children treated with GH 1 mg/m2/d and in those treated with 2 mg/m2/d, reassuringly confirming our hypothesis that treatment with GH 2 mg/m2/d from start of puberty until AH does not result in a more impaired insulin sensitivity. These findings are in line with studies using oral glucose tolerance tests in SGA children treated with GH only (8, 10, 11, 30). The 2-mg group had a higher IGF-I SDS at AH than the 1-mg group (1.3 vs 0.8 SDS, P = .042), but Si, AIR, and DI were not significantly different between the GH dose groups.
In our subgroup, the decline in Si during the first year of combined GH/GnRHa treatment was counterbalanced by a compensatory increase in AIR. This demonstrates that the β-cells can compensate for the decline in insulin sensitivity by increasing their insulin secretion, indicating normal β-cell function (DI). Indeed, β-cell function did not change throughout treatment. At AH, insulin sensitivity was significantly lower than at start, which is in line with previous findings in SGA children treated with GH until AH (8, 30). From start to AH, our patients transitioned through puberty, and it is well known that healthy children show a decrease in insulin sensitivity, an increase in insulin secretion, and a decrease in glucose disposition index during puberty (31), which leads to a lower insulin sensitivity in healthy postpubertal adolescents than in prepubertal children (22, 32, 33). Thus, the lower insulin sensitivity than baseline in our patients might be explained by the fact that they are postpubertal.
Because both GH and GnRHa treatment can independently reduce Si (5–9), we also determined the effects on glucose homeostasis of GnRHa treatment without GH. After 3 months of GnRHa treatment, insulin sensitivity and β-cell function were similar to baseline, indicating that short-term GnRHa treatment does not affect insulin sensitivity. This is in contrast to findings with oral glucose tolerance tests in girls with CPP after 1 year of GnRHa treatment (6) but is supported by our finding that at AH, insulin sensitivity and β-cell function in children treated with GH/GnRHa were similar to those in children treated with GH only, suggesting that additional GnRHa for 2 years does not impair insulin sensitivity.
Our data are unique because the method we used, the FSIGT test with tolbutamide, is a gold standard for measuring insulin sensitivity and β-cell function like the euglycemic-hyperinsulinemic clamp (34). The addition of tolbutamide increases the reliability of the measurement of Si by providing a second surge of insulin instead of merely the initial fall in blood glucose which is, to some extent, due to glucose equilibrating into its full distribution volume and not to the action of insulin. The FSIGT test is more invasive, labor-intensive, and costly than other measurements of insulin sensitivity, for instance, the oral glucose tolerance test and HOMA-IR, but the results are more accurate. A limitation of this study is the absence of FSIGT tests at start of treatment in all children. This would have given us the opportunity to study the development of insulin sensitivity and β-cell function from start of treatment until AH. Furthermore, it will be interesting for future studies to measure insulin sensitivity also at discontinuation of 2 years of GnRHa treatment. Because of the invasiveness of FSIGT tests, we decided not to perform an FSIGT test at that time point.
Our research group previously published AH results for this cohort. Height SDS at start of puberty was significantly lower in children treated with GH/GnRHa, but AH was similar (Table 2). This finding indicates that children who are shorter at start of puberty (<140 cm) with a poor AH expectation benefit from additional GnRHa treatment. The double GH dose of 2 mg/m2/d during puberty resulted in a significantly better height gain SDS in boys (2).
In conclusion, our study is the first report showing that 2 years of GnRHa treatment in addition to GH treatment results in a similar insulin sensitivity and β-cell function at AH compared with GH treatment only in children born SGA, indicating that combined GH/GnRHa treatment does not have long-term negative effects on glucose homeostasis in early adulthood. When started in early puberty, a GH dose of 2 mg/m2/d results in a similar insulin sensitivity from childhood into early adulthood as a GH dose of 1 mg/m2/d.
Acknowledgments
We express our gratitude to all children and their parents for their participation in this study. We thank J. Bontenbal-van de Wege, J. van Houten, J. C. Bruinings-Vroombout, B. Kerkhof, and J. van de Puttelaar, research nurses, for their contribution to the study. We also greatly acknowledge W. Hackeng for performing laboratory analyses. We thank all collaborating physicians and pediatricians who referred patients for participation in our study.
This study has been registered under clinical trial registration numbers ISRCTN18062389, NTR299, CCMO P03.15.24.L, and MEC 231.731/2003/155.
This study received financial support from the Vereniging Trustfonds Erasmus Universiteit Rotterdam for conference visits, and we acknowledge the investigator-initiated research grant provided by Pfizer Farma B.V., The Netherlands.
Disclosure Summary: A.C.S.H.-K., the principal investigator of the investigator-responsible GH study, received an independent research grant from Pfizer B.V., The Netherlands. The other authors have nothing to declare.
Abbreviations
- AH
adult height
- AIR
acute insulin response
- CPP
central precocious puberty
- DI
disposition index
- DXA
dual-energy x-ray absorptiometry
- FM%
fat mass percentage
- FSIGT
frequently sampled intravenous glucose tolerance
- GnRHa
GnRH analog
- HOMA-IR
homeostasis model assessment of insulin resistance
- SDS
standard deviation score
- SGA
small for gestational age
- Si
insulin sensitivity.
