


Renal disease in type 2 diabetes mellitus (T2DM) is associated with excess morbidity/mortality. Although estimated glomerular filtration rate (eGFR) and albuminuria are routine for assessing renal impairment, novel biomarkers could improve risk stratification and prediction.
To identify specific biomarkers of progression of renal dysfunction.
Prospective observational.
Academic diabetes clinics.
A total of 286 T2DM patients (age, 62 ± 8 y; glycosylated hemoglobin, 7.2 ± 0.9%; eGFR, 85 ± 20 mL · min−1 · 1.73 m2).
None.
Progression of eGFR and albuminuria.
We performed screening metabolomics in serum and urine samples by gas chromatography/mass spectroscopy (MS) and ultra-high performance liquid chromatography/MS/MS. Biomarker identification was performed by random forest using an eGFR cutoff of < 60 mL · min−1 · 1.73 m2 or an albumin/creatinine ratio (ACR) cutoff ≥ 30 mg/g as response variables. At follow-up, eGFR had declined by 16 [9] (median [interquartile ratio]) mL · min−1 · 1.73 m2, and ACR had increased by 41 [135] mg/g in patients in the respective top quartile of changes from baseline. Clinical parameters (gender, age, fasting glucose, and baseline eGFR) predicted outcome, with receiver operator characteristics curve (ROC) = 0.671. The five serum metabolites best correlated with either eGFR < 60 or ACR ≥ 30 at baseline were tested for their ability to improve clinical prediction. The sum of C-glycosyl tryptophan, pseudouridine, and N-acetylthreonine (MetIndex) raised the ROC to 0.739 (P < .0001). eGFR decline was predicted by the top MetIndex quartile (odds ratio = 5.48 [95% confidence interval, 2.23–14.47]). MetIndex also predicted an ACR increase with an odds ratio of 2.82 [1.20–7.03] and a ROC of 0.750. Top urine metabolites did not add significant predictivity.
A limited number of circulating intermediates of amino acid and nucleotide pathways carry clinically significant predictivity for deterioration of renal function in well-controlled T2DM.
Recent cross-sectional and prospective observational studies of chronic kidney disease (CKD) in type 2 diabetes (T2DM) have documented marked phenotype heterogeneity (both in terms of the clinical characteristics of affected patients and glomerular ultrastructure) (1–3). In a high proportion of T2DM patients with normal albumin excretion rate (ie, the marker universally used to identify incipient diabetic nephropathy), glomerular filtration rate (GFR) is already reduced (4, 5). On the other hand, serum creatinine, the value on which GFR estimation is based, is also secreted by the tubular cells, so that its secretion is itself dependent upon GFR; thus, the slope of the reciprocal of serum creatinine often is misleading in quantifying CKD progression. Thus, classical risk factors for diabetic CKD do not explain all of the risk; hence, new risk factors need to be found.
Although large epidemiological studies help identify subsets of patients and provide insight into the natural history of diabetic nephropathy, early biomarkers are needed to develop predictive algorithms and improve renal and cardiovascular risk stratification. Metabolomics is one approach that can contribute to a detailed characterization of diabetic and nondiabetic renal impairment (6–8). Qualitative and quantitative analysis of low-molecular-weight molecules originating from cell metabolism and present in tissues, organs, or biological fluids may read out different pathophysiological variants and give insight into the mechanisms underlying the decline in GFR and the emergence of albuminuria. When interpreted in the context of metabolic pathways, biomarkers can also point at novel therapeutic targets.
The aim of the present study was to carry out a thorough metabolomic screening of serum and urine samples from a large cohort of T2DM patients with relatively preserved renal function, and to assess the predictive power and potential biological significance of any novel biomarker that rigorous statistical analysis may identify for renal disease.
Patients and Methods
Patients
We recruited 286 T2DM patients consecutively referred to the outpatient clinics of the University of Pisa and the University of Rome between March and July 2011. Exclusion criteria were dialysis or transplantation, an estimated GFR (eGFR) below 30 mL · min−1 · 1.73 m−2, liver disease, and cancer. This cohort had an average disease duration of 13 ± 9 years, a mean glycosylated hemoglobin (HbA1c) of 7.2 ± 0.9% (55.0 ± 9.8 mmol/mol), and a baseline eGFR of 85 ± 20 mL · min−1 · 1.73 m−2.
Study design and protocol
In each participant, a serum sample and a urine sample were collected after an overnight fast. Separate aliquots were prepared for plasma glucose, serum creatinine, and HbA1c and for metabolomics analysis. For the latter, a blinded identification code was used to track sample handling, results, and data analysis. The samples (and all derived aliquots) were stored at −80°C until processed. Fasting glucose was measured by the glucose-oxidase method, whereas HbA1c was determined by HPLC using Diabetes Control and Complications Trial-aligned methods. Serum creatinine was assessed by the modified Jaffe method; one to three measurements were obtained for each patient, and eGFR was calculated by the Chronic Kidney Disease Epidemiology Collaboration formula (9). The albumin excretion rate was obtained from 24-hour urine collections in the absence of symptoms and signs of urinary tract infection or other interfering clinical conditions. In each subject, two collections were performed over the 3 months before the study to confirm the proteinuric state. Albuminuria was measured in fresh urine samples by immunonephelometry or immunoturbidimetry.
Fractional urinary excretion was calculated by multiplying the plasma-to-urine ratio of a metabolite by the urine-to-plasma creatinine ratio. Blood pressure was the mean of three measurements obtained in the sitting position. All variables were reevaluated at the 3-year follow-up, using the same methods as in the baseline study. The protocol was approved by the respective Institutional Ethics Committees, and all patients signed an informed consent.
Metabolomic analysis
Metabolite analysis
Nontargeted metabolomic profiling analysis was performed by Metabolon as previously described (10).
Sample preparation
Samples were prepared using the automated MicroLab STAR system (Hamilton Co). A recovery standard was added before the first step in the extraction process for quality control (QC) purposes. Sample preparation was conducted using an aqueous methanol extraction process to remove the protein fraction while allowing maximum recovery of small molecules. The resulting extract was divided into four fractions: one for analysis by ultra-high performance liquid chromatography (UPLC)/tandem mass spectroscopy (MS/MS) (positive mode), one for UPLC/MS/MS (negative mode), one for gas chromatography (GC)/MS, and one for backup. Samples were placed briefly on a TurboVap (Zymark) to remove the organic solvent. Each sample was frozen and dried under vacuum. Samples were then prepared for the appropriate instrument, either UPLC/MS/MS or GC/MS.
UPLC/MS/MS analysis
The liquid chromatography (LC)/MS portion of the platform was based on a Waters ACQUITY UPLC and a Thermo-Finnigan linear trap quadrupole mass spectrometer, which consisted of an electrospray ionization source and linear ion-trap mass analyzer. The sample extract was dried, then reconstituted in acidic or basic LC-compatible solvents, each of which contained ≥ eight injection standards at fixed concentrations to ensure injection and chromatographic consistency. One aliquot was analyzed using acidic positive ion optimized conditions, and the other using basic negative ion optimized conditions in two independent injections using separate dedicated columns. Extracts reconstituted in acidic conditions were gradient eluted using water and methanol containing 0.1% formic acid, whereas the basic extracts, which also used water/methanol, contained 6.5 mm ammonium bicarbonate. The MS analysis alternated between MS and data-dependent MS2 scans using dynamic exclusion. Raw data files are archived and extracted as described below.
GC/MS analysis
The samples destined for GC/MS analysis were redried under vacuum desiccation for a minimum of 24 hours before being derivatized under dried nitrogen using bistrimethyl-silyl-triflouroacetamide. The GC column was 5% phenyl, and the temperature ramp was from 40 to 300°C in a 16-minute period. Samples were analyzed on a Thermo-Finnigan Trace DSQ fast-scanning single-quadrupole mass spectrometer using electron impact ionization. The instrument was tuned and calibrated for mass resolution and mass accuracy on a daily basis. The information output from the raw data files was automatically extracted as discussed below.
Quality assurance/QC
For quality assurance/QC purposes, additional samples were included with each day's analysis. These samples included extracts of a pool of well-characterized human plasma, extracts of a pool created from a small aliquot of the experimental samples, and process blanks. QC samples were spaced evenly among the injections, and all experimental samples were randomly distributed throughout the run. A selection of QC compounds was added to every sample for chromatographic alignment, including those under test. These compounds were carefully chosen so as not to interfere with the measurement of the endogenous compounds.
Data extraction and compound identification
Raw data were extracted, peak-identified, and QC-processed using Metabolon's hardware and software. These systems are built on a web-service platform utilizing Microsoft .NET technologies, which run on high-performance application servers and fiber-channel storage arrays in clusters to provide active failover (in case of failure or abnormal termination of the servers and/or arrays) and load-balancing. Compounds were identified by comparison to library entries of purified standards or recurrent unknown entities. Metabolon maintains a library based on authenticated standards that contains the retention time/index (RI), mass to charge ratio (m/z), and chromatographic data (including MS/MS spectral data) on all molecules present in the library. Furthermore, biochemical identifications are based on three criteria: retention index within a narrow RI window of the proposed identification, nominal mass match to the library ± 0.2 amu, and the MS/MS forward and reverse scores between the experimental data and authentic standards. The MS/MS scores are based on a comparison of the ions present in the experimental spectrum to the ions present in the library spectrum. Although there may be similarities between these molecules based on one of these factors, the use of all three data points can be utilized to distinguish and differentiate biochemicals. Identification of known chemical entities was based on comparison to library entries of purified standards. Missing values (if any) are imputed to the lowest measured value, and metabolite data are scaled proportionately to a median of 1.
Data analysis
Data were elaborated by using the random forest (RF) analysis, developed by Breiman (11). This method employs a multistage decision process that attempts to identify and rank relationships between input values (predictive variables) and target values (response variables). Briefly, the RF algorithm works as a large collection of decorrelated decision trees. Instead of using all variables in a dataset, the algorithm randomly selects a subset when building a tree. Furthermore, each tree is grown using a particular bootstrap sampling (random sampling with replacement); part of the data will be “left out” of the sample, whereas another part will be repeated. In this sense, RF analysis has no need of an explicit test sample because every tree in the forest is built on about two-thirds of the available data, leaving the remainder for testing (the out-of-bag data). To classify a new element, the classifier takes the most votes among the random tree classifiers, thereby increasing the classification accuracy. In this study, we have considered the most important variables as the top metabolites. The mean decrease in classification accuracy and the Gini score are chosen to measure variable importance. Data were analyzed using the R package “Random forest” (R 3.0.3 for Mac Os X; http://www.R-project.org), the predictive variables being serum and urine metabolites, and the primary response variable, a baseline eGFR < 60 mL · min−1 · 1.73 m−2. Additional analyses were performed using a baseline ACR of ≥ 30 mg/g.
To visualize interaction networks and biological pathways of the significant metabolites, we utilized Cytoscape (http://cytoscape.org), an open source software platform (12). Additional features were analyzed by Metscape3, ClusterMaker2, and Pepper Plugins for Mac.
Statistical analysis
Values are expressed as mean ± standard deviation; because of its skewed distribution, ACR is expressed as median [interquartile range] and was log-transformed for use in multivariate analyses. Group comparisons were carried out with the χ2 or Mann-Whitney test. Multivariate logistic analysis was performed using the forward elimination method; results are given as odds ratio (OR) and 95% confidence interval (CI) along with the c statistic (ROC area under the curve [ROCAUC]). Principal component analysis was run using the VARIMAX factor rotation. A significance level of P = .05 was utilized in all tests. JMP-SAS (version 7) and SPSS-IBM20 for Mac were used for these analyses.
Results
Clinical data
The clinical characteristics of the study patients grouped by baseline eGFR (<60 or ≥ 60 mL · min−1 · 1.73 m−2) are given in Table 1. There were no group differences in sex distribution, body mass index (BMI), blood pressure, and degree of glycemic control; however, the group with impaired renal function was approximately 7 years older than the other group. When grouped by baseline ACR (<30 or ≥ 30 mg/g), albuminuric patients were 4 years older and had higher systolic blood pressure levels than normoalbuminuric patients (Table 2).
Clinical Characteristics of T2DM Patients by eGFR
| eGFR < 60 mL · min−1 · 1.73 m−2 (n = 45) | eGFR ≥ 60 mL · min−1 · 1.73 m−2 (n = 241) | Pa | |
|---|---|---|---|
| Sex, % men | 56 | 63 | ns |
| Age, y | 68 ± 5 | 61 ± 7 | <.0001 |
| Duration of disease, y | 15 ± 10 | 12 ± 9 | ns |
| Treatment, diet/OHA/I | 5/60/35 | 3/70/27 | ns |
| Baseline, n | 43 | 246 | |
| BMI, kg · m−2 | 28.7 ± 4.1 | 29.1 ± 5.2 | ns |
| Fasting glucose, mg/dL | 149 ± 42 | 148 ± 40 | ns |
| HbA1c, % | 7.3 ± 1.1 | 7.2 ± 0.9 | ns |
| Systolic BP, mm Hg | 143 ± 16 | 141 ± 19 | ns |
| Diastolic BP, mm Hg | 76 ± 7 | 77 ± 9 | ns |
| Serum creatinine, mg/dL | 1.49 ± 0.73 | 0.81 ± 0.18 | <.0001 |
| eGFR, mL · min−1 · 1.73 m−2 | 48 ± 12 | 91 ± 13 | <.0001 |
| ACR, mg/g | 38 [73] | 12 [43] | .0039 |
| Follow-up, n | 40 | 229 | |
| BMI, kg · m−2 | 29.2 ± 4.6 | 29.1 ± 5.2 | ns |
| Fasting glucose, mg/dL | 138 ± 41 | 140 ± 38 | ns |
| HbA1c, % | 7.3 ± 1.2 | 7.2 ± 1.1 | ns |
| Serum creatinine, mg/dL | 1.46 ± 0.64 | 0.85 ± 0.19 | <.0001 |
| eGFR, mL · min−1 · 1.73 m−2b | 52 ± 19 | 86 ± 14 | <.0001 |
| ACR, mg/gb | 49 [186] | 11 [43] | .0017 |
Abbreviations: OHA, oral hypoglycemic agents; I, insulin. Data are expressed as mean ± SD or median [interquartile range], unless otherwise specified.
χ2 or Mann-Whitney test for group differences.
Significant change from baseline (interaction time × group).
Clinical Characteristics of T2DM Patients by ACR
| ACR ≥ 30 mg/g | ACR < 30 mg/g | Pa | |
|---|---|---|---|
| n | 93 | 166 | |
| Sex, % men | 72 | 61 | ns |
| Age, y | 64 ± 6 | 60 ± 8 | <.0001 |
| Duration of disease, y | 14 ± 9 | 14 ± 10 | ns |
| Treatment, diet/OHA/I | 2/61/37 | 3/71/26 | ns |
| Baseline, n | 92 | 166 | |
| BMI, kg · m−2 | 29.4 ± 4.8 | 28.8 ± 5.2 | ns |
| Fasting glucose, mg/dL | 154 ± 43 | 146 ± 41 | ns |
| HbA1c, % | 7.3 ± 1.0 | 7.2 ± 0.9 | ns |
| Systolic BP, mm Hg | 145 ± 17 | 138 ± 20 | .009 |
| Diastolic BP, mm Hg | 78 ± 8 | 76 ± 9 | ns |
| Serum creatinine, mg/dL | 1.01 ± 0.47 | 0.85 ± 0.38 | .0003 |
| ACR, mg/g | 82 [153] | 7 [8] | <.0001 |
| eGFR, mL · min−1 · 1.73 m−2 | 79 ± 22 | 90 ± 18 | <.0001 |
| Follow-up, n | 88 | 156 | |
| BMI, kg · m−2 | 29.5 ± 4.8 | 28.9 ± 5.3 | ns |
| Fasting glucose, mg/dL | 138 ± 41 | 140 ± 38 | ns |
| HbA1c, % | 7.4 ± 1.3 | 7.2 ± 1.0 | ns |
| Serum creatinine, mg/dL | 1.07 ± 0.52 | 0.87 ± 0.24 | <.0001 |
| ACR, mg/g | 87 [168] | 7 [12] | <.0001 |
| eGFR, mL · min−1 · 1.73 m−2 | 72 ± 21 | 86 ± 17 | <.0001 |
Abbreviations: OHA, oral hypoglycemic agents; I, insulin. Data are expressed as mean ± SD or median [interquartile range], unless otherwise specified.
χ2 or Mann-Whitney test for group differences.
RF analysis
RF analysis selected the top 30 plasma and urine metabolites associated with a baseline eGFR < 60 mL · min−1 · 1.73 m−2 (Supplemental Figure 1); the overall predictive accuracy was higher for plasma than urine metabolites (90.3 vs 75.3%). The same analysis using an ACR ≥ 30 mg/g as the response variable (Supplemental Figure 2) yielded a lower predictive accuracy than using eGFR < 60 and was similar for plasma and urine metabolites (69.7 and 65.5%, respectively).
Using a cutoff of 75 mL · min−1 · 1.73 m−2 for baseline eGFR as the response variable, pseudouridine, N-acetylthreonine, and C-glycosyl tryptophan remained among the top five plasma metabolites, with a predictive accuracy of 86.2% (Table 3).
Top Five Identified Metabolites Associated With an eGFR < 60 mL · min−1 · 1.73 m−2 or an ACR ≥ 30 mg/g
| eGFR < 60 mL · min−1 · 1.73 m−2 | ACR ≥ 30 mg/g | |
|---|---|---|
| Serum | Pseudouridine (1) | 1-Oleoylglycerol (1) |
| N6-Carbamoylthreonyladenosine (2) | 1-Linoleoylglycerol (2) | |
| C-Glycosyl tryptophan (3) | N2,N5-Diacetylornithine (3) | |
| N-Acetylthreonine (4) | 1-Palmitoylglycerol (5) | |
| 3-Methylglutarylcarnitine (6) | N-Acetylthreonine (7) | |
| Predictive accuracy, % | 90.3 | 69.7 |
| Urine | ||
| Tryptophan (3) | Ethanolamine (1) | |
| N2-Methylguanosine (4) | Glycylproline (2) | |
| Glycolate (5) | Alanylleucine (4) | |
| β-Hydroxyisovalerate (6) | N1-Methyladenosine (11) | |
| Pantothenate (8) | β-Hydroxyisovalerate (12) | |
| Predictive accuracy, % | 75.3 | 65.5 |
Numbers in parentheses indicate the position of the metabolite in the RF analysis, as reported in Supplemental Figures 1 and 2.
Regression analysis
We regressed baseline eGFR for the whole cohort against the top five serum metabolites associated with eGFR < 60 and the top five serum metabolites associated with ACR ≥ 30. Only three metabolites (C-glycosyl tryptophan, pseudouridine, and N-acetylthreonine) were significant independent correlates of baseline eGFR (adjusted r2 = 0.52; P < .0001) (Supplemental Figure 3). The same multivariate model using baseline (log-transformed) ACR yielded only two metabolites (C-glycosyl tryptophan and 1-oleoylglycerol), with an adjusted r2 of 0.14 (P < .0001). Adding the top urine metabolites (tryptophan, N2-methylguanosine, β-hydroxyisovalerate, glycolate [hydroxyacetate], N1-methyladenosine, pantothenate [vitamin B5], ethanolamine, glycylproline, and alanylleucine) did not improve the prediction of baseline eGFR and raised the adjusted r2 for baseline ACR to 0.27.
Of note is that in bivariate analysis each of the top three metabolites (pseudouridine, N-acetylthreonine, and C-glycosyl tryptophan) was positively associated with baseline ACR after accounting for baseline eGFR (P < .02 or less).
The fractional urine excretion rates of the top metabolites were 0.95 [0.37]%, 0.97 [0.32]%, and 0.88 [1.44]% for pseudouridine, C-glycosyl tryptophan, and N-acetylthreonine, respectively, in the eGFR < 60 group; the corresponding values in the eGFR ≥ 60 group were 0.95 [0.35]%, 0.92 [0.34]%, and 0.90 [1.88]% (all P = nonsignificant [ns] for the group difference). Also, none of these values correlated with baseline eGFR or ACR as continuous variables.
Logistic model
Anthropometric and metabolic variables (sex, age, BMI, blood pressure, fasting glucose, HbA1c, and ACR) were related to baseline eGFR < 60, with a ROCAUC of 0.785, with only age (P < .0001) and ACR (P = .05) contributing significantly. When adding C-glycosyl tryptophan, pseudouridine, and N-acetylthreonine, the model reached a ROCAUC of 0.943. An index, calculated as the arithmetic sum of C-glycosyl tryptophan, pseudouridine, and N-acetylthreonine, was used as a “metabolomic” predictor (MetIndex) of changes in eGFR over time. Nonlinear combinations of the three biomarkers were not more efficient than the arithmetic sum.
Principal component analysis
A principal component analysis was performed using the top five metabolites identified by RF of serum and urine against both baseline eGFR and baseline ACR (listed in Table 3) together with baseline metabolic variables (age, BMI, fasting glucose, HbA1c, and systolic and diastolic blood pressure). As shown in Table 4, the factor containing eGFR clustered with ACR and with the three metabolites of MetIndex (plus four other metabolites), whereas BMI, glucose, and blood pressure clustered with three similar lipid molecules (1-acylglycerols) (factor 3), and age absorbed the remaining metabolites into factor 2. The percentage of the variance accounted for by the first three components to the total variance in all of the considered variables was equal to 50%.
Principal Components Analysis by Combined eGFR and ACR
| Factor 1 | Factor 2 | Factor 3 |
|---|---|---|
| ACR | Age (−) | BMI |
| eGFR (−) | β-Hydroxyvalerate | Fasting plasma glucose |
| N-Acetylthreonine | Hydroxyacetate | HbA1c |
| N2,N5-Diacetylornithine | N2-Methylguanosine | Systolic BP |
| Pseudouridine | Vitamin B5 | Diastolic BP |
| N6-Carbamoyl-threonyladenine | Tryptophan | 1-Linoleoylglycerol |
| C-Glycosyl tryptophan | Ethanolamine | 1-Oleoylglycerol |
| 3-Methyl-glutarylcarnitine | N1-Methyladenosine | 1-Palmitoylglycerol |
Importantly, the clustering of all metabolites was unchanged when baseline eGFR and ACR were replaced by their respective follow-up values.
Follow-up data analysis
At follow-up, in the whole cohort eGFR had declined from baseline by 4.7 ± 12.6 mL · min−1 · 1.73 m−2 (P < .0001 vs zero), and ACR had changed by 0.4 [20.5] mg/g (P = ns).
eGFR decreased significantly only in the eGFR ≥ 60 group, whereas ACR increased only in the eGFR < 60 group (Table 1). An eGFR decline in the top quartile of the entire cohort distribution (>10 mL · min−1 · 1.73 m−2; mean, 18 ± 8 mL · min−1 · 1.73 m−2) was chosen as a primary endpoint. Significant baseline clinical covariates (female gender, age, fasting glucose, and baseline eGFR) predicted this outcome with ROCAUC of 0.671. MetIndex predicted the same outcome with an OR of 3.10 [95% CI, 1.84–5.56], thereby raising ROCAUC to 0.739 (P < .0001) (Figure 1). Outcome was predicted by the top MetIndex quartile (OR = 5.48 [95% CI, 2.23–14.47] vs OR [95% CI] values of 1.73 [1.07–3.21], 1.59 [1.09–2.40], 1.49 [1.10–2.02], and 2.66 [1.61–4.70] for gender, age, glucose, and baseline eGFR, respectively).
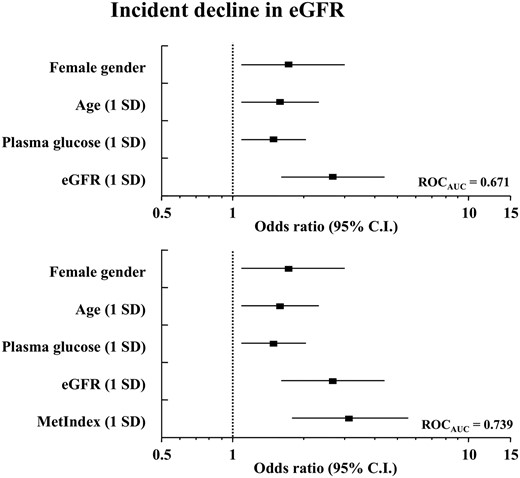
Multivariate logistic analysis of an incident decline of eGFR > 10 mL · min−1 · 1.73 m−2 using clinical variables only (top) and adding MetIndex (bottom).
In the same logistic model, MetIndex also predicted a change in ACR in the top quartile (+41 [135] mg/g) with an OR of 2.82 [1.08–6.28] and a ROCAUC of 0.821 (Figure 2). In the 16 patients who were in the top quartile of eGFR decline and in the top quartile of ACR increase, a MetIndex value in the upper quartile carried an almost 9-fold increased risk (OR = 8.47 [95% CI, 2.33–38.06] vs OR [95% CI] values of 1.86 [1.09–3.16] for plasma glucose and 2.58 [1.44–5.02] for baseline ACR). Top urine metabolites did not add significant predictivity to any of these statistical models, nor did antidiabetic treatment.
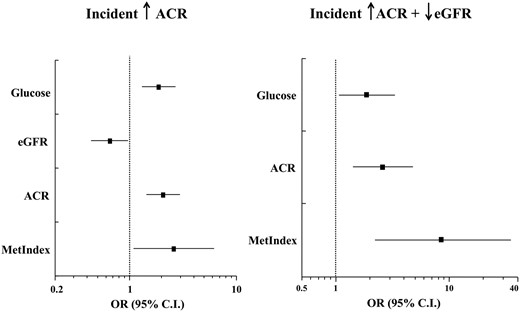
Multivariate logistic regression analysis of an incident increase in ACR > 14 mg/g (left, ROCAUC = 0.821) and a combined incidence of eGFR > 10 mL · min−1 · 1.73 m−2 and ACR > 14 mg/g (right, ROCAUC = 0.895).
Discussion
The main findings of the current study are: 1) screening metabolomics of plasma and urine identified small molecules that predict faster progression of GFR decline in T2DM patients with long disease duration but good glycemic control and free from severe CKD; 2) plasma metabolomics was more informative than urine metabolomics; 3) a combination (MetIndex) of the three most efficient metabolites (C-glycosyl tryptophan, pseudouridine, and N-acetylthreonine) added significant predictivity to standard anthropometric and metabolic predictors; and 4) the same set of biomarkers also predicted an increase in albuminuria. From the methodological viewpoint, it is of note that biomarker identification was primarily done using eGFR < 60 as the response variable, but was confirmed using 75 mL · min−1 · 1.73 m−2 as the response variable. Also relevant is that the availability of serum and urine data from the same platform made it possible to compare the fractional urinary excretion of the top three metabolites between the eGFR < 60 and the eGFR ≥ 60 groups or the ACR ≥ 30 and ACR < 30 groups. The lack of significant differences between these groups suggests that these molecules mark renal damage beyond a reduced GFR or a higher ACR. Finally, by principal component analysis, these three metabolites segregated with both baseline and follow-up eGFR and ACR separately from age and other clinical variables (Table 4). Of interest for future studies is that BMI, glycemic control, and blood pressure clustered with three 1-acylglycerols, whereas increasing age segregated with tryptophan, ethanolamine, xenobiotics (such as pantothenate [vitamin B5], glycolate [hydroxyacetate], and the leucine catabolite, β-hydroxyisovalerate), and products of purine metabolism (N2-methylguanosine and N1-methyladenosine).
Previous metabolomics studies in animal models and in type 1 and type 2 diabetes patients have identified a number of urine metabolites as candidate biomarkers of development or progression of renal damage (13–15). In particular, plasma pseudouridine and C-glycosyl tryptophan have recently been associated with end-stage renal disease in a nested case-control study of 40 T2DM patients over 8–12 years of follow-up using the same platform as employed in the present study (16). The current data therefore expand the previous findings and extend them to patients with well-controlled disease progressing to less severe renal damage. Importantly, our empirical combined index, MetIndex, also performed better than metabolic variables in predicting an increase in ACR. This finding lends further support to the interpretation that these metabolites track renal damage and suggests that MetIndex might have value in discriminating disease progression as gauged by GFR viz. albuminuria (17, 18).
To gain insight into the biology of these metabolites and to frame them within a plausible pathophysiological context, we applied network analysis based on a protein-protein interaction. Pseudouridine, an isoform of uridine, is a uracil derivative previously described as increased in end-stage renal disease (19). ClusterMaker2 (20) plots pseudouridine close to TAN1, a gene encoding NOTCH1. This transmembrane protein is definitely relevant in renal physiology: it is required for angiogenesis and neovascularization in glomeruli, is important in podocyte differentiation, and plays a pivotal role in the aging kidney after ischemia/reperfusion damage (21–23). C-glycosyl tryptophan (also known as C-mannosyl tryptophan) is a tryptophan glycoconjugate that has previously been used as a proxy of renal function (24, 25). In CKD patients, serum tryptophan levels have been reported to be decreased, whereas metabolites of the kynurenine pathways are increased (26, 27). Noticeably, several metabolites and uremic toxins derived from tryptophan may promote oxidative stress, leukocyte activation, and inflammation in endothelial and vascular smooth muscle cells, likely contributing to cardiovascular disease in CKD patients (28). In the present database, tryptophan was directly related to eGFR (r = 0.29; P < .0001), whereas kynurenine was inversely related to eGFR (r = −0.50; P < .0001).
Moreover, the link between tryptophan and kynurenine is mediated by tryptophan-2,3-dioxygenase (TDO)2, another gene that ClusterMaker associates with our MetIndex. A further interesting link of C-glycosyl tryptophan is with CORO1A, which is involved in the regulation of mitochondrial apoptosis (29). Renal cell apoptosis is frequently observed in kidney biopsies of diabetic patients, especially in the tubular nephron (30, 31), and altered mitochondrial morphology and mitochondrial fragmentation precedes tubular cell apoptosis in animal and cell models (32, 33). A major role for mitochondrial dysfunction in the pathogenesis of diabetic nephropathy has been demonstrated by recent elegant work combining urine-targeted metabolomics with kidney biopsies (14).
N-acetylthreonine, a product of threonine metabolism, is associated with serum- and glucocorticoid-inducible kinase 1, a serine/threonine protein kinase that modulates angiotensin II and sodium reabsorption in tubular cells (34), thus contributing to fluid retention and hypertension, enhanced coagulation, and increased deposition of matrix proteins. Lastly, network analysis links N6-carbamoylthreonyladenosine, another molecule clustering with GFR and ACR (Table 4), with CDKAL1, a gene whose variants have consistently been associated with T2DM (35).
It should be noted that, although we did not have a validation set of patients available for study, this is the first report of combined plasma and urine metabolomics in the same cohort, using both decline in eGFR and increase in ACR as outcomes variables in a prospective investigation.
In conclusion, our extensive metabolomics analysis in T2DM patients yielded a set of circulating metabolites that perform effectively in predicting progression of renal dysfunction at an early stage. In addition to clinical applicability, these metabolites have heuristic value because they point at multiple mechanisms of damage and genetic interactions in a condition, diabetic nephropathy, that accumulating evidence shows to be multifactorial.
Acknowledgments
This work was supported by institutional grants of the Italian Minister of Research and by Metabolon, Inc (Durham, North Carolina).
Disclosure Summary: M.L.M. has nothing to declare. J.E.C. is employed in Metabolon Inc. A.S., G.Pe., and G.Pu. received scientific grants and speaking engagements from Astra Zeneca, Eli-Lilly, and Boehringer-Ingelheim. EF has membership on a Scientific Advisory Board or has speaking engagements from Boehringer-Ingelheim, Merck Sharp&Dohme, Metabolon, Inc, AstraZeneca, Eli Lilly & Co, Johnson & Johnson, Takeda, Novo Nordisk, GSK, and Sanofi; and has research grant support from Eli Lilly & Co and Boehringer Ingelheim.
Abbreviations
- ACR
albumin/creatinine ratio
- BMI
body mass index
- CI
confidence interval
- CKD
chronic kidney disease
- eGFR
estimated GFR
- GC
gas chromatography
- GFR
glomerular filtration rate
- HbA1c
glycosylated hemoglobin
- LC
liquid chromatography
- MS
mass spectroscopy
- OR
odds ratio
- QC
quality control
- RF
random forest
- ROC
receiver operator characteristics curve
- ROCAUC
ROC area under the curve
- T2DM
type 2 diabetes mellitus
- UPLC
ultra-high performance LC.
