


Abstract
Although clinical trials have shown that hypoglycemia is associated with coronary artery disease (CAD), little is known whether hypoglycemia is a CAD risk factor in primary care.
We sought to determine whether previous hypoglycemia was associated with incident CAD, and whether this association differed in patients of different underlying vascular risk.
This is a longitudinal cohort study of diabetes patients without CAD before January 1, 2006 (n = 9173) followed at an academic network of 13 primary care practices from January 1, 2006 to June 30, 2012. Hypoglycemic events before January 1, 2006 were identified via International Classification of Diseases Ninth Revision codes from emergency department, inpatient and outpatient visits.
Patients were followed until incident CAD or June 30, 2012. Cox regression with time interaction was used to determine the association between hypoglycemia and CAD (significance set at P ≤ .05). We then tested the association among high vascular risk patients (age ≥ 55 y, hemoglobin A1c ≥ 7.5%, ≥2 risk factors [dyslipidemia, hypertension or obesity]), a subset of high vascular risk patients aged 65 years or older, and the remaining patients with lower vascular risk.
Three percent of patients (n = 285) had previous hypoglycemia. Hypoglycemia was associated with a 2-fold CAD risk (hazard ratio [HR] 2.15; 95% confidence interval [95%CI] 1.24–3.74), adjusting for time interaction and vascular risk factors. Among high vascular risk patients, the risk was 3-fold (HR 3.01 [95%CI 1.15–7.91], n = 1823 [20% of cohort]), and over 4-fold (HR 4.62 [95%CI 1.65–12.9], n = 996) in the subset aged more than or equal to 65 years. No association was found in the remaining 80% of the cohort with lower vascular risk.
Previous hypoglycemia was associated with CAD among high vascular risk patients. Hypoglycemia may not be a CAD risk factor for the majority of primary care patients with lower underlying vascular risk.
Hypoglycemia, a potentially dangerous adverse event of diabetes therapy, limits treatment intensification to achieve euglycemia. Although randomized controlled trials (RCTs) have shown that tighter glycemic control in diabetes patients protects against microvascular complications (1), recent studies, Action to Control Cardiovascular Risk in Diabetes (ACCORD) (2), the Action in Diabetes and Vascular Disease: Preterax and Diamicron Modified Release Controlled Evaluation trial (3), Veterans Affairs Diabetes Trial (4), and The Outcome Reduction With Initial Glargine Intervention trial (5), have failed to provide strong supporting evidence that tighter control reduces cardiovascular events. ACCORD reported contrasting results where intensive therapy was associated with a 21% increase in total mortality risk (2) but a 13% risk reduction in ischemic heart disease (6). Given that hypoglycemia has been shown to be associated with increased cardiovascular events (7–11), it has been suggested that the cardio-protective effects from tight control may have been partly offset by higher hypoglycemia rates (12, 13). Alternatively, factors associated with persistently elevated hemoglobin A1c (HbA1c) despite intensive treatment may be associated with increased mortality risk (14). Current clinical practice guidelines recommend less stringent targets are chosen for those high hypoglycemia risk (15). Observational studies have shown that hypoglycemia, cardiovascular disease and mortality rates in diabetes patients increases sharply with advancing age (16), thus overtreatment in the elderly has become an important concern in ambulatory care (17).
Because RCTs have narrowly selected trial participants with high vascular risk (previous cardiovascular event or multiple vascular risk factors), it remains unclear to what extent RCT findings suggesting adverse effects of intensive glycemic control can be generalized to all diabetes patients in general practice. Little is known whether hypoglycemia brought to medical attention is a risk factor for CAD among primary care patients with low vascular risk. Because hypoglycemia generally occurs more frequently in patients with comorbidities (13, 18, 19), the degree to which hypoglycemia in primary care portends coronary artery disease (CAD) independently of other risk factors has not been well established. Here, we tested the hypothesis that previous hypoglycemia was an independent risk factor for incident CAD among diabetes patients from a large primary care practice network. We then sought to determine whether this association was stronger among older patients with multiple vascular risk factors.
Materials and Methods
Data source and study sample
The study sample included patients seen within a large academic primary care network affiliated with Massachusetts General Hospital (20). Patients were eligible if they received primary care within the network between January 1, 2000 and January 1, 2006, had a diabetes diagnosis (type 1 or type 2) before January 1, 2006, and had 1 or more visits after January 1, 2006. Details of the diabetes algorithm and validation (sensitivity 0.99, specificity 0.93, positive predictive value [PPV] 0.96, and negative predictive value 0.99) (21) are provided in Supplemental Table 1. Data to identify hypoglycemia, CAD, and other covariates were obtained from an electronic health record (EHR) repository that included Massachusetts General Hospital outpatient, emergency department (ED) and inpatient visits (22). The Partners HealthCare institutional review board approved the study.
Hypoglycemia
A hypoglycemic event was defined as hypoglycemia brought to medical attention. We used an International Classification of Diseases Ninth Revision (ICD-9) code-based algorithm that was validated previously in EDs to identify hypoglycemia (PPV 0.89) (23). This algorithm included hypoglycemia diagnostic codes 251.0, 251.1, 251.2, and 250.8 (diabetes with other manifestations) in the absence of the codiagnoses described in Supplemental Table 1. To test the performance of this algorithm in the primary care setting, we conducted an internal validation on 40 randomly selected patients with algorithm-identified hypoglycemic episodes in 2003–2005 and demonstrated reasonable concordance with manual review of physicians' notes for hypoglycemia, ie, description of the event that may include an account of hypoglycemic symptoms or low blood glucose levels (PPV 0.8). We opted to use the ICD-9 code-based algorithm as events were inconsistently documented in physicians' notes. Patients with 1 or more hypoglycemic events in 2000–2005 were considered exposed. Patients without a reported hypoglycemic event before January 1, 2006 were considered unexposed. Only 62 (0.7%) had 2 or more hypoglycemic episodes, of which 9 developed incident CAD during follow-up. Given this small sample size of recurrent events, we could not explore cumulative effects of hypoglycemic events on incident CAD, and considered follow-up time from the initial reported event.
CAD incidence
Diagnosis of CAD was determined using a previously validated CAD algorithm (sensitivity 96%, specificity 99%, PPV 99%, negative predictive value 95%) that included procedure codes for CAD-related interventions (eg, coronary artery bypass surgery, percutaneous transluminal coronary angioplasty, coronary stent) or physician problem list terms (eg, ischemic heart disease, myocardial infarction, coronary arteriosclerosis, angina pectoris; details in Supplemental Table 1). Because cerebrovascular disease, peripheral vascular disease, and CAD may not share the same causal pathways, we did not combine them to generate a composite cardiovascular endpoint. We excluded patients with a diagnosis of CAD before January 1, 2006 and followed the rest until the earliest of incident CAD diagnosis, last clinic visit, death, or June 30, 2012.
Sociodemographic and other clinical characteristics
Sociodemographic variables included age at baseline, self-reported race/ethnicity (non-Hispanic white vs other ethnicity), educational attainment (< high school vs ≥ high school diploma) and sex. Clinical characteristics included hypertension, dyslipidemia, cerebrovascular disease, peripheral arterial disease, dysrhythmias, cancer, dementia, and microvascular complications (retinopathy, neuropathy, and renal failure) were identified via problem list and ICD-9 code-based algorithms applied in 2000–2005. Body mass index (BMI) was calculated from height and weight recorded closest to January 1, 2006. Weight loss within a year was defined as the difference in weight measured closest to January 1, 2006 and 1 year before; in patients with multiple measurements in the previous year, we chose the value furthest from January 1, 2006. HbA1c, estimated glomerular filtration rate (eGFR), low-density lipoprotein (LDL) cholesterol, and high-density lipoprotein (HDL) cholesterol were obtained within 1 year from January 1, 2006; in patients with multiple measurements, we selected the values closest to January 1, 2006. Diabetes duration was calculated from diagnosis date to January 1, 2006. Hospitalization was defined as 1 or more hospitalizations in 2004–2005. The average number of HbA1c measurements per year (≥2 vs <2) was used as a measure of adequate physician-directed assessment of glycemic control.
Because comorbid conditions were more common in diabetes patients across all age groups (24), we counted the number chronic medication exposures, defined as 1 or more prescriptions for medications administered for chronic diseases (eg, asthma/chronic obstructive pulmonary disease, benign prostate hyperplasia, HIV infection, hormone replacement therapy, neurological and psychiatric conditions, thyroid disease, cardiovascular disease, hypertension, and dyslipidemia), between January 1, 2000 and December 31, 2005. We further classified antidiabetic agents in classes: sulfonylureas, biguanides, metiglinides, thiazolidinediones, acarbose, incretin-based agents, and insulin. We defined “polypharmacy” as exposure to 3 or more classes of noninsulin antidiabetic agents, indicating suboptimal or challenging glycemic control with multiple agents, or reluctance toward progression to insulin (25, 26). Total medication count was used as a surrogate measure of “medication complexity” (27).
Statistical analysis
We constructed 3 Cox models for incident CAD. The first was a univariable hypoglycemia model; the second was a CAD risk factor-adjusted model (primary hypothesis) that included socio-demographic characteristics (sex, age and educational attainment) and CAD risk factors commonly assessed in practice (dyslipidemia, hypertension, BMI, diabetes duration and HbA1c). The third was a fully adjusted model that additionally included insulin, sulfonylureas, 3 or more noninsulin antidiabetic agents, total chronic medication count, retinopathy, neuropathy and renal failure, eGFR, LDL, HDL, cancer, dementia, dysrhythmias, hospitalizations, weight loss within a year, and HbA1c measurements per year.
Given that a hypoglycemic event could be associated with factors that only temporarily affect CAD risk, associations might have degraded over time. We thus modeled hypoglycemia as a time-varying covariate using the STATA option “tvc” in Cox regression, which tested the proportional hazard assumption and accounted for time interaction. The time-varying covariate improved model fit (likelihood ratio test, P = .04) and so remained in all models. We calculated the association within the first year, the first 2 years and the first 3 years, accounting for time interaction using linear combinations of coefficients postestimation. Multivariable Cox models were performed on the entire dataset with multiple imputation of missing values (28) (Supplemental Table 2). Statistical significance was set at P ≤ .05. Algorithms were applied in the EHR repository using SAS 9.3 (SAS Institute); statistical analyses were performed with STATA 13 (StataCorp).
Sensitivity analysis
Given that we accrued hypoglycemic events before the start of the observation period, time interactions might have been exaggerated. Conversely, excluding patients with CAD before January 1, 2006 removed patients with hypoglycemia who rapidly developed CAD before January 1, 2006 which might have attenuate time interactions. We thus conducted 2 sensitivity analyses. In the first, we excluded individuals with a CAD diagnosis before January 1, 2000 and followed all remaining patients from either their first reported hypoglycemic event occurring between January 1, 2000 and December 31, 2005, or from January 1, 2000, for those who did not report a hypoglycemic event, until their earliest CAD diagnosis. In the second, we included all hypoglycemic events that occurred within the study period (January 1, 2000 to June 30, 2011), and followed them from the actual date of the hypoglycemic event to the earliest CAD diagnosis or the end of the study period. For those without hypoglycemia, we followed them from January 1, 2000.
Subgroup analyses
We stratified the cohort according to vascular risk. High vascular risk patients were selected according to the ACCORD trial inclusion criteria: age 55 years or older, HbA1c 7.5% or greater and 2 or more CAD risk factors: dyslipidemia, hypertension, or BMI 30 kg/m2 or greater; we imputed sample means when values were missing. Patients who did not meet these criteria were considered low vascular risk. We then age-stratified the high vascular risk group to generate an older (age 65 years or older), high vascular risk subgroup. Nelson-Aalen cumulative hazard estimates were plotted over the follow-up period to visually display differences in the rates of incident CAD by hypoglycemia status for the entire cohort and each subgroup. To determine whether the association varied in patients with different vascular risk, we repeated the Cox analyses within each stratum with multiple imputation of missing values.
Results
Baseline characteristics (Table 1)
Baseline Characteristics Stratified by Hypoglycemia
| Baseline Characteristics | No Hypoglycemia (n = 8888) | Hypoglycemia (n = 285) | P Value | ||
|---|---|---|---|---|---|
| Age (y), median/mean (SD) | 60.63/60.67 | (14.30) | 59.40/58.76 | (15.50) | .03 |
| Women, n (%) | 4565 | (51.36) | 170 | (59.65) | .01 |
| Non-White race/ethnicity, n (%) | 2605 | (29.55) | 102 | (35.92) | .02 |
| < High school education, n (%) | 1267 | (18.52) | 39 | (18.84) | .91 |
| Diabetes duration, median/mean years (SD) | 3.70/3.30 | (1.82) | 4.57/3.94 | (1.60) | <.001 |
| Hypertension, n (%) | 5030 | (56.59) | 144 | (50.53) | .04 |
| Dyslipidemia, n (%) | 5557 | (62.52) | 157 | (55.09) | .01 |
| Microvascular disease, n (%) | 1583 | (17.81) | 133 | (46.67) | <.001 |
| Renal failure, n (%) | 452 | (5.09) | 49 | (15.79) | <.001 |
| Neuropathy, n (%) | 1221 | (13.74) | 106 | (37.19) | <.001 |
| Retinopathy, n (%) | 440 | (4.95) | 61 | (21.40) | <.001 |
| Dysrhythmia, n (%) | 1541 | (17.34) | 63 | (22.11) | .04 |
| Cerebrovascular disease, n (%) | 371 | (4.17) | 15 | (5.26) | .37 |
| Peripheral vascular disease, n (%) | 317 | (3.57) | 11 | (3.86) | .79 |
| Cancer, n (%) | 459 | (5.16) | 22 | (7.72) | .06 |
| Dementia, n (%) | 370 | (4.16) | 15 | (5.26) | .36 |
| Insulin, n (%) | 2361 | (26.56) | 166 | (58.25) | <.001 |
| Sulfonylurea, n (%) | 2979 | (33.52) | 94 | (32.98) | .85 |
| ≥3 noninsulin antidiabetic agents, n (%) | 593 | (6.67) | 24 | (8.42) | .25 |
| Medication count, median/mean (SD) | 6.00/7.24 | (6.24) | 8.00/9.59 | (7.81) | <.001 |
| BMI (kg/m2), median/mean (SD) | 30.61/31.82 | (7.51) | 28.58/30.39 | (7.89) | .004 |
| eGFR (mL/min per 1.73 m2), median/mean (SD) | 74.69/74.25 | (24.33) | 71.98/69.62 | (27.32) | .002 |
| LDL (mg/dL), median/mean (SD) | 88.00/92.06 | (33.52) | 78.00/83.20 | (31.35) | <.001 |
| HDL (mg/dL), median/mean (SD) | 49.00/51.29 | (15.77) | 53.00/57.44 | (20.08) | <.001 |
| HbA1c (%), median/mean (SD) | 7.20/7.66 | (1.62) | 7.50/7.95 | (1.89) | .01 |
| Hospitalization, n (%) | 1691 | (19.03) | 85 | (29.82) | <.001 |
| ≥5% weight loss within a year | 494 | (10.21) | 21 | (11.89) | .476 |
| ≥2 HbA1c measurements/year, n (%) | 4573 | (52.22) | 182 | (64.08) | <.001 |
Hypoglycemia, hypoglyemic event between 2000 and 2005, inclusive. Baseline comorbidities were identified between 2000 and 2005, inclusive. Medication exposures were defined as any physician prescription between 2000 and 2005, inclusive. Medication count: total number of chronic medication exposures between 2000 and 2005, inclusive. Three or more noninsulin antidiabetic agents: exposure to 3 or more classes of noninsulin antidiabetic agents between 2000 and 2005, inclusive. Two or more HbA1c measurements per year hospitalization: 1 or more hospitalizations in 2004–2005. Two or more HbA1c measurements/year: 2 or more HbA1c measurements per year, on average, after diabetes diagnosis. Proportion of missing values was less than 25% for any single variable, except more than 5% weight loss within a year where 45% of values were missing (Supplemental Table 2).
Of the 11 140 diabetes patients in our primary care network as of January 1, 2006, 9137 did not have existing CAD, and composed the study cohort. Three percent (n = 285) had hypoglycemia at baseline. Those with hypoglycemia compared with those without, had more microvascular complications, dysrhythmias and exposure to insulin, hospitalizations, longer diabetes duration, higher medication count, higher HDL and lower LDL, lower eGFR (29), and lower BMI. During the follow-up period, 1098 (12.0%) developed CAD. Among those who did not develop CAD, 1342 (14.6%) died, and 1349 (14.7%) left the network. Death during follow-up was more common among those with hypoglycemia (66 [23.2%]) compared with those without (1280 [14.4%]). The mean follow-up time was 5.2 (SD 2.0) years (Supplemental Table 3).
Hypoglycemia and incident CAD (Table 2)
Association Between Hypoglycemia and Incident CAD With Time Interaction in the Entire Cohort and Subgroups of Different Vascular Risk
| Hypoglycemia, n (%) | Entire Cohort (n = 9173) | Low Vascular Risk (n = 7350) | High Vascular Risk (n = 1823) | Age ≥65 Years and High Risk (n = 996) | ||||||||
|---|---|---|---|---|---|---|---|---|---|---|---|---|
| 285 (3.11) | 230 (3.13) | 55 (3.02) | 38 (3.82) | |||||||||
| HR | 95%CI | P Value | HR | 95%CI | P Value | HR | 95%CI | P Value | HR | 95%CI | P Value | |
| Hypoglycemia (univariable model) | ||||||||||||
| Main effect | 1.90 | (1.09–3.31) | .023 | 1.61 | (0.82–3.18) | .168 | 2.86 | (1.09–7.50) | .033 | 4.27 | (1.53–11.86) | .003 |
| TVC | 0.83 | (0.69–0.99) | .044 | 0.85 | (0.68–1.05) | .133 | 0.81 | (0.58–1.13) | .210 | 0.73 | (0.48–1.11) | .140 |
| 1 year | 1.58 | (1.03–2.42) | .034 | 1.37 | (0.81–2.31) | .235 | 2.31 | (1.11–4.79) | .024 | 3.13 | (1.48–6.61) | .003 |
| 2 years | 1.31 | (0.94–1.85) | .115 | 1.17 | (0.77–1.77) | .469 | 1.87 | (1.04–3.38) | .037 | 2.29 | (1.20–4.37) | .012 |
| 3 years | 1.09 | (0.78–1.54) | .609 | 0.99 | (0.66–1.49) | .970 | 1.52 | (0.82–2.82) | .186 | 1.68 | (0.77–3.68) | .197 |
| Hypoglycemia (CAD risk factor adjusted multivariable model) | ||||||||||||
| Main effect | 2.15 | (1.24–3.74) | .007 | 1.90 | (0.97–3.75) | .063 | 3.01 | (1.15–7.91) | .025 | 4.62 | (1.65–12.90) | .004 |
| TVC | 0.84 | (0.71–1.01) | .061 | 0.86 | (0.69–1.06) | .159 | 0.81 | (0.57–1.13) | .136 | 0.75 | (0.50–1.13) | .173 |
| 1 year | 1.82 | (1.19–2.78) | .006 | 1.63 | (0.97–2.75) | .066 | 2.46 | (1.18–5.10) | .016 | 3.46 | (1.63–7.37) | .001 |
| 2 years | 1.53 | (1.09–2.16) | .014 | 1.40 | (0.92–2.13) | .115 | 2.00 | (1.11–3.62) | .022 | 2.60 | (1.35–4.99) | .004 |
| 3 years | 1.29 | (0.92–1.82) | .142 | 1.20 | (0.80–1.81) | .384 | 1.63 | (0.88–3.03) | .122 | 1.95 | (0.88–4.30) | .099 |
| Hypoglycemia (fully adjusted multivariable model) | ||||||||||||
| Main effect | 1.65 | (0.95–2.87) | .078 | 1.37 | (0.69–2.72) | .365 | 2.32 | (0.88–6.09) | .089 | 3.37 | (1.19–9.57) | .022 |
| TVC | 0.84 | (0.70–1.01) | .057 | 0.85 | (0.69–1.06) | .143 | 0.83 | (0.60–1.15) | .268 | 0.79 | (0.53–1.19) | .255 |
| 1 year | 1.39 | (0.90–2.13) | .134 | 1.17 | (0.69–1.99) | .562 | 1.93 | (0.92–4.04) | .082 | 2.67 | (1.22–5.82) | .014 |
| 2 years | 1.17 | (0.82–1.65) | .382 | 0.97 | (0.65–1.53) | .989 | 1.60 | (0.88–2.94) | .126 | 2.10 | (1.07–4.15) | .032 |
| 3 years | 0.98 | (0.69–1.39) | .922 | 0.85 | (0.56–1.30) | .450 | 1.34 | (0.71–2.51) | .369 | 1.80 | (0.80–4.01) | .153 |
TVC, time varying covariate, time interaction with hypoglycemia. Main effect: effect estimate of hypoglycemia after accounting for time interaction; 1, 2, and 3 years: we calculated the hypoglycemia effect estimates for the first year, the first 2 years, and the first 3 years using linear combinations of coefficients postestimation; CAD risk factor adjusted model: model adjusted for age, sex, race/ethnicity, education attainment, BMI, HbA1c, dyslipidemia, and hypertension; fully adjusted model: model included covariates in CAD risk factor adjusted model and additionally adjusted for insulin use, sulfonylurea use, microvascular complications, total chronic medication count, exposure to 3 or more classes of antidiabetic agents, HDL, LDL, eGFR, and 2 or more HbA1c measurements per year; high vascular risk: age 55 years or older and HbA1c 7.5% and greater and 2 or more CAD risk factors: BMI 30 kg/m2 or greater, hypertension, or dyslipidemia. Age 65 years or older and high risk: subset of high vascular risk patients aged 65 years or older; low vascular risk: patients who did not meet criteria for high vascular risk.
Hypoglycemia was associated with almost a 2-fold increase in incident CAD risk (hazard ratio [HR] 1.90; 95% confidence interval [95%CI] 1.09–3.31; P = .02, accounting for time interaction) (Figure 1). The negative association (P = .04) between the time-varying covariate and CAD risk implied that the association between hypoglycemia and CAD risk diminished over time (ie, departure from proportional hazards). The association between hypoglycemia and CAD remained after adjusting for socio-demographic characteristics, hypertension, dyslipidemia, diabetes duration, BMI, and HbA1c (HR [95%CI] 2.15 [1.24–3.74]; P = .01). Further adjustment for microvascular complications, comorbidities and medication exposures diminished the association. Sensitivity analyses resulted in similar estimates (first sensitivity analysis, time-to-event from date of hypoglycemic event, HR 2.46 [95%CI 1.63–3.70], P < .001, time interaction P = .02; second sensitivity analysis that included all hypoglycemic events including those after January 1, 2006, HR 1.92 [95%CI 1.36–2.71], P < .001, time interaction P = .06) (Supplemental Table 4).
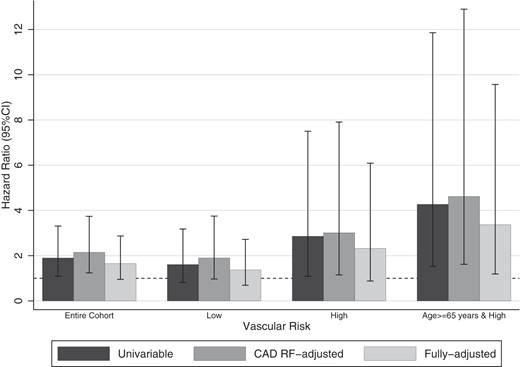
Hazard ratios of hypoglycemia on incident CAD in the entire cohort and in different vascular risk groups. The univariable model included hypoglycemia and a time varying covariate. The CAD risk factor (CAD RF)-adjusted model additionally included age, sex, race/ethnicity, educational attainment, hypertension, dyslipidemia, diabetes duration, BMI, and HbA1c. The fully adjusted model additionally adjusted for LDL, HDL, eGFR, retinopathy, neuropathy and renal failure, cancer, dementia, dysrhythmias, insulin, and sulfonylurea exposure, 3 or more classes of antidiabetic agents, chronic medication count, more than or equal to 5% weight loss within a year, hospitalizations, and 2 or more HbA1c measurements per year.
Subgroup analysis
The proportion of high vascular risk patients (16.8%) who developed CAD was higher than low vascular risk patients (10.8%) (Supplemental Table 3). Patients with hypoglycemia had higher cumulative hazard estimates than those without hypoglycemia (Figure 2), although the difference was only statistically significant in the older, high vascular risk group (Log rank test, P = .02). Accounting for time interaction and CAD risk factors, the association between hypoglycemia was associated with a 3-fold incident CAD risk. An even stronger association was observed among high vascular risk patients aged 65 years or older.
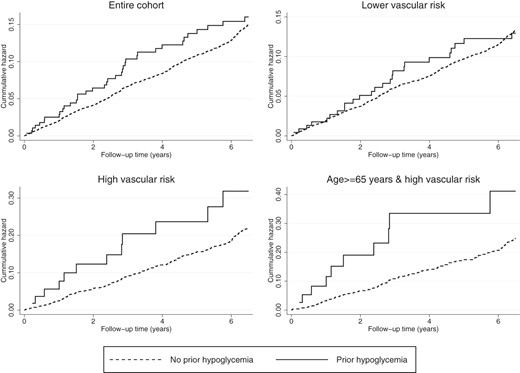
Cumulative hazard estimates of hypoglycemia on incident CAD in the entire cohort and in different vascular risk groups. Log rank test was statistically significant for patients age 65 years or older, high vascular risk subgroup (P = .022). Log rank tests were not statistically significant for the entire cohort, P = .450, low vascular risk group, P = .928, and high vascular risk group, P = .095.
In the low risk subgroup, after accounting for time interaction and CAD risk factors, the association between hypoglycemia and incident CAD was not significant. From the fully adjusted model in Supplemental Table 5, predictors of incident CAD included HbA1c (per percent, HR 1.13 [95% CI 1.08–1.19], P < .001), eGFR (per mL/min, HR 0.99 [95%CI 0.99–1.00], P = .001), retinopathy (HR 1.54 [95%CI 1.15–2.04], P = .003), dyslipidemia (HR 1.24 [95%CI 1.06–1.46], P = .008), and chronic medication count (per medication, HR 1.03 95%CI [1.02–1.05], P < .001).
In exploratory subgroup analyses, we tested the association between hypoglycemia and incident CAD in patients stratified by baseline HbA1c. The association was significant among patients with HbA1c 8% or greater in the CAD risk factor adjusted model (HR 2.64 [95%CI 1.07–6.49], P = .034, n = 2543) (Supplemental Table 6A). We then examined the association between hypoglycemia and incident CAD among patients on insulin monotherapy (n = 973) (Supplemental Table 6B), and among patients on both insulin therapy and other antidiabetic agents (n = 1554). We did not find an association in either subgroups (Supplemental Table 6C).
Discussion
We examined a large longitudinal cohort of primary care diabetes patients and demonstrated that previous hypoglycemia was associated with a 2-fold risk increase in incident CAD. The association persisted with adjustment for CAD risk factors but attenuated over the follow-up period. The risk was 3-fold among patients with multiple CAD risk factors (age ≥ 55, HbA1c ≥ 7.5%, obesity, dyslipidemia, or hypertension) and 4-fold in the subset of high vascular risk patients aged 65 years or older. Four out of 5 primary care diabetes patients had low vascular risk, which would have prevented them from meeting the eligibility criteria for ACCORD. In these patients, the association between hypoglycemia and incident CAD was less compelling.
Generally, only high vascular risk patients were eligible for large RCTs on intensive vs conventional therapy. ACCORD (n = 10 108) recruited patients with suboptimal glycemic control (HbA1c ≥ 7.5% and ≥ 2 cardiovascular risk factors or existing cardiovascular disease. The Action in Diabetes and Vascular Disease: Preterax and Diamicron Modified Release Controlled Evaluation trial; n = 11 140) enrolled patients with 1 or more cardiovascular risk factors, or existing macro- or microvascular disease. The Outcome Reduction With Initial Glargine Intervention trial (n = 12 537) recruited patients with previous cardiovascular events, atherosclerosis or cardiovascular risk factors. The Veterans Affairs Diabetes Trial (n = 1791) recruited patients with suboptimal glycemic control despite use of multiple oral agents and/or insulin therapy. Findings from these trials are mostly generalizable to those with high vascular risk and not necessarily all patients in primary care.
The incident CAD rate was higher in the subset of high vascular risk patients aged 65 years or older. Huang et al (16) examined older diabetes patients followed in primary care (≥60 y, n = 72 310) and reported that hypoglycemia, retinopathy, and cardiovascular disease were the most common complications among older patients. It has also been observed that, in the elderly (≥80 y), insulin-related hypoglycemia was more likely to result in ED visits and hospitalizations (30). Lipska et al (31) studied Medicare beneficiaries aged 65 years or older (n = 33 952 331) and showed that admission rates for hypoglycemia had risen between 1999 and 2011. In ACCORD, although older participants had more hypoglycemia than younger participants, intensive therapy was only associated with increased cardiovascular mortality among younger participants (32). Conversely, in our study, hypoglycemia was associated with incident CAD mainly among older, high vascular risk patients, indicating that hypoglycemia may be a marker of CAD risk in this subpopulation.
We noted that those with hypoglycemia compared with those without, had more microvascular complications, exposure to insulin, hospitalizations, longer diabetes duration and lower eGFR. This suggested that patient-related factors, rather than the hypoglycemic episodes themselves, may be mediators in the hypoglycemia-CAD relationship (13, 18). Indeed, adjusting for comorbidities and medication exposures weakened the association between hypoglycemia and incident CAD. Likewise, unmeasured factors that influence physicians to initiate insulin or use multiple antidiabetic agents (eg, poor renal function and inadequate control), may be associated with both hypoglycemia and CAD. We observed a slightly greater HR for incident CAD associated with hypoglycemia among patients with HbA1c 8.0% or greater, after controlling for CAD risk factors. In ACCORD, the HR for death associated with hypoglycemia was higher in those conventionally treated compared with those intensely treated (33). It is possible that certain factors, eg, inherent glycemic instability, associated with persistently high on-treatment HbA1c, are also associated with both hypoglycemia and increased CAD risk. Although frailty has been shown to be associated with both hypoglycemia (19) and CAD (34), we could not adjust for frailty indicators, unintentional weight loss, exhaustion, weakness, slow walking speed and decreased physical activity (35), as they were not collected in EHR. We adjusted our estimates for clinically significant weight loss although, in this population, weight loss was likely intentional. Nevertheless, patients with hypoglycemia had more comorbidities, hospitalizations, higher medication count, lower BMI, and a larger proportion died during follow-up, suggesting that some of these patients were frailer.
Our results indicated that the association between hypoglycemia and incident CAD did not extend beyond 2–3 years of follow-up. We postulate several reasons for the vanishing association. Hypoglycemia may temporarily trigger pathophysiologic processes, eg, vasoconstriction, hypercoagulability, inflammation and the sympathetic-adrenal response which increase cardiac workload, abnormal repolarization, and arrhythmias; these may in turn raise short-term CAD risk, especially in those with preexisting endothelial dysfunction from diabetes or cardiac autonomic neuropathy (36, 37). Alternatively, previous hypoglycemic events may portend frequent unrecognized episodes which do not raise CAD risk in the long-term (38). The diminishing association may also be explained by changing patient-related factors. Patients who do not typically enroll in clinical trials because of limited self-care capabilities or treatment nonadherence were included in this observational study. Some of these patients might have begun taking more ownership in self-directed care after a life-threatening hypoglycemic episode which would have reduced their CAD risk over time. Similarly, lapses in care that impacted both hypoglycemia and CAD risk (eg, glycemic lability during dose adjustments or gaps in follow-up) might have been addressed after a hypoglycemic event. Documentation of CAD in EHR might have been more thorough immediately after a hypoglycemic event. Finally, key clinical outcomes might not be more rigorous ascertained or documented in RCTs than in routine clinical practice, eg, cause of death was not systematically recorded in EHR.
Compared with patients on both insulin therapy and other antidiabetic agents, patients on insulin monotherapy had slightly lower BMI, and a higher proportion of microvascular disease; characteristics of these patients resembled those of middle-aged adults with type 1 diabetes (39). The proportion of hypoglycemia was higher among those on insulin (insulin monotherapy, 8.9%; both insulin therapy and other antidiabetic agents, 5.1%) compared with those not on insulin (1.8%). These results were comparable with findings from a population-based study by Leese et al (40) where incidence of severe hypoglycemia was approximately 7% in both type 1 and type 2 diabetes patients on insulin therapy over a 12-month period. A systematic review of 11 survey-based observational studies found that the incidence of patient-reported hypoglycemia over the preceding 6–12 months ranged from 1% to 17% (13). A pooled analysis of RCTs showed that severe hypoglycemia over the trial duration (2–10 years) occurred in 7.6% of those intensely treated and 3.0% of those conventionally treated (13).
This study has important strengths. Our practice-based network delivers a broad range of health services, including primary, specialty and acute care, to patients representing the entire spectrum of age, vascular risk and diabetes severity, enabling us to thoroughly examine a diabetes cohort that is representative of “real world” clinical practice. Having accrued comprehensive clinical data for more than 6 years through linkage of EMR from multiple health services, we were able to perform longitudinal analyses and examine time-dependent effects while accounting for multiple socio-demographic and clinical characteristics. Multiple imputation techniques were employed to reduce bias associated with missing data. We were also well positioned to explore potential heterogeneous effects of hypoglycemia on incident CAD in subgroups of different vascular risk. Although this study did not examine whether efforts at minimizing hypoglycemia risk reduced CAD incidence, our findings lent support to tailored treatment goals based on age and comorbidities, implying possible adverse effects after hypoglycemic events in older, high vascular risk patients but not low vascular risk patients.
We acknowledge several limitations. The hypoglycemia algorithm identified patients with hypoglycemia brought to medical attention, so missed episodes requiring external assistance in the community or healthcare facilities outside the network would be missed; this misclassification may have biased results toward the null. We could not distinguish type 1 and type 2 diabetes although the vast majority of diabetes in primary care was likely type 2. Because hypoglycemia ICD-9 codes do not allow specifications for glucose levels during the hypoglycemic event, we were also unable to distinguish severe and minor hypoglycemic events, where a dose-response relationship might have strengthened the findings. The Ademolus classification of hypoglycemia would have been a suitable method to classify severity of hypoglycemic events; however, this classification system, like the Whipple's triad, required glucose levels during hypoglycemic episodes, which were not systematically recorded in EHR (41). Given the small proportion of individuals with hypoglycemia, confidence intervals in subgroup analyses were wide, thus conclusions from secondary analyses are to be interpreted with caution. Because the CAD algorithm did not distinguish the various subtypes of acute coronary syndromes, we were unable to test whether the association with hypoglycemia differed by the severity of clinical presentation. Future research could characterize and compare the association of hypoglycemia with the entire spectrum of CAD presentation. Although we adjusted for a large number of potential confounders in our analyses, we could not adjust for confounders that were either unmeasured or inadequately ascertained in EHR, including duration of medication nonadherence and duration of exposures; nevertheless, we adjusted our estimates for the number of HbA1c measurements per year to account for adherence to overall care. We also lacked data on cause of death and so were unable to perform competing risks survival analyses. Because clinical information before a patient being registered in this network, diabetes duration may have been underestimated in some patients; our estimates may have been underadjusted for this variable. In creating vascular risk groups, we imputed the sample mean for HbA1c (7.7%) and BMI (31.8 kg/m2) when values were missing. This may have misclassified some low vascular risk patients as high risk. We also lacked information on smoking status; consequently, some smokers with high vascular risk may have been misclassified as low risk. These misclassifications likely reduced differences between vascular risk groups. Time interactions may have been inflated as hypoglycemic events occurred before the start of the observation time. Nonetheless, our sensitivity analyses that calculated time-to-event from the date of hypoglycemic event yielded similar effect estimates.
Our investigation based on EHR observational data was unable to address whether previous hypoglycemia was causally related to incident CAD; instead, our results indicated that previous hypoglycemia was a marker of elevated CAD risk, especially in older patients with high vascular risk. This relationship between hypoglycemia and incident CAD was at least partly mediated by patient-related factors. However, most primary care patients had low vascular risk where hypoglycemia was less of an indicator of CAD risk. Findings suggesting adverse effects of intensive control from RCTs that narrowly selected high vascular risk participants may not apply to most primary care patients, for which treatment intensification for glycemic control and attendant hypoglycemia risk might confer less CAD risk than supposed from a broad application of RCT results (2–5).
A hypoglycemic episode is a sentinel event warranting careful evaluation of diabetes treatment and cardiovascular risk factor modifications. Future research could aim at assessing whether aggressively improving overall cardiovascular health and close surveillance for atherosclerosis after a hypoglycemic event lowers CAD risk. Findings from our investigation support practice guidelines that recommend avoiding hypoglycemia in older diabetes patients with multiple comorbidities. This could be achieved through systematically assessing hypoglycemia risk, minimizing medication complexity and overtreatment, focusing on diabetes education, and adopting treatment goals that prioritize safety.
Acknowledgments
We thank Steven McDermott, RN, of Massachusetts General Hospital, for contributions toward the validation of administrative algorithms and classification of medications.
Author contributions: A.L. developed the study design, researched data, performed analysis, and drafted the manuscript; B.P. and W.H. performed analysis, contributed to study design, and assisted in drafting the article; and S.A.B., V.A.T., D.J.W., S.J.A., and J.B.M. contributed to study design, interpretation of data, and reviewed/edited all aspects of the manuscript (introduction, methods, results, and discussion). All authors approved of the final version of the manuscript.
A.L. is a Canadian Diabetes Association Postdoctoral Research fellow. J.B.M. is supported in part by the National Institute of Diabetes and Digestive and Kidney Diseases Grant K24 DK080140.
Disclosure Summary: The authors have nothing to disclose.
Abbreviations
- ACCORD
Action to Control Cardiovascular Risk in Diabetes
- BMI
body mass index
- CAD
coronary artery disease
- 95%CI
95% confidence interval
- ED
emergency department
- eGFR
estimated glomerular filtration rate
- EHR
electronic health record
- HbA1c
hemoglobin A1c
- HDL
high-density lipoprotein
- HR
hazard ratio
- ICD-9
International Classification of Diseases Ninth Revision
- LDL
low-density lipoprotein
- PPV
positive predictive value
- RCT
randomized controlled trial.
