


Abstract
In the experimental animal, inflammatory signals quench LH's feedforward drive of testosterone (T) secretion and appear to impair GnRH-LH output. The degree to which such suppressive effects operate in the human is not known.
To test the hypothesis that IL-2 impairs LH's feedforward drive on T and T's feedback inhibition of LH secretion in healthy men.
Mayo Center for Translational Science Activities.
A total of 35 healthy men, 17 young and 18 older.
Randomized prospective double-blind saline-controlled study of IL-2 infusion in 2 doses with concurrent 10-minute blood sampling for 24 hours.
Deconvolution analysis of LH and T secretion.
After saline injection, older compared with young men exhibited reduced LH feedforward drive on T secretion (P < .001), and decreased T feedback inhibition of LH secretion (P < .01). After IL-2 injection, LH's feedforward onto T secretion declined markedly especially in young subjects (P < .001). Concomitantly, IL-2 potentiated T's proportional feedback on LH secretion especially in older volunteers.
This investigation confirms combined feedforward and feedback deficits in older relative to young men given saline and demonstrates 1) joint mechanisms by which IL-2 enforces biochemical hypogonadism, viz, combined feedforward block and feedback amplification; and 2) unequal absolute inhibition of T and LH secretion by IL-2 in young and older men. These outcomes establish that the male gonadal axis is susceptible to dual-site suppression by a prototypic inflammatory mediator. Thus, we postulate that selected ILs might also enforce male hypogonadism in chronic systemic inflammation.
Systemic inflammation is accompanied by varying degrees of biochemical hypoandrogenemia and clinical hypogonadism in the male. Inflammatory stress may be induced by infection and sepsis, burns, trauma, protracted critical illness, rheumatoid arthritis (RA), systemic lupus erythematosus, HIV infection, metastatic neoplasms, inflammatory bowel disease, chronic kidney disease (CKD), poorly controlled diabetes mellitus (DM), as well as IL injections in patients requiring cancer immunotherapy (1–16). However, the precise extent to which specific inflammatory mediators per se are involved in acquired hypogonadism in clinical settings is unknown (10, 16, 17). The notion that inflammatory mediators suppress the male gonadal axis is an attractive hypothesis, inasmuch as 1) inflammation accompanies multiple disease states; 2) hypoandrogenemia often resolves as inflammatory activity declines; and 3) inflammatory agonists, like lipopolysaccharide, TNF-α, IL-6, CRH, and IL-2 inhibit testosterone (T) secretion by the Leydig cell in several experimental models, and may also suppress GnRH and/or LH secretion by the hypothalamopituitary unit (18–24). These effects, in principle, could be explained by attenuation of LH's feedforward drive on T secretion, and potentiation of T's feedback on LH secretion (25). To date, no clinical investigations have interrogated these complementary pathophysiological mechanisms in healthy individuals subjected to a defined inflammatory stress.
Aging, like several chronic disease states, in men and women is characterized by increased markers of inflammation (16). Concomitantly, older men manifest relative impairment of 1) (testis) T secretory responses to infused human chorionic gonadotropin and recombinant human (rh)LH, and 2) (pituitary) LH responses to experimental manipulation of negative feedback using antiestrogen, antiandrogen, T, or estradiol infusions. The exact causes of such gonadal-axis adaptations in older individuals are not established (26). Possible pathophysiologic bases for relative hypogonadism in normal aging men could thus include inhibitory effects of endogenous inflammatory agents. This idea has not been investigated clinically.
The present investigation was intended to test hypothesized actions of a distinct inflammatory agonist in mediating relative hypoandrogenism in men, and to examine possible age dependence of the proinflammatory mechanism(s). To this end, we employed a simplified experimental paradigm comprising: 1) injection of saline vs 2 escalating doses of IL-2 in healthy men in a prospectively randomized double-blind crossover design; 2) measurement of LH and T responses in blood sampled every 10 minutes over 24 hours (yielding 20 000 assay values); 3) deconvolution analysis to quantify pulsatile LH and T secretion (27, 28); 4) estimation of endogenous LH's feedforward drive of T secretion and endogenous T's feedback inhibition of LH secretion; and 5) comparison of the foregoing responses in 17 young and 18 older healthy individuals.
Materials and Methods
Overview and IL-2 source
The design was a prospectively randomized, double-blind placebo-controlled crossover study with the primary goal of evaluating the impact of experimental IL-2-induced inflammatory stress on LH and T secretion in young and older men. Subject number was powered at 90% to detect a 30% effect of IL over saline on T concentrations, after establishing IL-2 safety. Thus, IL-2 dose was not powered. Each subject underwent 2 overnight studies in the Mayo Center for Translational Science Activities. Volunteers received injections of saline and either 3 million U (n = 6 young, n = 6 older) or 6 million U (n = 11 young, n = 12 older) of rhIL-2 (29). The stepwise dosing was for safety testing. IL-2 was obtained as Aldesleukin from Novartis Pharmaceuticals, under an individual investigator-initiated new drug investigation number lodged with the United States Food and Drug Administration (FDA). To monitor LH and T secretion, blood was withdrawn every 10 minutes for 24 hours starting 2 hours before the injection.
Inclusion criteria
Inclusion criteria were healthy men ages 18–30 and 60–80 years recruited from Rochester, Olmsted County, MN, and surrounding catchment areas by flyers, radio, and newspaper ads and web-based advertisements. Volunteers provided witnessed, signed, informed, and Mayo Institutional Review Board (IRB)-approved consent, and underwent a screening history and physical examination to identify and exclude acute or chronic organ-level disease. Individuals had normal sexual function by history. Screening biochemical tests of liver, kidney, hematological, and metabolic disease were negative.
Exclusion criteria
Exclusions comprised individuals unable or unwilling to provide written informed consent secondary to cognitive decline, mental illness, institutionalization or imprisonment. Volunteers with a history of cardiovascular disease, abnormal electrocardiogram on screening, cancer, sleep apnea, chronic obstructive pulmonary disease, hematological dyscrasias, acute or chronic inflammatory conditions, renal insufficiency, hepatic failure, and chronic infections (eg, hepatitis or HIV) were also excluded. Subjects receiving systemic medications (either prescription or over the counter) were excluded with the exception of replacement thyroid hormone, laxatives, antacids, thiazide diuretics, ophthalmic solutions, or skin preparations. Other exclusions were recent use of glucocorticoids (3 mo), nonsteroidal antiinflammatory drugs (10 d), chronic drug or alcohol abuse, major psychiatric illness, prostate nodularity, screening PSA more than 4 ng/mL, hypogonadism (serum total T < 240 or bioavailable T < 100 ng/mL, LH > 10 IU/L or FSH > 20 IU/L), weight gain or loss (>2 kg/2 mo), or transmeridian travel (over 3 time zones) within last 10 days.
Detailed protocol
Volunteers were admitted to the Clinical Research Unit (CRU) at 4 pm for placement of bilateral forearm iv catheters. To limit possible nutritional confounds, a vegetarian or nonvegetarian standardized meal (8 kcal/kg of 50% carbohydrate, 20% protein, and 30% fat) was served at 5 pm, and again at 8 am, 12 pm, and 6 pm the next day. Subjects remained alcohol abstinent and caffeine free. Beginning at 6 pm, blood was sampled every 10 minutes for 24 hours (2.7 mL/sample) until 6 pm on day 2. At the outset, a single 1-mL archival serum sample was obtained for safety-monitoring purposes, and subjects were given 650 mg of acetaminophen orally once for antipyresis. Two hours later (8 pm), men received a single sc injection of saline or IL-2. The first 6 young and 6 older subjects received saline or 3 million U of IL-2 sc once, and the last 11 young and 12 older men received saline or 6 million U of IL-2 sc once in accordance with Mayo IRB and Data Safety and Monitoring Board (DSMB) and United States FDA-specified safety guidelines. Inpatient CRU sessions were scheduled at least 3 weeks but no more than 2 months apart.
Assays
Serum LH concentrations were assayed in duplicate using an automated 2-site monoclonal immunochemiluminescent assay with a sensitivity of 0.20 IU/L (First International Reference Preparation) and median inter- and intraassay coefficients of variation of 5.5% and 8.5%, respectively (30). No samples were undetectable. Cross-reactivity with FSH, TSH, free α- or free LH β-subunits is less than 0.1%. Total T concentrations were assayed in duplicate by robotics-automated chemiluminescence assay. Sensitivity was 20 ng/dL (0.69 nmol/L), and median intra- and interassay coefficients of variation were 5.2% and 8.3%, respectively. Correlation was R = 0.975 and slope 1.12 for linear regression on mass spectrometry. Other screening measures were made in the Mayo Clinical Laboratory, exactly as described (30).
Subject risks and protection
The risks of the iv sampling were stated as anemia, localized phlebitis, swelling, redness, or bruising. Reported risks for IL-2 included nausea, malaise, fever, and headache commonly and hypotension, oliguria, or capillary-leak syndrome rarely (8, 9, 31, 32). There was a possibility of an immune response in the form of blocking antibodies to IL-2 (29). Thus, requirements by the DSMB and FDA were initial safety testing of a lower IL-2 dose in 6 subjects in both age groups, starting hemoglobin (Hb) more than 13 g/dL, maintenance of archival serum, and follow-up complete blood count and liver enzymes 3–10 days after study visits. Safety data were reviewed by the FDA, DSMB, and Mayo IRB.
Deconvolution analysis
LH concentration time series were analyzed using a recently developed automated deconvolution method. Pulse detection was empirically validated using hypothalamo-pituitary sampling and simulated pulsatile time series (27, 28). Sensitivity and specificity both exceed 93%. The Matlab-based algorithm first detrends the data and normalizes concentrations to the unit interval [0, 1]. Second, the program creates multiple successively decremental potential pulse-onset time sets, each containing one fewer pulse by a smoothing process (a nonlinear adaptation of the heat-diffusion equation). Third, a maximum-likelihood expectation estimation method calculates all secretion and elimination parameters simultaneously conditional on each of the candidate pulse-time sets. Deconvolution parameters comprise basal secretion, secretory-burst mass (concentration units), mode (time delay in minimum to maximum value), and frequency (number of bursts per sampling duration, λ of Weibull distribution). Pulsatile secretion is the sum of secretory-burst mass, and total secretion the sum of basal and pulsatile secretion. The fast half-life of LH was represented as 18 minutes constituting 63% of the decay amplitude and the slow half-life as 90 minutes (33). Statistical model selection was performed using the Akaike information criterion (34).
T concentration time series were analyzed similarly using fast (1.4) and slow (27) T half-lives (ratio 0.63) estimated by pulsatile T injections earlier (35).
Statistics
Statistical analysis was by one-, two-, and three-way ANOVA with Tukey's test applied post hoc to test for saline vs IL-2 effects (primary outcome). Where pertinent, unpaired t tests were applied between age cohorts to test a secondary age hypothesis. A paired t test was employed within subject to compare saline and IL-2 dose effects. Analyses used the Matlab Statistical program. P < .05 was construed as statistically significant (36). Statistical power was 90% to detect a 30% difference in T concentrations between saline and IL-2 administration.
Results
Adverse events are summarized by age and saline vs IL-2 dose in Supplemental Table 1. Headache was reported in 2/35 control sessions and 3/35 IL-2 sessions. Mild flu-like symptoms were more common after IL-2 than saline, especially after high-dose IL-2. No serious adverse events occurred, and all 35 subjects completed both 24-hour 10-minute sampling sessions.
Table 1 summaries epidemiologic, clinical, and biochemical characteristics of the 35 volunteers. Six young and 6 older subjects received saline and low-dose IL-2 (3 million U), and an additional 11 young and 12 older men received saline and high dose IL-2 (6 million U). Principal baseline (pretreatment outpatient) characteristics (mean ±SD) were as follows for all young (n = 17) and all older (n = 18) individuals: age (y) 24 ± 2.8 and 64 ± 4.0, body mass index (kg/m2) 26 ± 2.9 and 30 ± 3.9 (P < .05), total T (ng/dL) 554 ± 126 and 439 ± 108 (P < .01), FSH (IU/L) 3.3 ± 1.6 and 9.5 ± 6.3 (P < .05), and sex-hormone binding globulin (nmol/L) 28 ± 9 and 38 ± 8 (P < .01). Weight, albumin, estrone, estradiol, IGF-1, insulin-like growth factor binding protein-3, and insulin also differed by age. Height, Hb, TSH, LH, and adiponectin did not.
Demographic Variables Before Randomization
| Young/Low (n = 6) | Young/High (n = 11) | Older/Low (n = 6) | Older/High (n = 12) | |||||
|---|---|---|---|---|---|---|---|---|
| Age (y) | 24 ± 2.3 | (24) | 24 ± 3.3 | (24) | 64 ± 3.9 | (62.5) | 64 ± 4.1 | (63) |
| Ht (cm) | 180 ± 8.8 | (183) | 179 ± 6.2 | (177) | 175 ± 6.8 | (176) | 175 ± 5.6 | (173) |
| Wt (kg) | 84 ± 14 | (78) | 80 ± 11 | (79) | 85 ± 12 | (84) | 92 ± 12 | (92) |
| BMI (kg/m2) | 26 ± 3.1 | (27) | 25 ± 2.8 | (25) | 27 ± 1.9 | (27) | 28 ± 3.9 | (31) |
| Hb (g/dL) | 14 ± 0.81 | (15) | 16 ± 0.73 | (16) | 14 ± 0.66 | (14) | 15 ± 0.87 | (15) |
| Albumin (g/dL) | 4.6 ± 0.22 | (4.6) | 4.8 ± 0.16 | (4.8) | 4.2 ± 0.28 | (4.3) | 4.2 ± 0.26 | (4.3) |
| TSH (mU/L) | 2.5 ± 0.89 | (2.4) | 2.1 ± 1.1 | (1.9) | 3.1 ± 1.4 | (2.7) | 2.8 ± 1.3 | (2.3) |
| FSH (U/L) | 3.2 ± 1.9 | (2.8) | 3.4 ± 1.6 | (3.0) | 7.3 ± 2.6 | (6.15) | 11 ± 2.7 | (8.2) |
| LH (U/L) | 4.4 ± 1.7 | (4.3) | 3.9 ± 2.2 | (3.8) | 4.30 ± 1.69 | (4.05) | 5.16 ± 3.48 | (3.55) |
| SHBG (nmol/L) | 28 ± 6.2 | (26) | 29 ± 12 | (25) | 37 ± 4.4 | (37) | 39 ± 12 | (39) |
| T screen (ng/dL) | 586 ± 101 | (588) | 523 ± 151 | (505) | 464 ± 121 | (464) | 414 ± 96 | (411) |
| Adiponectin (mg/mL) | 11 ± 4.0 | (12) | 8.8 ± 5.0 | (8.8) | 9.6 ± 5.4 | (8.16) | 11 ± 6.5 | (11) |
| E1 (pg/mL) | 23 ± 7.2 | (22) | 18 ± 8.6 | (16) | 27 ± 7.2 | (25) | 27 ± 6.3 | (28) |
| E2 (pg/mL) | 20 ± 3.3 | (19) | 12 ± 4.3 | (12) | 16 ± 4.5 | (14) | 18 ± 3.8 | (18) |
| IGF-1 (μg/L) | 192 ± 45 | (201) | 197 ± 26 | (201) | 121 ± 54 | (105) | 123 ± 28 | (120) |
| IGFBP-3 (mg/L) | 4.3 ± 1.1 | (4.3) | 4.4 ± 0.68 | (4.4) | 4.1 ± 1.2 | (3.8) | 3.8 ± 1.0 | (3.6) |
| Insulin (mU/L) | 29 ± 11 | (30) | 32 ± 21 | (28) | 40 ± 36 | (27) | 52 ± 38 | (42) |
Data are the mean ± SD (median). Low and high refer to subsequent randomization strata, low- or high-dose IL-2 vs saline injection. E1, estrone; E2, estradiol; IGFBP, insulin-like growth factor binding protein; SHBG, sex-hormone binding globulin.
T and LH concentrations were measured in samples collected every 10 minutes for 24 hours. Mean (±SEM) profiles are plotted for the 4 main randomization groups by age (young vs older) and by treatment (saline and combined IL-2 doses) in color in Figure 1, T at top, LH at bottom. To illustrate (uncombined) separate IL-2 dose effects, Supplemental Figure 1A shows all 6 T subgroups (saline, low IL-2, high IL-2 each by age group) over time. Supplemental Figure 1B gives same outcomes for LH. Two-way ANOVA of 24-hour mean T concentrations revealed that the low-dose IL-2 effect was not significantly different from that of saline in either young (P = .074) or older (P = .067) men. When T responses were viewed as decremental (saline minus IL-2) T concentrations, the high-dose IL-2 effect differed from that of saline in both young and older men; viz, 1) high-dose IL-2 compared with saline suppressed T concentrations (ng/dL [95% confidence interval]) by 106 (28–183) ng/dL (young, P = .012) and by 57 (37–76) ng/dL (older, P < .001) (age effect, P < .05); and 2) dose-pooled (3 and 6 million U combined) IL-2 compared with saline suppressed T concentrations by 93 (35–150) ng/dL (young, P = .0049) and 55 (36–76) ng/dL (older, P < .001) (age effect, P < .05). Twenty-four-hour T concentration decrements (IL-2 minus saline mean T concentrations) are shown for the 4 main groups in Figure 2, top. Trend analysis revealed a drop in T levels 5.8 ± 0.2 hours after sampling onset.

Top, Mean (±SEM) 24-hour T concentrations sampled every 10 minutes in healthy young (n = 17) and older (n = 18) men administered saline/placebo vs combined IL-2 (low and high) doses. Bottom, Same format for 24-hour LH data.
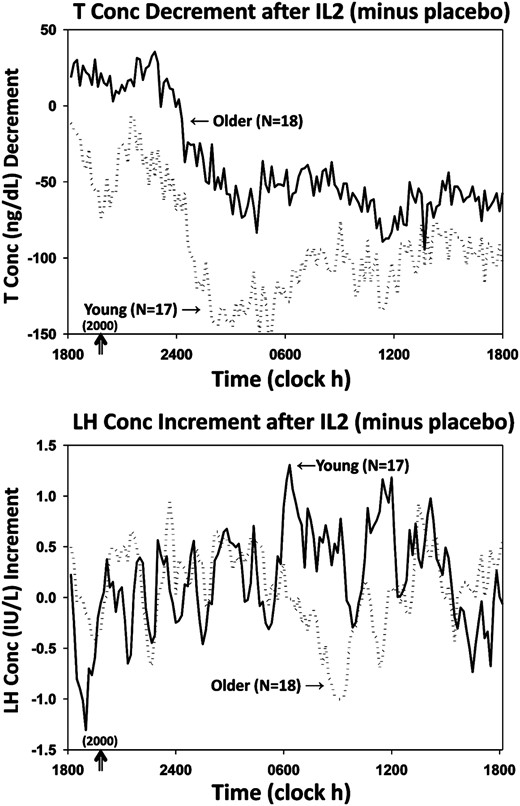
Mean algebraic differences between mean hormone concentrations after IL-2 vs saline. Top, T decrements. Bottom, LH increments. SEM's were les than 18% of means shown.
Interventional effects were next compared as absolute T concentrations attained (measured, ng/dL) by age, at any given IL-2 dose (none/saline, combined or individual low and high dose). Specifically, after saline, 24-hour mean (±SD) T concentrations were 514 ± 130 (young) and 375 ± 77 (older) (P < .001), and after combined doses of IL-2, 386 ± 129 (young) and 319 ± 72 (older) (P = .007). After low-dose IL-2, 24-hour T concentrations averaged 495 ± 150 (young) and 361 ± 80 (older) (P = .06), and after high-dose IL-2, 338 ± 110 (young) and 304 ± 56 (older) (P = .18). Thus, absolute full 24-hour mean T concentrations were higher in young than older men after saline injection but became similar by age after a low or high IL-2 dose.
Twenty-four-hour mean (±SEM) serum LH concentration time series are depicted in Figure 1, bottom, and in expanded views in Supplemental Figure 1B. In the combined doses, LH was higher in older than young men given saline (P < .05). There were no effects of IL-2 or age on full 24-hour LH concentration data. Mean 10-minute incremental LH concentrations (IL-2 minus saline) are shown in Figure 2, bottom, showing that LH levels rose at 6.1 ± 0.3 hours after sampling onset.
The mechanisms of IL-2's suppression of T were evaluated by deconvolution analysis of the last 18 (of 24) hours, when injected IL-2 was inhibitory (Figure 3 and Supplemental Table 2). During this 18-hour interval, serum T concentrations differed by both IL-2 exposure (P < .001) and by age. The main effect of IL-2 was inhibition of T secretory-burst mass (amount of T secreted per burst per unit distribution volume, ng/dL), which was significant in both young (P = .007) and older (P = .0001) men but greater in young men (P = .0001). This resulted in lower 18-hour pulsatile T secretion in both young (P = .006) and older (P = .0001) IL-2-treated men (age effect, P = .004). IL-2 had no effect on T secretory-burst mode (duration) but selectively suppressed T secretory-burst frequency in older men (P = .005) and basal (nonpulsatile) T secretion in young men (P < .004).
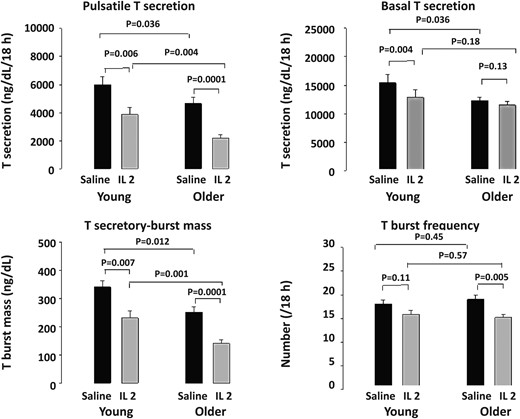
Deconvolution outcomes after saline and combined (low and high dose) IL-2 injections during the last 18 hours of 24 hours of sampling in 17 young and 18 older men. T secretory parameters were analyzed by ANOVA and with post hoc comparisons (see Materials and Methods).
Deconvolution analysis was also used to quantify pulsatile and basal LH secretion. After saline injection, basal (nonpulsatile) LH secretion was higher in older than young men (P < .01). This difference persisted after IL-2 injection (P < .005). There was no significant main effect of IL-2 on LH secretion. However, young men given high-dose IL-2 exhibited basal LH suppression, viz, 40 ± 5 (saline) vs 28 ± 5 (IL-2) IU/L/18 hours (P < .01) (Supplemental Table 3).
The mechanisms of IL-2's inhibition of T were further assessed using a surrogate dynamic measure of LH's feedforward on T secretion, viz, the T to LH concentration ratio. This defines the concentration of T attained normalized against (per unit) LH concentration. Figure 4, top, shows that median T to LH concentration ratios differed by age and changed markedly over time after saline and IL-2 injection. Statistical comparisons were thus applied to the 4 6-hour time blocks comprising 24 hours (Figure 5). ANOVA revealed strong individual (each P < .001) and interactive (joint P < .01) effects of time, age, and IL-2. Post hoc comparisons disclosed that 1) under saline, feedforward by LH on T was reduced (T to LH ratio was lower) in older compared with young men in all time segments (P < .01); 2) under saline, feedforward rose significantly in the daytime (6 am to 6 pm) in both age groups (P < .001 trend); and 3) combined IL-2 doses blunted feedforward in young (P < .01) and older (P < .05) men from midnight to 6 pm (P < .001 treatment effect), except 6 am to 12 pm in older men, when inhibition was nonsignificant in older men only (P < .001 vs young). Thus, estimated LH feedforward on T secretion is stronger in young than older men given saline and declines more in young than older men 6–24 hours after IL-2 exposure.
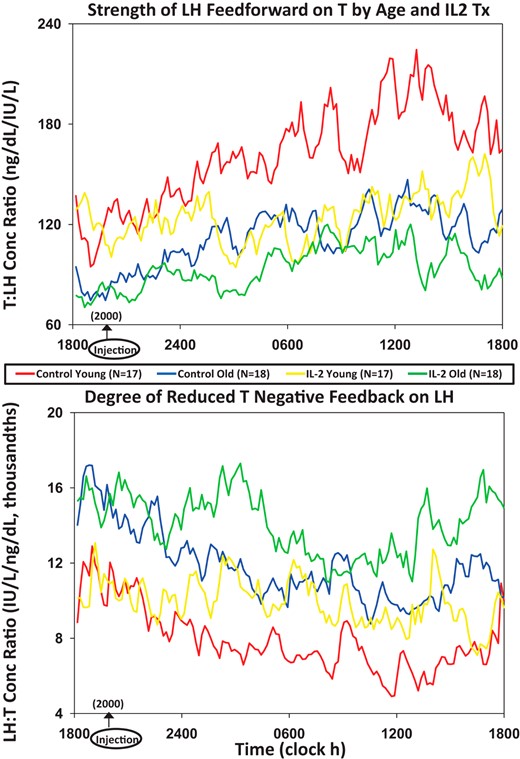
Median T to LH concentration ratios as a feedforward surrogate (top) and, conversely, median LH to T concentration ratios as a feedback surrogate (bottom). LH and T were monitored every 10 minutes over 24 hours in 17 young and 18 older men exposed to saline or combined (low and high) IL-2 doses.
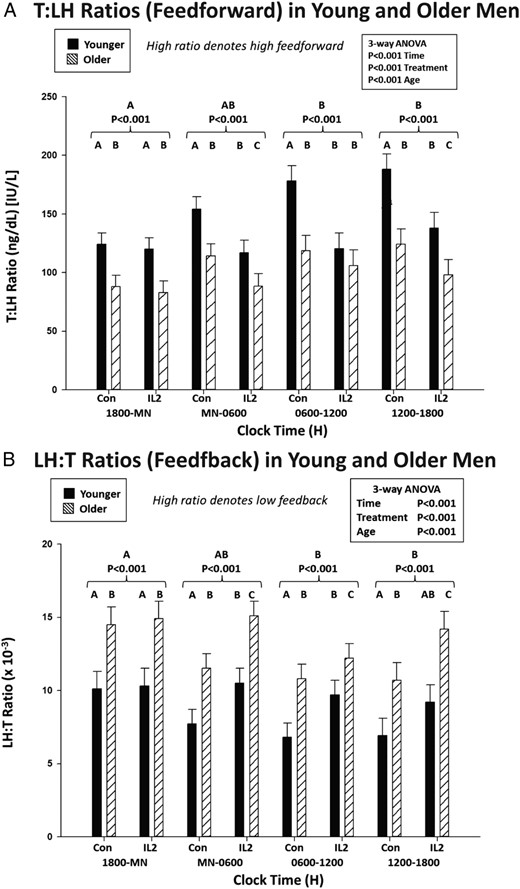
A, Estimation of the effects of saline vs IL-2 injection on LH's feedforward on T secretion using the T to LH concentration ratio assessed after saline/control vs combined IL-2 (low and high dose) injections by age group in 6-hour time windows. Data are the mean ± SEM. Three-way ANOVA effects are stated, viz, time, age, and treatment. Alphabetic letters define post hoc time differences across 24 hours (topmost) and within 6-hour windows (top). B, Estimates of T's feedback inhibition of LH secretion using LH to T concentration ratios, as otherwise described in A.
An indirect estimate of T's feedback on LH secretion was assessed next by way of the median LH to T concentration ratio (Figure 4, bottom). The LH to T ratio quantifies the concentration of LH normalized per unit of T concentration. A higher ratio signifies lower feedback by T on LH. After saline, the LH to T ratio was higher at all times in older compared with young men (P < .001 age effect), denoting less T feedback on LH (Figure 5). Both age groups showed a time effect, because under saline, the LH to T ratio fell significantly during midnight to 6 pm (P < .001), defining greater T feedback. When IL-2 was administered, estimated T feedback on LH increased (the LH to T ratio decreased) in older men (P < .01). This IL-2 effect was not observed in young men (age difference, P < .01).
Discussion
This was a prospectively randomized placebo-controlled within-subject crossover study in healthy young (median age, 24 y) and older (median age, 63 y) men exposed to saline vs rhIL-2 stress. Outcomes were monitored by 10-minute blood sampling over 24 hours to quantify pulsatile LH and T secretion, LH feedforward and T feedback. Thereby, we show that exposure to IL-2 reduces LH's feedforward drive of T secretion and augments T's feedback inhibition of LH secretion in healthy men. Although percentage suppression of T secretion was comparable by age (mean, 19%), the absolute decrement in total (pulsatile plus basal) T secretion (ng of T secreted per unit of distribution volume per 18 h) was greater in young than older individuals (P = .011). Additionally, the pathophysiological mechanisms of IL-2-induced hypoandrogenemia were not identical. In particular, although IL-2 significantly repressed LH's feedforward drive of pulsatile T secretion in both young and older men, it accentuated T's feedback restraint of LH secretion in older men only. Moreover, IL-2 administration selectively reduced basal (nonpulsatile) T secretion in young men and T secretory-burst frequency in older men. These outcomes demonstrate that even minimally symptomatic proinflammatory stress, such as IL-2 exposure at the present doses (here causing principally flu-like malaise), can enforce short-term hypoandrogenemia in otherwise healthy young and aging men by partially overlapping but nonidentical mechanisms.
Acute and chronic illnesses are accompanied by varying degrees of biochemical hypoandrogenemia (low T). In particular, short-term T depletion emerges in men in intensive care units (4), during fasting (37) or sepsis (1), burns (2), myocardial infarction (38), trauma (3), and critical illness (12). More prolonged T deprivation occurs in men with chronic RA (13, 13), systemic lupus erythematosis (14), metastatic cancer (39), HIV wasting syndrome (11), unstable coronary artery disease with or without heart failure, poorly controlled DM, CKD (6), and in some measure normal aging (16). In some settings, a negative association exists between inflammatory markers and total T concentrations (16). The notion that low T could result from increased exposure to specific proinflammatory molecules was suggested in experimental animals. In animal models, ILs, TNF-α, and CRH block testicular steroidogenesis by inhibiting key steps in Leydig-cell sterol transport and T biosynthesis (18–21). Likewise, in an earlier clinical study demonstrated that injection of IL-6 suppresses T concentrations dose-dependently in young men (ages 21–39 y) after a 4–6 hours of delay (22, 29). This investigation was only able to evaluate 3 subjects/dose, all of whom were young men. Also intensive blood sampling and deconvolution analysis were not available to quantify T and LH secretion, or to estimate feedback/feedforward changes over 24 hours. The present clinical analysis demonstrates that exogenous IL-2 suppresses both pulsatile and basal (and hence total) T secretion in young men, and inhibits principally pulsatile T secretion in older men. The overall outcome is reduced T secretion even when normalized per unit LH concentration, signifying impaired testis responsiveness to LH or reduced LH bioactivity. Clinically, to the degree that reduced T secretion complicates systemic inflammatory disease(s), the resultant low-T state especially if prolonged may accentuate catabolic consequences of the illness. In this regard, in one animal model, T replacement attenuated the tissue-catabolic effects of systemic IL-6 infusion (40). Accordingly, the acute T-suppressing actions of IL-2 observed here in both young and older men may have more general pathophysiologic implications under conditions of chronic inflammation. This hypothesis will require further clinical investigation.
The majority, but not all (22, 29), of clinical investigations of ILs have been performed in cancer patients. In an analysis of 119 such patients, IL-2 treatment resulted in 14 patients' experiencing malaise, 5 nausea, 2 disorientation, and 2 oliguria (8, 9). Capillary-leak syndrome, hypotension and tachycardia have occurred rarely at high IL-2 doses (31, 32). Given this toxicity risk, the FDA and Mayo DSMB restricted our dosing to stepwise injection of 3 and then 6 million U of IL-2 in healthy individuals monitored in a CRU to ensure subject safety. The study was thus not a dose-response outcomes study, and was appropriately powered at the higher dose. At these IL-2 doses, hematocrit, leukocyte, and platelet counts, pulse and BP were not affected. Headache and malaise occurred, but no oliguria, hypotension, dyspnea, or arrhythmia developed.
LH concentrations were higher at screening in older individuals, but became similar by age over 24 hours under IL-2 stress. LH levels are determined by GnRH drive and T feedback. Feedback on GnRH and LH by T can be modeled when GnRH is injected (26). In the absence of injected GnRH, we posed a surrogate feedback measure, the LH to T concentration ratio. This ratio assumes that higher LH concentrations at any given T concentration reflect reduced negative feedback by T on LH, for any given degree of GnRH drive. Thereby, we inferred that under saline injection, older men exhibit lower T feedback on GnRH/LH than young men, viz, a higher LH to T ratio. IL-2 treatment decreased this ratio significantly in older but not young men denoting increased T feedback on the GnRH-LH unit at the older age. This feedback augmentation could be mediated via inhibitory effects of IL-2 on GnRH and/or LH (23, 24). Our data do not identify the exact site(s) of IL-2 action in the hypothalamo-pituitary unit.
In summary, of the complex findings, the present article reports a randomized crossover study in 17 young and 18 older men given saline and either of 2 doses of IL-2 (first 6 subjects' receiving the lower dose) with intensive 10-minute blood sampling over 24 hours for later measurements of LH and T and estimates of basal and pulsatile LH and T secretion by mathematical deconvolution. This was the first study of its kind in nondiseased humans and therefore required FDA approval, and close FDA, Mayo IRB, and DSMB scrutiny. The main finding was that a relatively low dose of IL-2, which induced mild and tolerable adverse reactions over saline, markedly suppressed pulsatile T secretion in young and older men. The second finding was that there are age differences in IL-2's effects, defined by reduced nonpulsatile T secretion (young men), reduced T secretory burst frequency (older men), and heightened T feedback on the hypothalamopituitary unit (older men). These outcomes have broad implications showing for the first time in humans a unifying mechanism by which inflammation could reduce T availability in many disease and nondisease states. Examples of disease states include DM, RA, and CKD, and of nondisease states aging, social disconnection, and mood and sleep disturbances. Our data also refute the notion that older age has no consequences on the male gonadal axis outside of coincident diseases.
Caveats include, first, the need to confirm our inference of dual sites of IL-2 action in humans by even more specific analytical tools. Second, given that 24-hour monitoring did not capture T's full recovery from suppression by IL-2 in either cohort, we cannot determine whether age prolongs the time to T recovery. Third, this investigation was not powered to detect IL-2 dose effects, and did not monitor 24-hour serum IL-2 or cortisol concentrations. Thus, the exact extent to which varying IL-2 doses elevate cortisol or IL-2 per se and/or contribute to suppressed gonadal T secretion cannot be ascertained from this study.
Acknowledgments
We thank Jill Smith for support of manuscript preparation and graphics, the Mayo Immunochemical Laboratory for assay assistance, and the Mayo research nursing staff for implementing the protocol.
This work was supported in part by National Institutes of Health Grants R01 AG019695, R01 AG029362, and P30 DK050456 (Metabolic Studies Core of the Minnesota Obesity Center) and by the National Center for Advancing Translational Sciences Grant UL1 TR000135.
Disclosure Summary: The authors have nothing to disclose.
Abbreviations
- CKD
chronic kidney disease
- CRU
Clinical Research Unit
- DM
diabetes mellitus
- DSMB
Data Safety and Monitoring Board
- FDA
Food and Drug Administration
- Hb
hemoglobin
- IRB
Institutional Review Board
- RA
rheumatoid arthritis
- rh
recombinant human
- T
testosterone.
