


IGF-1 is known for its various physiological and severe pathophysiological effects on human metabolism; however, underlying molecular mechanisms still remain unsolved. To reveal possible molecular mechanisms mediating these effects, for the first time, we associated serum IGF-1 levels with multifluid untargeted metabolomics data.
Plasma/urine samples of 995 nondiabetic participants of the Study of Health in Pomerania were characterized by mass spectrometry. Sex-specific linear regression analyses were performed to assess the association of IGF-1 and IGF-1/IGF binding protein 3 ratio with metabolites. Additionally, the predictive ability of the plasma and urine metabolome for IGF-1 was assessed by orthogonal partial least squares analyses.
We revealed a multifaceted image of associated metabolites with large sex differences. Confirming previous reports, we detected relations between IGF-1 and steroid hormones or related intermediates. Furthermore, various associated metabolites were previously mentioned regarding IGF-1-associated diseases, eg, betaine and cortisol in cardiovascular disease and metabolic syndrome, lipid disorders, and diabetes, or have previously been found to associate with differentiation and proliferation or mitochondrial functionality, eg, phospholipids. bradykinin, fatty acid derivatives, and cortisol, which were inversely associated with IGF-1, might establish a link of IGF-1 with inflammation. For the first time, we showed an association between IGF-1 and pipecolate, a metabolite linked to amino acid metabolism. Our study demonstrates that IGF-1 action on metabolism is tractable, even in healthy subjects, and that the findings provide a solid basis for further experimental/clinical investigation, eg, searching for inflammatory or cardiovascular disease- or metabolic syndrome-associated biomarkers and therapeutic targets.
Physiologically, the GH/IGF-1 axis is known to promote growth, differentiation, and proliferation and to maintain physiological function and metabolism of very different tissues including neuronal tissue (1), human ovary and testicle (2, 3), liver stroma (4), and the kidney (5) as well as the cardiovascular system including the heart (6). The major part of circulating IGF-1 is bound to IGF binding protein 3 (IGFBP-3) in a ternary complex with acid labile subunit (7). The IGF-1 to IGFBP-3 ratio is a commonly used estimate of free, biologically active IGF-1 (8).
In recent years, IGF-1 and its influence on pathological metabolic conditions were widely discussed (9, 10). Beyond the overt disease of the GH/IGF-1 axis, acromegaly related to elevated IGF-1 and GH deficiency associated with lower IGF-1 levels (8), there is evidence that low IGF-1 levels are causally related to cerebrovascular and cardiovascular diseases with higher risks for ischemic stroke and congestive heart failure (11). Moreover, lower IGF-1 levels were associated with insulin resistance, metabolic syndrome, and lipid disorders (9, 12, 13), and low as well as very high IGF-1 is linked to an increased all-cause mortality (14). However, the underlying pathophysiological links are still barely understood.
To further elucidate the possible mechanism behind the above-mentioned effects of IGF-1, the present study aims to assess the associations of IGF-1 and the IGF-1 to IGFBP-3 ratio with the plasma and urine metabolome in a large diabetes-free sample from the general population. The metabolome comprises a huge variety of small organic molecules (metabolites), which can be quantified and identified by mass spectrometry (MS) and/or nuclear magnetic resonance spectroscopy to capture the physiological states of an organism. Metabolite profiling allows for a virtually hypothesis free testing on the associations of an endogenous regulator like IGF-1 and alterations on the molecular level (15), which could provide a link between the reported IGF-1 associated diseases. We used an untargeted approach based on MS, which generates a diverse panel of metabolites spanning multiple classes to comprehensively address this issue.
Materials and Methods
Study population
The Study of Health in Pomerania (SHIP-Trend) is a population-based study located in West Pomerania, a rural region in northeast Germany (16). A stratified (age, sex, and city/county of residence) random sample of 8826 adults aged 20–79 years was drawn from population registries. Sample selection was facilitated by centralization of local population registries in the Federal State of Mecklenburg-West Pomerania. Baseline examinations were conducted between 2008 and 2012. In total, 4420 choose to participate (50.1% response). All participants gave written informed consent before taking part in the study. The study was approved by the local ethics committee and conformed to the principles of the Declaration of Helsinki.
For a subsample of 995 subjects without self-reported diabetes, plasma and urine metabolomics data based on MS as well as IGF-1 and IGFBP-3 measurements were available.
Laboratory measurements and phenotypic characterization
Smoking status (current, former, or never-smokers), daily alcohol consumption, and physical activity (≥2 h training a week) were assessed using computer-aided personal interviews. Waist circumference was measured to the nearest 0.1 cm using an inelastic tape midway between the lower rib margin and the iliac crest in the horizontal plane. Hypertension was defined as an increased blood pressure (BP) (systolic BP of ≥140 mm Hg or a diastolic BP of ≥90) or the use of antihypertensive medication. The definition of liver disease was based on self-reported liver disease or serum γ-glutamyl transferase (GGT), aspartate-amino transferase, or alanine-amino transferase activities greater than the population mean + 2 × SD.
Fasting blood samples were drawn from the cubital vein in the supine position before noon. Spot urine samples were collected in the same time frame. The samples were analyzed immediately or stored at −80°C prior analyses. Serum IGF-1 and IGFBP-3 levels were determined by automated two-site chemiluminescent immunoassays on the IDS-iSYS (Immunodiagnostic Systems). The assays were performed according to the manufacturer’s recommendations by skilled technical personal. The interassay coefficient of variation was 3.5% or 8.3% at high level, 4.3% or 8.8% at median level, and 6.3% or 10% at low level in the IGF-1 or IGFBP-3 assay, respectively. Low-density lipoprotein (LDL) cholesterol, aspartate-amino transferase, alanine-amino transferase, and GGT were measured by standard methods (Dimension VISTA; Siemens Healthcare Diagnostics).
Metabolomics measurements
Nontargeted metabolomics analysis for metabolic profiling was conducted at the Genome Analysis Center (Helmholtz Zentrum München, Germany). A detailed description of metabolite measurements, annotations, and data processing is given in the supplemental information. Briefly, two separate liquid chromatography and tandem MS analytical methods were used as previously published (17) to obtain a broad metabolite spectra in plasma and urine samples in an untargeted manner. Several preprocessing steps were performed, which are described in more detail in the Supplemental Data. Briefly, raw ion counts of metabolites were rescaled with the median of each runday to avoid differences caused by daily variations of platform performances. Metabolites were kept only if a valid estimation (more than three observations) of the median within a runday was possible. In case of urine, samples were additionally normalized to account for diurnal dilution using probabilistic quotient normalization (18). Afterward all metabolites were log2 transformed. Finally, robust multivariate outlier exclusion based on principle component analyses was performed. With respect to the generation of Gaussian graphical models (GGMs), missing values were imputed for metabolites with less than 20% missing values using sampling from truncated log-normal distributions or multiple imputations by chained equations. After preprocessing, 475 plasma and 558 urine metabolites remained for the statistical analyses.
Statistical analysis
For descriptive analyses, continuous data were expressed as median (25th, 75th quartile) and nominal data as percentage. For bivariate comparison of men and women, the Mann-Whitney U test (continuous data) or χ2 test (nominal data) was used. In a first step, linear regression models were performed with IGF-1 or IGF-1 to IGFBP-3 ratio levels as independent and plasma or urine metabolites as dependent variable. For this purpose IGF-1 levels were log transformed. To avoid spurious results in linear regression from a single outlier, additional univariate outliers for each metabolite were excluded based on a more than 3 SD-fold deviation from the mean. All models were separately performed for men and women and adjusted for age, smoking, physical activity, waist circumference, hypertension, liver disease, and LDL-cholesterol.
To account for multiple testing, we adjusted the P values by controlling the false discovery rate (FDR) at 5% using the Benjamini-Hochberg procedure. GGMs for the plasma and urine metabolome data were calculated because of their ability to mirror physiological dependencies (19). An extensive description of the procedure can be found in the Supplemental Data. Briefly, GGMs rely on full-order partial correlations, which mean that a correlation between two metabolites exists only if it is independent from all remaining metabolites in the data set. Significant partial correlations after Bonferroni correction were visualized as network.
In addition to the single associations, we additionally performed orthogonal partial least squares (OPLS) to test for a predictive signature of the plasma or urine metabolome for IGF-1 or IGF-1 to IGFBP-3 ratio levels. OPLS is a modification of the partial least square (PLS) regression analysis. PLS is a regression method that finds the relation between predictor variables (X, here the metabolites) and dependent variables (Y, here log[IGF-1] or IGF-1 to IGFBP-3 ratio). In improvement over PLS, OPLS divides the systematic variation in X into two parts: one is linearly related to Y and represents the predictive part (predictive components), and one is orthogonal to Y (orthogonal components) and is therefore unrelated to Y.
The predictive ability of the model (Q2), defined as correctly explained variance, was estimated by 7-fold cross-validation. For this, the data set was partitioned into seven equal-sized subsamples. Based on six of seven subsamples, a model was built, which was used for the prediction of the left-out data. This process was repeated seven times with each of the seven subsamples used exactly once for the prediction. For the whole sample, the predicted data are then compared with the original data and the Q2 was calculated. The metabolites were mean centered and Pareto scaled. For the presentation of the results, we used score plots and the variable importance in projection (VIP; see Supplemental Data). The statistical analyses were performed using SAS version 9.4 (SAS statistical software, version 9.4; SAS Institute), R 3.0.1 (R Foundation for Statistical Computing; version 3.0.1), and SIMPCA-P + 13.0.02 (Umetrics AM).
Results
General characteristics of the study population are presented in Table 1. Women were more often a never-smoker, consumed less alcohol, were less often affected by hypertension, and had lower glycated hemoglobin and estimated glomerular filtration rate (GFR) values compared with men. With respect to hormone levels, IGF-1 levels were comparable, in which the IGFBP-3 levels were higher in women, resulting in a lower IGF-1 to IGFBP-3 ratio in women compared with men.
General Characteristics of the Study Population
| Characteristics | Men (n = 439) | Women (n = 556) | P Value* |
|---|---|---|---|
| Age, y | 50 (39; 61) | 51 (41; 60) | .95 |
| Smoking, % | <.01 | ||
| Never-smokers | 31.5 | 50.6 | |
| Former smokers | 45.7 | 28.1 | |
| Current smokers | 22.8 | 21.3 | |
| Physically active, % | 72.9 | 73.6 | .81 |
| Alcohol consumption, g/d | 8.5 (3.0; 18.4) | 2.4 (0.7; 5.5) | <.01 |
| Waist circumference, cm | 94 (86; 102) | 81 (74; 90) | <.01 |
| Hypertension, % | 44.1 | 35.3 | <.01 |
| Liver disease, % | 9.3 | 9.2 | .93 |
| HbA1c, % | 5.2 (4.9; 5.5) | 5.1 (4.8; 5.5) | <.01 |
| Total cholesterol, mmol/L | 5.3 (4.6; 6.1) | 5.5 (4.9; 6.3) | <.01 |
| Triglycerides, mmol/L | 1.31 (0.92; 1.91) | 1.15 (0.84; 1.62) | <.01 |
| eGFR, mL/min per 1.72 m2 | 91 (81; 104) | 88 (76; 101) | <.01 |
| IGF-1, ng/mL | 141 (114; 174) | 132 (106; 173) | .06 |
| IGFBP-3, ng/mL | 4092 (3475; 4695) | 4254 (3652; 4951) | <.01 |
| IGF-1 to IGFBP-3 ratio | 0.035 (0.029; 0.041) | 0.031 (0.026; 0.038) | <.01 |
Abbreviations: HbA1c, glycated hemoglobin; eGFR, estimated glomerular filtration rate. Continuous data are expressed as median (25th percentile; 75th percentile); nominal data are given as percentages.
χ2 test (nominal data) or Mann-Whitney test (interval data) was performed.
Among women, linear regression revealed 23 or 38 plasma metabolites significantly associated with IGF-1 or IGF-1 to IGFBP-3 ratio levels, respectively (Table 2 and Supplemental Tables 1 and 2). In plasma, 19 metabolites were related to both IGF-1 and IGF-1 to IGFBP-3 ratio (Figure 1). With respect to urine, nine metabolites were related to IGF-1 and 21 to IGF-1 to IGFBP-3 ratio levels, with seven urine metabolites found for both (Table 3 and Supplemental Figure 1). Among men, only three and four plasma metabolites as well as one and seven urine metabolites were associated with IGF-1 and IGF-1 to IGFBP-3 ratio serum levels, respectively, with no overlap in both body fluids (Table 2 and 3, Figure 1). No overlap was seen for men and women, except one unknown plasma metabolite (X-12844). Together with the generally lower number of associations in men, we decided to focus on women in the following analyses.

Corrected P values from univariate linear regression analysis of metabolites associated with IGF-1 and the IGF to IGFBP-3 ratio among women in plasma (left panel) and urine (right panel). The dotted line denotes a FDR of 0.05, displaying the significance threshold. Red marked metabolites were associated with both IGF-1 and the IGF-1 to IGFBP-3 ratio. Regression models were adjusted for age, smoking, alcohol consumption, physical activity, waist circumference, liver diseases, LDL cholesterol, and hypertension.
Significantly Associated Plasma Metabolites With IGF-1 to IGFBP-3 Ratio or Log IGF-1 Levels in Women and Men
| Metabolite | Class | IGF-1 to IGFBP-3 Ratio | Log IGF-1 | ||
|---|---|---|---|---|---|
| β | FDR | β | FDR | ||
| Women | |||||
| Betaine | Amino acid | 10.6 | 2.37E−06 | 0.155 | 4.08E−02 |
| Pipecolate | Amino acid | −16.0 | 8.77E−05 | −0.352 | 5.54E−03 |
| α-Hydroxyisovalerate | Amino acid | −10.0 | 3.02E−03 | −0.215 | 3.73E−02 |
| Threonine | Amino acid | −7.5 | 1.22E−02 | −0.233 | 5.54E−03 |
| Bradykinin | Peptide | −51.0 | 1.29E−05 | −1.010 | 1.17E−02 |
| Bradykinin, des-arg(9) | Peptide | −63.0 | 1.87E−04 | −1.131 | 3.73E−02 |
| Cyclo(leu-pro) | Peptide | −15.0 | 1.22E−02 | −0.398 | 3.17E−02 |
| Phenylalanyltryptophan | Peptide | −7.6 | 2.15E−02 | −0.013 | 9.56E−01* |
| Cortisol | Lipid | −15.0 | 8.77E−05 | −0.275 | 2.45E−02 |
| 1-Palmitoylglycerophosphate | Lipid | −13.0 | 2.89E−04 | −0.254 | 2.45E−02 |
| 1-Palmitoylglycerophosphoethanolamine | Lipid | −11.0 | 7.75E−04 | −0.095 | 5.43E−01 |
| Pregnanediol-3-glucuronide | Lipid | 19.1 | 3.02E−03 | 0.373 | 1.21E−01* |
| 1-Oleoylglycerophosphoinositol* | Lipid | −14.0 | 3.14E−03 | −0.325 | 2.44E−02 |
| 1-Palmitoylglycerophosphoinositola | Lipid | −10.0 | 1.12E−02 | −0.234 | 3.73E−02 |
| Palmitate (16:0) | Lipid | −5.7 | 1.21E−02 | −0.097 | 2.61E−01* |
| 1-Linoleoylglycerophosphocholine (18:2n6) | Lipid | 7.8 | 1.22E−02 | 0.152 | 1.66E−01* |
| Dihomo-linolenate (20:3n3 or n6) | Lipid | −6.1 | 1.22E−02 | −0.084 | 4.19E−01* |
| Docosapentaenoate (n6 DPA; 22:5n6) | Lipid | −8.7 | 1.43E−02 | −0.258 | 1.17E−02 |
| Pregn steroid monosulfate | Lipid | 12.0 | 1.83E−02 | 0.202 | 2.97E−01* |
| Palmitoleate (16:1n7) | Lipid | −9.0 | 2.56E−02 | −0.179 | 2.25E−01* |
| 5α-Pregnan-3β,20α-diol disulfate | Lipid | 17.7 | 3.17E−02 | 0.422 | 1.14E−01* |
| 1-Stearoylglycerophosphoethanolamine | Lipid | −8.8 | 3.90E−02 | −0.167 | 2.85E−01* |
| Epiandrosterone sulfate | Lipid | 12.2 | 8.33E−02 | 0.402 | 3.66E−02 |
| Nicotinamide | Cofactors and vitamins | −11.0 | 1.59E−02 | −0.363 | 5.54E−03 |
| Biliverdin | Cofactors and vitamins | 8.7 | 1.83E−02 | 0.117 | 4.76E−01* |
| Uridine | Nucleotide | 4.7 | 2.91E−02 | 0.149 | 1.52E−02 |
| 5-Methyluridine (ribothymidine) | Nucleotide | 4.9 | 4.78E−02 | 0.187 | 1.17E−02 |
| X-20845 | Unknown | −66.0 | 9.55E−05 | −1.227 | 4.08E−02 |
| X-11736 | Unknown | −80.0 | 1.87E−03 | −1.831 | 2.45E−02 |
| X-18140 | Unknown | −10.0 | 1.11E−02 | −0.145 | 3.38E−01* |
| X-11442 | Unknown | 11.0 | 1.21E−02 | 0.111 | 5.79E−01* |
| X-18039 | Unknown | −18.0 | 1.22E−02 | −0.531 | 1.17E−02 |
| X-11372 | Unknown | 8.2 | 2.08E−02 | 0.090 | 6.08E−01* |
| X-16934 | Unknown | 10.0 | 2.08E−02 | 0.076 | 7.78E−01* |
| X-11441 | Unknown | 9.7 | 2.43E−02 | 0.116 | 5.45E−01* |
| X-12844 | Unknown | 8.2 | 2.59E−02 | 0.409 | 2.39E−06 |
| X-16044 | Unknown | −14.0 | 2.80E−02 | −0.131 | 6.76E−01* |
| X-16946 | Unknown | 8.3 | 4.06E−02 | 0.233 | 4.08E−02 |
| X-11795 | Unknown | 6.8 | 4.46E−02 | 0.156 | 1.67E−01* |
| X-11444 | Unknown | 8.6 | 5.43E−02* | 0.403 | 1.46E−04 |
| X-16124 | Unknown | 32.2 | 1.30E−01* | 1.192 | 2.44E−02 |
| Men | |||||
| Urea | Amino acid | 14.4 | 1.30E−02 | 0.313 | 8.38E−02* |
| Cyclo(leu-pro) | Peptide | −21.9 | 1.69E−02 | −0.473 | 1.06E−01* |
| 10-Undecenoate (11:1n1) | Lipid | 13.4 | 2.63E−02 | 0.185 | 4.86E−01* |
| 1-Pentadecanoylglycerophosphocholine (15:0) | Lipid | 11.2 | 1.03E−01* | 0.411 | 3.33E−02 |
| 1-Margaroylglycerophosphocholine (17:0) | Lipid | 10.5 | 1.37E−01* | 0.456 | 1.52E−02 |
| X-11799 | Unknown | −41.2 | 2.46E−02 | −0.879 | 1.48E−01* |
| X-12844 | Unknown | 4.7 | 5.56E−01* | 0.291 | 4.50E−02 |
Nonsignificant regarding FDR.
Significant Associated Urine Metabolites With IGF-1 to IGFBP3 Ratio or Log IGF-1 Levels in Women and Men
| Metabolite | Class | IGF-1 to IGFBP3 Ratio | Log IGF-1 | ||
|---|---|---|---|---|---|
| β | FDR | β | FDR | ||
| Women | |||||
| 11-Ketoetiocholanolone glucuronide | Lipid | 17.7 | 7.70E−04 | 0.490 | 6.57E−04 |
| Androsteroid monosulfate 2 | Lipid | 26.7 | 2.08E−03 | 0.347 | 3.20E−01* |
| Androsterone sulfate | Lipid | 19.7 | 7.28E−03 | 0.429 | 8.81E−02* |
| Epiandrosterone sulfate | Lipid | 21.8 | 1.57E−02 | 0.383 | 3.11E−01* |
| Tyrosine | Amino acid | 11.1 | 3.65E−03 | 0.143 | 3.48E−01* |
| Homocitrulline | Amino acid | −8.9 | 2.07E−02 | −0.188 | 2.18E−01* |
| Histidine | Amino acid | 9.5 | 4.51E−02 | 0.182 | 2.65E−01* |
| Imidazole lactate | Amino acid | −8.4 | 4.71E−02 | −0.062 | 7.50E−01* |
| Pro-hydroxy-pro | Amino Acid | 6.9 | 5.17E−02* | 0.220 | 2.43E−02 |
| X-12846 | Unknown | 16.1 | 3.51E−05 | 0.353 | 1.50E−03 |
| X-11444 | Unknown | 12.4 | 3.21E−04 | 0.352 | 2.24E−04 |
| X-12689 | Unknown | −12.0 | 4.08E−04 | −0.205 | 1.12E−01* |
| X-12844 | Unknown | 11.6 | 4.98E−04 | 0.391 | 4.84E−06 |
| X-12122 | Unknown | −12.0 | 7.28E−03 | −0.213 | 2.57E−01 |
| X-17357 | Unknown | 10.4 | 7.28E−03 | 0.373 | 7.05E−05 |
| X-17340 | Unknown | 10.2 | 7.28E−03 | 0.240 | 5.17E−02* |
| X-16397 | Unknown | −8.3 | 7.37E−03 | −0.150 | 2.31E−01* |
| X-17339 | Unknown | 8.6 | 7.37E−03 | 0.155 | 2.31E−01* |
| X-12687 | Unknown | 14.0 | 1.24E−02 | 0.423 | 5.90E−03* |
| X-12258 | Unknown | 19.0 | 1.57E−02 | 0.468 | 6.40E−02* |
| X-11357 | Unknown | −14.0 | 3.38E−02 | −0.265 | 2.65E−01* |
| X-12026 | Unknown | 8.4 | 4.90E−02 | 0.274 | 1.54E−02 |
| X-01911 | −11.0 | 3.32E−01* | −0.522 | 3.07E−02 | |
| Men | |||||
| 4-Guanidinobutanoate | Amino acid | −19.3 | 2.25E−02 | −0.460 | 1.61E−01* |
| Isobutyrylglycine | Amino acid | 15.0 | 3.66E−02 | 0.367 | 1.61E−01* |
| Ethyl glucuronide | Xenobiotics | −49.9 | 3.66E−02 | −1.009 | 2.53E−01* |
| C-mannosyltryptophan | Amino acid | 2.9 | 3.10E−01* | 0.158 | 1.74E−02 |
| X-12760 | Unknown | 18.1 | 4.99E−03 | 0.276 | 2.61E−01* |
| X-20327 | Unknown | −43.1 | 4.99E−03 | −0.874 | 1.61E−01* |
| X-17323 | Unknown | 15.3 | 2.58E−02 | 0.345 | 1.61E−01* |
| X-11799 | Unknown | −40.3 | 3.66E−02 | −0.760 | 2.71E−01* |
Nonsignificant regarding FDR.
In women, plasma betaine showed the strongest positive, whereas bradykinin and pipecolate the strongest negative association with IGF-1 to IGFBP-3 ratio (Table 2). Moreover, two clusters of steroid derivatives became obvious by visual inspection of the overlaid GGM among women. The first cluster includes metabolites related to dehydroepiandrosterone sulfate (DHEA-S; Figure 2). After FDR correction, positive relations of IGF-1 to IGFBP-3 ratio values with plasma steroids including pregnenolone sulfate, pregnanediol-3-glucuronide, and 5α-pregnan-3β, 20α-diol disulfate as well as urine steroids including epiandrosterone sulfate or androsterone sulfate were detectable (Table 2). Furthermore, DHEA-S (plasma: β = 8.27, P = .0266; FDR 0.172; urine: β = 28.40, P = .0025; FDR 0.057) and 21-hydroxypregnenolone disulfate (plasma: β = 6.39, P = .0314; FDR 0.195; urine: β = 7.54, P = .0229; FDR 0.241) were positively associated with IGF-1 to IGFBP-3 ratio in both plasma and urine, even if the estimates missed statistical significance after correction. The second set of steroid derivatives clustered around cortisol and 11-ketoetiocholanolone glucuronide whereby the latter metabolite was detectable only in urine (Figure 2). In particular, the IGF-1 to IGFBP-3 ratio was positively related to urinary levels of 11-ketoetiocholanolone and to connected unknown urine metabolites. Furthermore, plasma cortisol levels showed a significantly negative association in plasma, whereas a trend toward a positive relation with urinary tetrahydrocortisone levels (β = 6.18, P = .011, FDR 0.149) became apparent.
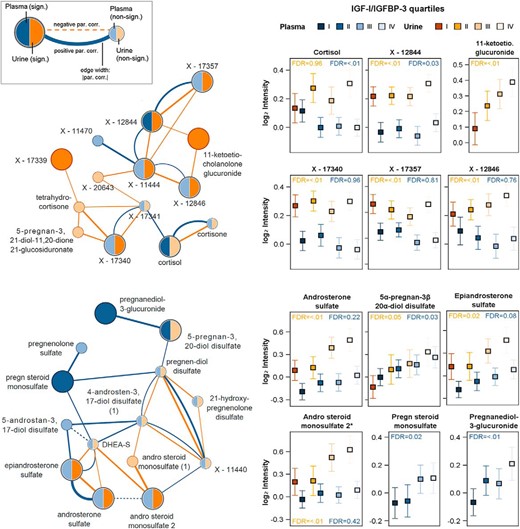
Left panels, Cortisol (upper part)- and DHEA-S (lower part)-related subnetwork from the overlay of the plasma (blue) and urine (orange) GGM with integration of results from linear regression analyses for the IGF-1 to IGFBP-3 ratio. Metabolites were highlighted by increased node size and darker colors if they showed a significant association with the IGF-1 to IGFBP-3 ratio. Right panels, Mean with 95% confidence interval (CI) for significant metabolites over quartiles of IGF-1 to IGFBP-3 ratio in urine (orange) and plasma (blue). Par.corr, partial correlation.
Moreover, several plasma lipid metabolites, eg, palmitate or 1-stearoylglycerophosphoethanolamine, were negatively associated with the IGF-1 to IGFBP-3 ratio levels (Table 2). In addition to the mentioned clusters, positive relations of IGF-1 to IGFBP-3 ratio levels with urinary levels of tyrosine and histidine were detected (Table 3).
Four OPLS models were fitted to identify plasma or urine metabolites that could fairly predict IGF-1 or IGF-1 to IGFBP-3 ratio levels (Figure 3 and Supplemental Figure 2). Three models (plasma: IGF-1 to IGFBP-3 ratio; urine: IGF-1, IGF-1 to IGFBP-3 ratio) included one predictive and one orthogonal component and one model (plasma: IGF-1) one predictive and two orthogonal components. The predictive ability Q2 ranges from 27.8% to 41.3% (plasma: IGF-1 41.3%, IGF-1 to IGFBP-3 ratio: 32.9%; urine: IGF-1 33.1%, IGF-1 to IGFBP-3 ratio 27.8%). Using a VIP cutoff greater than 1, we detected 37 or 58 plasma metabolites as well as 45 or 55 urine metabolites, which were important for the prediction of IGF-1 or IGF-1 to IGFBP-3 ratio levels, respectively (Supplemental Table 3). In all models, the metabolites with the highest VIP again included steroid derivatives as DHEA-S, androsterone sulfate, epiandrosterone sulfate, pregnan steroid monosulfate, or 5α-pregnan-3β, 20α-diol disulfate, confirming the above-mentioned results (Supplemental Figures 3 and 4). Further plasma metabolites associated with the IGF-1 to IGFBP-3 ratio found in linear regression and OPLS were, for example, bradykinin and palmitate. With respect to urine metabolites, the amino acids tyrosine and histidine were confirmed (Supplemental Figure 4).
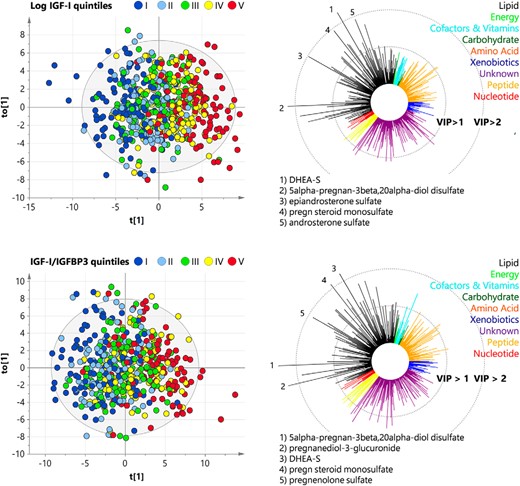
OPLS regression analyses for modeling IGF-1 and IGF to IGFBP-3 ratio based on plasma metabolites among women. Left panels, OPLS score plots for log(IGF-1) (top line) and IGF-1 to IGFBP-3 ratio (bottom line) showing the predictive component t(1) and the first orthogonal component t0(1). Values were colored according to quintiles of distribution of either IGF-1 or the IGF-1 to IGFBP-3 ratio using a blue (low) to red (high) gradient. Right panels, Corresponding variable influence on projection (VIP) values of the predictive component. The five metabolites with the highest VIP were mentioned. Colors refer to physiological entities of metabolites.
Discussion
Using a multifluid metabolomics approach, the present study aimed to screen for metabolic alterations in relation to IGF-1 and the IGF-1 to IGFBP-3 ratio in an epidemiological setting.
Steroids
In the present study, IGF-1 or the IGF-1 to IGFBP-3 ratio levels were associated with two steroid clusters (DHEA-S and cortisol) in women. Regarding DHEA-S, previous studies (20) detecting positive relations of DHEA-S or epiandrosterone sulfate, a DHEA-S derivative, with IGF-1, were confirmed. DHEA-S, the sulfated form of dehydroepiandrosterone, represents the most abundant steroid in humans (21). Dehydroepiandrosterone is the precursor of androstenedione, a substrate for T and estradiol synthesis (22). This synthesis pathway connects the inhibitory effect of estrogen and the observed positive influence of DHEA-S on IGF-1 level: with decreasing estrogen synthesis rate, the inhibitory effect of estrogen becomes lower and IGF-1 as well as DHEA-S would increase due to lower consumption. The lowering effect of estrogen on IGF-1 levels most likely takes place in the hepatocytes via inhibition of hepatic IGF-1 mRNA production (23, 24). This complex interplay between steroid hormones and IGF-1 levels might partly explain the detected sex differences. Furthermore, the association between sex steroids and IGF-1 might be taken into account by the interpretation of IGF-1-associated metabolic diseases: in the reproductive period, men more often suffer from hypertension, insulin resistance, and dyslipidemia (25) than women, but with increasing age and during the hormonal changes in postmenopausal transition, female prevalence rises (25, 26) as well. Thus, the observed association between sex steroids and IGF-1 is of special interest in gender epidemiology and the pathophysiology of metabolic diseases.
The second detected cluster centers on cortisol and its relatives. Cortisol is synthesized and released into circulation from the adrenal cortex and is involved in the physiological response to inflammatory processes and stress (27, 28). It has negative influence on cell proliferation (29) and is positively associated with insulin resistance (30), lipid disorders (31), and metabolic syndrome (30) as well as cardiovascular disease (32). Thus, cortisol achieves the exact opposite metabolic effects than IGF-1, which matches their negative association in our study and suggests a functional triangle. McCarthy et al (33) described a cortisol-mediated decrease in IGF-1 transcripts and IGF-1 protein in fetal rat osteoblast cells, which is in concordance with a reported inverse correlation (34) between cortisol and IGF-1 in human cord blood. Agha and Monson (35) reviewed the relationship between IGF-1 and glucocorticoid metabolism and concluded that IGF-1 mediates an inhibition of 11β-hydroxysteroid dehydrogenase, leading to a reduced cortisol synthesis. Moreover, hydrocortisone, the therapeutic form of cortisol, induced very low IGF-1 levels in women with GH deficiency (23, 36). Similar results of a lower IGF-1 to IGFBP-3 ratio after hydrocortisone replacement were found among women with hypopituitarism (37). Furthermore, a small part of cortisol metabolites (3%–5%) is excreted in urine as, for example, 11-ketoetiocholanolone (38). In acromegaly patients an increased urinary excretion of 11-ketoetiocholanolone was shown, with a normalization of both after treatment (38). Our strong positive association between urinary 11-ketoetiocholanolone and the IGF-1 to IGFBP-3 ratio confirms these findings, even in a population without GH disorders.
In summary, we detected different IGF-1-associated metabolites between men and women, which could be due to generally different metabolite profiles or due to mutual dependence of IGF-1 and steroid hormone levels. The negative association with cortisol in particular might point to the fact that IGF-1 influences inflammatory response, which is accompanied by the negative association with bradykinin as an inflammatory marker.
Peptides
In our study, the peptide bradykinin and its active metabolite bradykinin (des-arg) (39), were strongly negatively related to the IGF-1 to IGFBP-3 ratio. Previous studies already linked bradykinin to IGF-1 signaling by showing that both compounds activate mitogen activated protein kinase and stimulate prostacyclin synthesis (40). Furthermore, bradykinin is known to lower IGF-1-promoted effects on ERK1/2-mediated cell proliferation (41), whereas IGF-1 strengthens bradykinin-induced rises in intracellular calcium concentration, inositol-1,4,5-triphosphate and inositol tetrakispohosphate levels (42). Concerning our observed relation, bradykinin indeed has already been described to lower IGF-1 mRNA levels in fibroblast cells (43) by activation of the protein kinase C. Lowe et al (43) observed that IGF-1 mRNA decrease is often accompanied by an increase in intracellular phosphatidylcholine-derived metabolites such as choline and phosphocholine (44). These metabolites mediate the activation of specific isoforms of the protein kinase C that are capable of inhibiting IGF-1 mRNA synthesis (44). Interestingly, we found 1-linoleoylglycerophosphocholine, a phosphocholine derivative, to be positively associated with the IGF-1 to IGFBP-3 ratio. The fact that some phosphocholine derivatives activate specific protein kinase C isoforms that lower IGF-1 levels and the finding of IGF-1-induced translocation and activation of the protein kinase C to the nuclear region (45) argues for a complex involvement of (phospho-)cholines and activation of the protein kinase C isoforms in the interaction of IGF-1 and bradykinin. As indicated above, this could be of special importance in the regulation of inflammatory response, in which IGF-1 and bradykinin have inverse function with high IGF-1 levels to reduce inflammatory responses, whereas bradykinins are increased in inflammation. This is of interest in chronic inflammatory vascular diseases, eg, atherosclerosis, which is associated with low IGF-1 and in which the kallikrein-kinin system plays a role as well (46).
Amino acids
In addition to bradykinin, the amino acid derivatives pipecolate and betaine revealed associations with the IGF-1 to IGFBP-3 ratio. Apicella et al (47) detected a decrease in cortisol after betaine intake that was accompanied by a betaine-induced increase in GH and IGF-1 among men. Assuming a similar effect in women, these findings are consistent with our detected positive relations with betaine and negative association with cortisol. Moreover, betaine and IGF-1 were linked on the functional level. Similar to IGF-1 (12, 48, 49), low betaine was associated with cardiovascular disease, metabolic syndrome, lipid disorders, and diabetes (50, 51). Betaine is an N-trimethylated amino acid that has antioxidant and organic osmolyte activity (52) and protects against cellular stress (53), and both processes are also assumed for IGF-1. Furthermore, betaine decreased IGFBP-1 secretion after inhibition with ethanol resulting in higher IGF-1 levels (54), and seemed to stimulate IGF-1 release and IGF-1 receptor signaling pathways (55). Due to the strong reproducible association and known interactions, we assume betaine to play a major role in IGF-1-associated metabolic diseases.
For pipecolate, a metabolite involved in the catabolic pathway of lysine, we detected a strong inverse association with IGF-1. Interestingly, previous studies (56, 57) reported positive relations between lysine and IGF-1. Thus, our data could be explained by a possible suppressed degradation of lysine, which connects an increase in IGF-1 with a decrease in pipecolate levels. To the best of our knowledge, pipecolate itself has not been described to be associated with IGF-1 levels before. However, studies demonstrated a major role of pipecolate in cell differentiation and proliferation (58) and showed that pipecolate levels are dependent on physiological liver (59), endocrine function, and respiratory chain activity (60), which all represent physiological targets of IGF-1 as well. However, further research is necessary to validate and clarify the causal association between pipecolate and IGF-1.
Taken together, the in the present study, three strongest associated metabolites are members of the protein/peptide/amino acid metabolism which in general is known to be strongly influenced by IGF-1 actions, and additionally, they represent three major fields of IGF-1 action: 1) lowering metabolic diseases (betaine), 2) inflammatory processes (bradykinin) and 3) possibly growth, differentiation, and proliferation (pipecolate) (61).
Lipids
IGF-1 was associated with various representatives of glycerophospholipids, phosphatidylinositolm, and phosphatidylcholine. In addition to the above-mentioned IGF-1-induced protein kinase C translocation and activation, Divecha et al (45) observed an IGF-1-induced decrease in polyphosphoinositol lipid mass in the nuclei, which was seen in different studies and could be caused by IGF-1 stimulated nuclear phosphoinositidase, which hydrolyzes polyphosphoinositol lipids (62). The depletion of related intermediates from plasma in response to increasing IGF-1 levels as observed here might be an indication for the described effect. Moreover, it is known that IGF-1 is associated with lipid metabolism (12) and that low IGF-1 levels are followed by up-regulated fatty acid metabolism (63).
In line with these findings, we observed negative association of IGF-1 with the unsaturated fatty acids palmitoleate docosapentaenoate and dihomolinolenate and saturated palmitate. Palmitate occurs as a component in multiple other associated lipids and has an opposite effect on insulin physiology than IGF-1. It decreased β-cell viability and was elevated in diabetes (64). Dihomolinolenate is a prostaglandin E1 precursor, and its negative association with IGF-1 could support the thesis of low inflammatory response under IGF-1 influence in addition to prostaglandin E1 has been described to stimulate IGF-1 secretion (65). A direct relative of docosapentaenoate, docosahexaenoic acid, is known to have influence on inflammatory processes as well (66). Palmitoleate and the metabolite 1-palmitoyl-glycerophosphate might occur as representatives of the negative association between fatty acid derivatives and IGF-1 because of their key role and high incidence in lipid metabolism: 1-palmitoyl-glycerophosphate is the major lysophosphatidic acid in plasma, which has functions in growth and differentiation processes as well as in cancer (67), and its association can be explained just by its incidence in plasma. Palmitoleate, also known as 9-hexadecenoic acid, is a common compound of glycerides in human adipose tissue and might occur as one associated metabolite because in fatty acid biosynthesis, it is the final fatty acid compound before glycero(phospho-)lipid synthesis and fatty acid elongation take place. Thus, we suppose an important role for the fatty acid derivatives dihomolinolenate and docosapentaenoate in IGF-1 have an influence on inflammation. Interventional human studies found interactions of IGF-1 with nonesterified fatty acids but showed increased blood fatty acids levels (68), especially palmitic acid (69), after IGF-1 administration. Why in men fatty acids and IGF-1 show rather positive than negative relations as is also seen in our data remains to be solved in future investigation.
Energy metabolism and mitochondrial function
Our study revealed a negative association between nicotinamide and IGF-1 in plasma, suggesting an influence of IGF-1 on the energy status of the cells in peripheral tissues. This suggestion relies on the central role of the cofactor nicotinamide dinucleotide (NAD) in the citric acid cycle as an energy conductor. Nicotinamide in turn forms an essential part of NAD. IGF-1 was described to stabilize the mitochondrial membrane potential (70) that is essential for the function of the respiratory chain and maintains citric acid cycle activity under hypoxia (71). The present results may imply a mediating role of NAD in these processes.
Furthermore, the nucleotides uridine and 5-methyluridine, which derive from the pyrimidine metabolism, were positively associated with IGF-1. Interestingly, the expression of the mitochondrial pyrimidine nucleotide carrier PNC1 is dependent on IGF-1 signaling via the phosphoinositide 3-kinase/protein kinase B/mechanistic target of rapamycin (PI3-K-mTOR) pathway. PNC1 is a carrier that prefers to transport uridine 5-triphosphate (UTP), and mitochondrial UTP-concentration was shown to be directly dependent on PNC1 availability. Cellular UTP content did not vary in dependence on PNC1. PNC1 expression and correlated UTP levels play a role in maintaining physiological mitochondria function for cell growth and differentiation (72). The ability of maintaining physiological mitochondria function has already been attributed to IGF-1 (70, 71).
Sex differences in the association of IGF-1 with the metabolome
As mentioned in the previous sections, we revealed a strong sex dependence with more metabolites being significantly associated in females. In line with our results, various reports revealed a sex dependency in relation to IGF-1, eg, in GH secretion (73) or therapy (74), pattern of cardiovascular risk factors (75), and even mortality (49). A bit contradictory, GH-deficient men were more sensitive to GH administration than women and also induced changes were more accentuated in men (74). However, especially low circulating IGF-1 levels seemed to be a metabolic risk factor in men (49); hence, the general healthy state of the present study population might in part explain the unexpected missing of significant findings in men. In addition, the general higher metabolite concentrations in men (76) possibly blunted the small variations in IGF-1 levels seen in the present population. To further investigate possible reasons for these discrepancies, we applied random forest regression analyses embedded in a two-stage cross-validation procedure to compile a signature of metabolic variables (anthropometric measures, blood lipids, markers of glucose metabolism, inflammation, and liver disease as well as lifestyle parameters) in addition to the metabolome to predict either log(IGF-1) or the IGF-1 to IGFBP-3 ratio in men and women, respectively (Supplemental Figure 5). Statistical relevance of the variables was confirmed by Boruta feature (77) selection (Supplemental Figure 6). Age and waist circumference were independent of sex, the most important predictors for both log(IGF-1) and the IGF-1 to IGFBP-3 ratio (Supplemental Figures 5 and 6).
With respect to log(IGF-1), further parameters with high impact were other anthropometric variables, the estimated GFR, or blood lipids. The most obvious differences were observed with respect to the importance of GGT in men and the presence of hypertension in women. Notably, both conditions greatly differed between the sexes because men consumed a greater amount of alcohol, which alters serum GGT activities, and had a higher prevalence of hypertension. More pronounced differences in the prediction profile became obvious with respect to the IGF-1 to IGFBP-3 ratio. Whereas in men a high influence of parameters of liver function could be observed, the IGF-1 to IGFBP-3 ratio seems to rely to a greater extend on blood lipids among women. We would expect that these sex-specific metabolic conditions affecting either log(IGF-1) or the IGF-1 to IGFBP-3 ratio would even translate in the metabolome analyses despite adjustment for most of the named variables and might partly explain the different findings in men and women. An example would be the strong associations between the IGF-1 to IGFBP-3 ratio and plasma lipid species in women, which was not seen in men. As outlined above, blood lipid parameters are important predictors of the IGF-1 to IGFBP-3 ratio: among women and because high-density lipoprotein and LDL cholesterol particles are carriers of such or even composed thereof, this might be an additional explanation for the association observed. Similarly, this might hold true for the association between log(IGF-1) and bradykinin seen only in women. Bradykinin is a potent vasodilator (39), and hence, the observation that hypertension is an important condition in the prediction of log(IGF-1) in women but not in men further strengths the impact of different metabolic conditions in men and women.
In addition to the sex-specific metabolic conditions affecting the GH/IGF-1 axis, the distinct association between steroids and IGF-1 as demonstrated in the present study might be a further explanation for the sex differences. In general, the impact of the sex on the outcome of clinical medical research is well recognized (78) and further research is needed to clarify the found differences is respect to the metabolome.
Conclusion
To the best of our knowledge, we are the first to demonstrate the broad IGF-1 effects on the whole metabolism in the human body. We revealed a multifaceted image of associated plasma and urine metabolites, which revealed a strong difference between men and women. Confirming previous reports, we detected relations between IGF-1 and steroid hormones. Furthermore, several associated metabolites were also found to be related with IGF-1 associated diseases, eg, betaine and cortisol in cardiovascular disease and metabolic syndrome, lipid disorders, and diabetes, or were known to be associated with differentiation and proliferation as well as mitochondrial functionality, eg, phospholipids and pipecolate. Bradykinin, fatty acid derivatives, and cortisol metabolism might establish a link of IGF-1 with inflammation. All of these metabolites were negatively associated with IGF-1 and play a major role in (eg, endothelial) inflammation processes.
Our data clearly confirm the broad range of IGF-1 action on human metabolism as suggested by previous experimental studies. Furthermore, our investigation of healthy subjects suggests promising biomarkers of IGF-1 action on metabolism, which have to be confirmed in independent and interventional studies to further elucidate the metabolic fate of IGF-1.
Acknowledgments
We thank Bianca Schmick (Genome Analysis Center) for her expert technical assistance.
This work is also part of the research project Greifswald Approach to Individualized Medicine.
This work was supported by grants from the German Federal Ministry of Education and Research (Grants 01ZZ0403, 01ZZ0103, 01GI0883, and AtheroSysMed 03IS2061B) and the Ministry for Education, Research, and Cultural Affairs as well as the Ministry of Social Affairs of the Federal State of Mecklenburg-West Pomerania. The Greifswald Approach to Individualized Medicine consortium is supported by the Federal Ministry of Education and Research and the Ministry of Cultural Affairs of the Federal State of Mecklenburg-West Pomerania (Grant 03IS2061A). A part of this study was supported by a German Center Diabetes Research (DZD e.V.) grant (to J.A.).
Disclosure Summary: The authors have nothing to disclose.
Abbreviations
- BP
blood pressure
- DHEA-S
dehydroepiandrosterone sulfate
- FDR
false discovery rate
- GFR
glomerular filtration rate
- GGM
Gaussian graphical model
- GGT
γ-glutamyl transferase
- IGFBP-3
IGF binding protein 3
- LDL
low-density lipoprotein
- MS
mass spectrometry
- NAD
nicotinamide dinucleotide
- PLS
partial least square
- OPLS
orthogonal partial least squares
- PNC1
pyrimidine nucleotide carrier 1
- UTP
uridine 5-triphosphate
- VIP
variable importance in projection.
