


Congenital hyperinsulinism (CHI) is the most common cause of persistent hypoglycemia in neonates and infants. In medically unresponsive CHI, subtotal pancreatectomy is performed to achieve euglycemia with consequent diabetes in later life. Sirolimus, a mammalian target of rapamycin (mTOR) inhibitor, has been reported to obviate the need for pancreatectomy, but experience is limited.
We have investigated the efficacy and adverse effect profile of mTOR inhibitors in the treatment of severe CHI.
This was an observational review of 10 severe CHI patients treated with mTOR inhibitors, in France and the United Kingdom, with the intention of achieving glycemic control without pancreatectomy. Safety information was recorded.
We examined whether mTOR inhibitors achieved glycemic control, fasting tolerance, and weaning of supportive medical therapy.
mTOR inhibition achieved euglycemia, fasting tolerance, and reduced medical therapy in only three patients (30%). Triglyceride levels were elevated in five patients (50%). One child required a blood transfusion for anemia, four had stomatitis, two had sepsis, one developed varicella zoster, and two patients developed gut dysmotility in association with exocrine pancreatic insufficiency. In silico analysis of transcriptome arrays from CHI patients revealed no significant association between mTOR signaling and disease. Pancreatic tissue from two patients who did not respond to sirolimus showed no reduction in cell proliferation, further suggesting that mTOR signaling did not down-regulate proliferation in the CHI pancreas.
mTOR inhibitor treatment is associated with very limited success and must be used with caution in children with severe CHI.
Congenital hyperinsulinism (CHI), the major cause of persistent hypoglycemia in neonates and infants, is the consequence of a dysfunction in pancreatic β-cells. Excess and inappropriate insulin secretion can lead to recurrent hypoglycemia, causing severe and permanent brain damage. A significant proportion, as high as 44% of patients with CHI, develop learning disability and mental retardation (1–3).
Therefore, prompt and early treatment of hypoglycemia is very important for the neurological prognosis of patients with CHI (4).
Diazoxide-unresponsive CHI has a genetic basis in 91%–98% of patients manifested as diffuse or focal forms, respectively (3). Fluorine-18-dihydrophenylalanine (18F-DOPA) positron emission tomography (PET) (5, 6) is undertaken to identify and localize focal CHI, particularly in those carrying paternal heterozygous mutations in ABCC8/KCNJ11.
The therapeutic strategy is different between the diffuse and focal forms. Whereas focal CHI can be cured by selective and partial pancreatectomy, the management of diazoxide-unresponsive diffuse CHI is more challenging. Diffuse CHI can be unresponsive to optimal medical treatment (diazoxide and/or octreotide) and may require subtotal pancreatectomy to achieve euglycemia. However, despite surgery, 40%–59% of operated patients still continue to experience persistent hyperinsulinemic hypoglycemia for months or years (1, 7), and 98% will develop diabetes mellitus within 14 years after the surgery (7). Therefore, medical treatment alternatives should be considered in preference to surgery in diffuse and severe CHI. Sirolimus, a mammalian target of rapamycin (mTOR) inhibitor, has been recently reported in the treatment of severe diffuse CHI, with no major adverse events in a limited number of patients (8). Constitutive activation of the mTOR pathway has been postulated as a mechanism for hyperinsulinism and β-cell hyperplasia in diffuse CHI (8, 9), although this has not been substantiated in CHI pancreatic tissue. The inhibition of the mTOR pathway is known to be effective in the treatment of some cancers through inhibition of growth factors and cellular proliferation (10–14). mTOR inhibitors have been shown to be effective in inhibiting insulin production in patients with insulinomas (15). Two mTOR inhibitors are commercially available: sirolimus and everolimus. Everolimus has a shorter half-life compared with sirolimus (28 vs 62 h), which theoretically leads to more rapid attainment of steady-state concentrations than sirolimus (4 d vs 6 d). Everolimus therapy has an important role in calcineurin inhibitor-sparing regimens for renal transplant recipients and, when used as a monotherapy, may reduce the requirement for corticosteroids (16). Although effective, mTOR inhibitor use can be complicated by adverse events (17–20), which may limit their applications in neonates and infants with severe CHI.
The efficacy and safety profile of mTOR inhibitors have not been widely reported in the treatment of young children with CHI. Here we aim to review the efficacy and safety of mTOR inhibitors in the treatment of patients with severe CHI in two specialized centers.
Materials and Methods
Patients
Ten patients with severe diffuse CHI who were unresponsive to maximal medical treatment (diazoxide and/or somatostatin analog) were recruited between October 2014 and April 2016 to take part in an observational cohort study under protocol, after permission from institutional review boards.
The eligibility criteria for recruitment to this study were as follows: patients with CHI older than 2 weeks with persistent and severe CHI with or without mutations in ABCC8/KCNJ11/other known CHI genes and unresponsive to large oral dose of diazoxide (10–15 mg/kg · d) and sc or iv octreotide (30–50 μg/kg · d as per institutional protocol). The use of glucagon and variations in nutritional intake to stabilize glucose profiles were permitted. Patients with suspected or confirmed focal CHI, who would be eligible for surgical lesionectomy, and those with stable glycemic profiles on diazoxide and octreotide were excluded from recruitment. The contraindications to using sirolimus/everolimus, monitoring schedules, and items are given in the protocol in the Supplemental Materials.
Patients were continued on sirolimus/everolimus if the following were met: 1) glycemic control was achieved (>3.5 mmol/L for > 90% of measurements in the United Kingdom and > 3 mmol/L in all measurements in France) over a 48-hour period without requirement for iv fluids or glucagon therapy; 2) patients were able to tolerate oral or gastrostomy enteral nutrition and were able to fast for a significantly longer period than at baseline; and 3) there were no serious adverse events from sirolimus. The use of additional CHI medication, either diazoxide or octreotide was permitted if one or both medications were tolerated by the patient. In contrast, if patients developed serious adverse events from sirolimus/everolimus treatment or success criteria were not achieved by 6 weeks of therapy, sirolimus/everolimus was discontinued.
Four patients from the Metabolism Unit of Necker-Enfants Malades hospital of Paris, two from the Pediatrics Departments of Rennes and Marseille hospitals in France overseen by the Metabolism Unit of Necker-Enfants Malades hospital, and four from the Pediatric Endocrinology Department of the Royal Manchester Children’s Hospital in the United Kingdom were recruited for the study. The characteristics of the patients are shown in Table 1. Patients were between 1 and 57 months old at the initiation of mTOR inhibitor treatment. All patients had severe CHI diagnosed between birth and 13 months. Two children presented with seizures (patients number 6 and number 10). All had excessive insulin secretion (5.5–121 mIU/L, a lower limit of detection at 2 mIU/L) at the time of hypoglycemia. No syndromic CHI was identified in the cohort that consisted of three boys and seven girls. Three patients (patients numbers 8–10) were born to consanguineous parents. Two patients were siblings (patients numbers 3 and 4). All patients were unresponsive to medical treatment and subsequently required a high carbohydrate diet with parenteral and/or enteral feeding. None in the French cohort (patients numbers 1–6) required iv dextrose or glucagon infusion; however, all but one were given continuous enteral feeds with maximum fasting tolerance of 4.5 hours. All four patients from the United Kingdom (patients numbers 7–10) required iv glucose as well as enteral feeds with high-carbohydrate content. One patient required continuous glucagon infusion to achieve euglycemia. Patients numbers 7–10 had minimal fasting tolerance prior to sirolimus treatment. Medical therapy and supporting glucose requirements at study entry are shown in Table 2. 18F-DOPA PET scanning was performed in patients number 3, 5, and 7, which excluded focal CHI. Other children in this cohort had genetic etiology commensurate with diffuse CHI, whereby a 18F-DOPA PET scan was not required routinely in these children.
Patients Characteristics and Glycemic Support Before mTOR Inhibitors
| Patients | Sex | Gestational Age, wk | Birth Weight, g (Percentile) | Genetic Characteristics | Age at Diagnosis, d |
|---|---|---|---|---|---|
| 1 | Male | 36 | 3330 (92) | 2 mutations in ABCC8 | 1 |
| 1 maternally inherited: p? (c.4414G>A)a | |||||
| 1 nonmaternally inherited: p.Arg598* (c.1792C>T)b | |||||
| 2 | Female | 38 + 5 | 4410 (99) | 2 mutations in ABCC8 | <1 |
| 1 maternally inherited: p.Tyr512* (c.1536C>G) | |||||
| 1 paternally inherited: p.? (c.3992 − 3 C>G) | |||||
| 3 | Female | 35 + 5 | 3070 (90) | 1 mutation in ABCC8 | 1 |
| Maternally inherited: p.Met1252fs (c.3754_3755delAT) | |||||
| 4 | Male | 37 | 3675 (94) | 1 mutation in ABCC8 | 3 |
| Maternally inherited: p.Met1252fs (c.3754_3755delAT) | |||||
| 5 | Male | 38 + 2 | 4050 (90) | 1 mutation in ABCC8 | <1 |
| de novo: p.Asp1506Glu (c.4518C>G) | |||||
| 6 | Female | 38 | 3870 (96) | 2 mutations in KCNJ11 | <1 |
| 1 maternally inherited: p.Arg176His (c.527G>A) | |||||
| 1 paternally inherited: p.Leu157Phe (c.469C>T) | |||||
| 7 | Female | 36 | 2.550 (50) | No mutation in ABCCB, KCNJ11, GCK, HADH, GLUD1, HNF4A | 13 mo |
| 8 | Female | 39 | 3.400 (75) | 1 homozygous mutation in ABCC8 | 1 |
| 1 maternally inherited: p.? (c.148 + 1G>A) | |||||
| 1 paternally inherited: p.? (c.148 + 1G>A) | |||||
| 9 | Female | 33 | 2.160 (75) | 1 homozygous mutation in ABCC8 | 1 |
| 1 maternally inherited: p.? (c.1467 + 5G>A) | |||||
| 1 paternally inherited: p.? (c.1467 + 5G>A) | |||||
| 10 | Female | 37 | 3.820 (99) | 1 homozygous mutation in ABCC8 | 1 |
| 1 maternally inherited: p.Glu786del (c.2356_2358del) | |||||
| 1 paternally inherited: p.Glu786del (c.2356_2358del) |
Mutation on a splice site that has been previously reported as a missense, p.Asp1472Asn.
Paternal DNA was not available; therefore, it was presumed paternally inherited.
Medical Therapy and Supporting Glucose Requirement at Study Entry
| Patients | Diazoxide, mg/kg · d | Somatostatin Analogs, μg/kg · da | Glucagon, μg/kg · h | Glucose Infusion Rate, mg/kg · minb | Intravenous Fluids, mg/kg · min | Enteral Feeding, mg/kg · min | Duration of Fasting Before mTOR Inhibitor |
|---|---|---|---|---|---|---|---|
| 1 | — | 18 | — | 6 | — | 6 (overnight) | 4 h 30 min |
| 2 | 6 | 66 | — | 4.5 | — | 4.5 | <1 h |
| 3 | 6 | 23 | — | 6 | — | 6 | 2 h |
| 4 | 11 | 40 | — | 6.4 | — | 6.4 | 3 h |
| 5 | 6 | 60 | — | 4.6 | — | 4.6 | 1 h 15 min |
| 6 | 8 | 50 | — | 8.4 | — | 8.4 | <1 h |
| 7 | — | 11 | — | 7.5 | 7.5 | Solids | <1 h |
| 8 | — | 20 | 7.5 | 10.6 | 2.2 | 8.4 | <1 h |
| 9 | — | 20 | — | 16.7 | 13.3 | 3.4 | <1 h |
| 10 | — | 20 | — | 15.9 | 6.6 | 9.3 | <1 h |
— indicates none.
Somatostatin analogs were octreotide (given as micrograms per kilogram per day) or somatuline autogel (given as milligrams per month expressed as micrograms per kilogram per day).
Glucose infusion rate was calculated from glucose content in infusion fluids and milk feed. Additional glucose in solid food was not counted. Glucose infusion rate in patient 7, a nonresponder to sirolimus, was calculated when she was on full iv fluid treatment.
Genetic basis of CHI, human transcriptome analysis, and cell proliferation
Genomic DNA was extracted by standard methods. The coding regions and conserved splice site of ABCC8 (NM_001287174.1) and KCNJ11 (NM_000525.3) genes were amplified by PCR assay and sequenced as per the protocol at the individual CHI centers. Diffuse CHI was diagnosed on the basis of 18F-DOPA PET scanning, maternal heterozygous recessive mutations, homozygous and compound heterozygous mutations in ABCC8/KCNJ11 genes, and standard histopathological criteria (3, 21, 22). Affymetrix human transcriptome arrays (HTA 2.0) were used on total RNA extracted from tissues of an additional three CHI patients after surgery for focal CHI to assess differential gene expression between disease and normal tissue. Data were normalized using the robust multiarray average and gene level summaries assessed in Qlucore Omics Explorer version 3.2 (Qlucore). Further quality control was performed using Isomap multidimensional analysis with cross-validation within Qlucore Omics Explorer. Differential gene expression between pancreatic lesions and matched normal pancreatic tissue was assessed using a paired Student’s t test. A network model of protein/protein interactions related to the differential gene expression was generated using the BioGRID database (version 3.4.138). Network topology was assessed using the Network Analyzer plugin within Cytoscape (version 2.8.3) as previously described (23). Network modules and their hierarchy based on network centrality were characterized using the Moduland algorithm. Pathway ontology associated with differential gene expression was analyzed using Ingenuity Pathway Analysis (QIAGEN). Pancreatic proliferation was assessed by immunostaining with Ki67 and high content analysis in pancreatic tissue (n = 18 053–30 144 cells) and islets (n = 2863–4171 cells) in two patients after surgery using methods previously described (23). For comparative purpose we also include data from three age-matched control pancreas and five CHI tissues from patients not receiving sirolimus therapy (23).
Treatment
Nine patients received sirolimus at an initial dose of 0.5–1 mg/m2 of body surface area per day (milligrams per square meter per day) between ages 1 and 57 months. Sirolimus (Rapamune; Pfizer) was given as syrup in a concentration of 1 mg/mL. One patient at age 2 years received everolimus at an initial dose of 2.5 mg/m2 · d (Table 3). Everolimus (Certican; Novartis) was dispensed in tablets in a strength of 0.25, 0.5, and 0.75 mg. Medication dosage was gradually increased with the goal of reaching a serum trough level (measured 5 d after each change in dosage) of 5–15 ng/mL for sirolimus and of 3–8 ng/mL for everolimus. Once serum trough levels were achieved, iv glucose was weaned to achieve euglycemia with enteral nutrition only. Other medications were also weaned to a point at which euglycemia could be maintained safely. Patients were then tested for fasting tolerance. This was conducted as per institutional protocol for 6 hours to test whether euglycemia (>3.5 mmol/L in the United Kingdom; > 3 mmol/L in France) was maintained and whether ketogenesis was achieved. Patients were regularly monitored for blood counts, fasting lipids profile, glucose profile, and serum mTOR inhibitor trough levels as described in the Supplemental Materials. Patients were assessed daily for adverse events during an in-patient stay and monthly during outpatient monitoring. All studies were carried out in accordance with ethical approval, national codes of practice, and informed consent.
mTOR Inhibitor Treatments, Response, Duration of Fasting, and Clinical Adverse Events
| Patients | mTOR Inhibitor | Age at Start, mo | Maximal Dosage, mg/m2 · d | Trough Level, μg/L (Mean) | Duration of Treatment, mo |
|---|---|---|---|---|---|
| 1 | Sirolimus | 28 | 2.1 | 3.1–11.4 (6.6) | 4 |
| 2 | Sirolimus | 40 | 5.9 | 3–11.8 (6.7) | 16; continuing treatment |
| 3 | Sirolimus | 27 | 3.7 | 4.4–23.5 (11.9) | 6 |
| 4 | Sirolimus | 7 | 3.2 | 4.4–4.8 (4.6) | 5 |
| 5 | Sirolimus | 57 | 3.5 | 1.6–10 (6.8) | 15; continuing treatment |
| 6 | Everolimus | 24 | 9.8 | 2.2–28.7 (9.9) | 7 |
| 7 | Sirolimus | 14 | 1 | 9.1–11.5 (10.3) | 1 |
| 8 | Sirolimus | 1 | 2.3 | 3.2–16.5 (8.9) | 3 |
| 9 | Sirolimus | 1 | 1.4 | 7–19 (14.1) | 4; continuing treatment |
| 10 | Sirolimus | 1 | 1.2 | 8.7–15.3 (11.2) | 1 |
Results
Molecular genetic testing (Table 1)
Eight patients had mutations in ABCC8 (patients 1–5 and 8–10), including two siblings (patients 3 and 4) (Table 1). Two patients (patients 1 and 2) were compound heterozygotes, and three had homozygous mutations (patients 8–10). A single maternally inherited mutation was identified in patients 3 and 4 (siblings), but imaging performed in patient 3 suggested diffuse CHI. Finally, one patient (patient 5) had a de novo pathogenic heterozygous mutation (24).
Most ABCC8 mutations were truncating (p.Arg598*, p.Tyr512*, p.Met1252fs) or were predicted to alter splicing (c.4414G>A, c.3992–3C>G, c.148+1G>A, c.1467+5G>A).
Furthermore, a cousin of patient 8, also homozygous for the same novel ABCC8 splice site mutation, had diffuse CHI on histology after subtotal pancreatectomy, further establishing the pathogenicity of c.148+1G>A.
Previous functional analyses have demonstrated the pathogenicity of the ABCC8 missense mutations (p.Asp1472Asn [25], p.Asp1506Glu [24]). The p.Glu786del mutation, which deletes a single amino acid conserved in all vertebrate orthologs, has been identified in two previously reported homozygous cases (26, 27).
One patient had a compound heterozygous KCNJ11 mutation (patient 6), both allelic mutations being novel. Bioinformatics indicated probable pathogenicity for the substitutions, substantiated by clinical evidence of severe disease.
Finally, in one child, no mutation was found in ABCC8, KCNJ11, GCK, HADH, GLUD1, and HNF4A genes by Sanger sequencing and targeted next generation sequencing.
Treatment with sirolimus/everolimus: response and outcomes
Sirolimus was given at the mean dose of 1.85 mg/m2 · d (maximum dose at 5.9 mg/m2 · d) for a period ranging between 1 and 16 months. Sirolimus trough levels (Table 3) exceeded the expected upper limit (15 ng/mL) in four patients; one patient (patient 8) required a blood transfusion (hemoglobin 72 g/L), but no adverse events were recorded in others. Sirolimus was discontinued because of its ineffectiveness in achieving euglycemia in six patients (60%).
Everolimus was given to patient 6 in a mean dose of 7.7 mg/m2 · d (maximal dose at 9.8 mg/m2 · d) and was stopped after 7 months because euglycemia was not achieved despite exceeding upper limits of drug trough levels.
The glycemic responses to mTOR inhibitor treatment are shown in Table 4. Patient 2 had increased fasting tolerance at month 2 (from 30 min to 4 h), allowing her to discontinue diurnal enteral feeding. Thereafter, at month 8 of sirolimus, she was able to fast 10 hours so that her overnight enteral feeding and diazoxide were discontinued.
Response to Treatment, Duration of Fasting, and Clinical Adverse Events
| Patients | Response to Treatment | Duration of Fast With mTOR Inhibitor Treatment | Adverse Events |
|---|---|---|---|
| 1 | None | 4 h 30 min | Stomatitis |
| 2 | Month 2: increased duration of fasting | 10 h | Stomatitis |
| Month 3: decreased diazoxide posology + diurnal enteral feeding discontinuation | |||
| Month 8: diazoxide and enteral feeding discontinuation | |||
| 3 | None | 3 h | None |
| 4 | None | 3 h | None |
| 5 | Month 5: increased duration of fasting | 4 h 30 min | Stomatitis |
| Month 12: decreased octreotide posology + diurnal enteral feeding discontinuation | |||
| 6 | None | <1 h | Varicella |
| 7 | None; subtotal pancreatectomy | <1 h | Stomatitis/rash/diarrhea/sepsis |
| 8 | Day 12: discontinuation of glucagon | 4 h | Gut dysmotility, EPI, severe anemia |
| Week 3: discontinuation of iv fluids | |||
| Week 5: increased fasting tolerance to 4 h | |||
| Month 3: recurrent hypoglycemia; subtotal pancreatectomy | |||
| 9 | Month 1: discontinuation of iv fluids + increased fasting tolerance to 4 h | 4 h | Gut dysmotility, EPI |
| 10 | Day 15: discontinuation of iv fluids + increased fasting tolerance to 3 h | 3 h | Sepsis, postsurgery recurrent sepsis |
| Week 4: recurrent hypoglycemia, subtotal pancreatectomy |
Abbreviation: EPI, exocrine pancreatic insufficiency assessed by low levels of fecal elastase.
Sirolimus was beneficial partially or wholly in four other patients (patients 5 and 8–10), in whom an increased duration of fasting was tolerated. In patient 5, octreotide dose was reduced and diurnal enteral feeds were discontinued after 1 year of treatment. In patient 9 iv dextrose was discontinued and fasting tolerance was increased to 4 hours after 1 month of treatment. Initial glycemic improvement was observed in patients 8 and 10; glucagon was discontinued in patient 8 and iv fluid therapy was discontinued in patient 10. However, both patients relapsed into recurrent hypoglycemia despite sirolimus levels being in the therapeutic range.
Patients 1, 3, 4, and 7 did not respond to sirolimus. Patients 1, 3, and 4 had sustainable euglycemia after sirolimus discontinuation, with a continuous enteral feeding, diazoxide continuation, whereas the octreotide dose was increased further. In these patients, subtotal pancreatectomy was not undertaken. Patient 7 did not achieve safe and sustainable euglycemia for home management. Patients 7, 8, and 10 underwent subtotal pancreatectomy to improve glucose profiles after 1, 1.5, and 3 months of sirolimus therapy, respectively. Sirolimus was stopped for 2 weeks in patient 7 and 4 weeks in patients 8 and 10. Patient 7 remains euglycemic (fast tolerance 8 h) 1.5 years after surgery with no requirement for pancreatic exocrine supplements. Patient 8 also remains euglycemic (fast tolerance 6 h) 1 year after surgery with occasional hypoglycemia during illness episodes. She continues to have pancreatic exocrine insufficiency and requires supplements with main meals. Patient 10 has also undergone subtotal pancreatectomy after the failure of sirolimus therapy and is euglycemic after surgery. Three weeks after discontinuing sirolimus treatment, she developed severe central venous catheter sepsis and pulmonary consolidation requiring intensive care support with conventional and oscillatory ventilation and inotropic support.
The only patient on everolimus (patient 6) did not improve her glucose profile during the treatment and continued to have persistent hypoglycemia. She is still on medical treatment (diazoxide and octreotide) and continuous enteral feeding. Therefore, in this group of patients with severe CHI, mTOR inhibitors were clinically useful in only three patients (30%).
Adverse events from treatment with mTOR inhibitors
For a cumulative period of 61 months and a longest duration of 16 months of treatment, adverse events are shown in Table 4. Stomatitis was the most common adverse effect (40%). Although no serious adverse events were reported, two children (patients 7 and 10) had septicemia with infection in the central venous catheter for which sirolimus treatment was interrupted and eventually stopped. Another patient (patient 6) developed varicella zoster infection. In three patients (patients 7–9), bowel disturbances were noted. These included recurrent diarrhea and vomiting illnesses that were chronologically associated with sirolimus treatment and pancreatic exocrine insufficiency characterized by low fecal elastase levels prior to pancreatectomy.
Monitoring data (Table 5) show that three patients had mild neutropenia, one had severe anemia, and two had mild thrombocytopenia. Cholesterol levels were normal, but five patients (50%) had moderately high prefeed triglyceride levels. In one patient, the lipid profile was not assessed, but treatment was discontinued.
Monitoring Data in Follow-Up Assessments After mTOR Inhibitor Treatment
| Patients | White Blood Cells, g/L (Mean) | Neutrophils, g/L (Mean) | Hemoglobin, g/dL (Mean) | Platelets, g/L (Mean) | Cholesterol, mmol/L (Mean) | Triglycerides, mmol/L (Mean) |
|---|---|---|---|---|---|---|
| 1 | 9.7–18.6 (9.3) | 2.5–6.9 (4.7) | 10.6–12.2 (11.5) | 373–442 (403) | 4.81–5 (4.90) | 0,67 |
| 2 | 6.3–11.7 (8.6) | 1.9–6.4 (3.7) | 9.7–12 (10.7) | 140–305 (232) | 2.95–4.55 (3.55) | 0.48–2.33 (1.25) |
| 3 | 6.6–13.8 (10.5) | 1.5–4.8 (2.9) | 12–13.8 (12.6) | 171–242 (208) | 3.04–4.21 (3.59) | 0.49–1.32 (0.84) |
| 4 | 13.6–17.7 (16.1) | 2.5–5.3 (3.8) | 11.6–14 (12.3) | 298–469 (377) | 2.92–4.13 (3.63) | 0.75–3.15 (1.27) |
| 5 | 7.2–10.6 (8.9) | 1.8–4.4 (3.1) | 12.9–13.8 (13.4) | 278–459 (355) | 3.47–4.21 (3.73) | 0.40–1.61 (0.9) |
| 6 | 7.3–13 (9.8) | 1.8–5.6 (3.5) | 10.9–13.8 (11.8) | 112–516 (396) | 3.36–4.97 (4.07) | 0.49–2.67 (1.12) |
| 7 | 5.1–13 (7.23) | 1.3–8.1 (2.6) | 8.5–11.0 (9.4) | 191–336 (271) | — | — |
| 8 | 4.4–10.5 (7.4) | 0.8–5.1 (2.3) | 7.2–115 (9.1) | 353–737 (455) | 3.1–3.9 (3.64) | 0.8–2.7 (1.73) |
| 9 | 5.7–11 (7.5) | 0.7–2 (1.2) | 8.8–12 (8.7) | 252–570 (344) | 1.9–2.9 (2.46) | 0.5–0.7 (0.56) |
| 10 | 13.3–21 (16.7) | 1.6–4.4 (2.3) | 9.5–10.7 (10.2) | 409–637 (500) | 2.1–2.9 (2.5) | 1.1–1.5 (1.4) |
— indicates none.
Association of mTOR signaling with proliferation in CHI
In silico assessment of mTOR action in CHI
Differential gene expression between CHI pancreatic lesions and matched normal tissue was assessed in three patients, and 1967 genes had significant changes (P < .01, paired t test) (Figure 1A). mTOR gene expression was unchanged (P = .98) (Figure 1A), and there was borderline association of the mTOR pathway with differential expression associated with CHI (P < .03). mTOR protein/protein interactions were present within a network model of the differential gene expression associated with CHI. However, topological assessment using network degree as a measure of the number of interactions made by a particular protein demonstrated that these were peripheral to the main network and unlikely to be of functional relevance, (P < 2.2 × 10⁻¹⁶, odds ratio 0.094, 95% confidence interval 0.034–0.21, Fisher’s exact test). Thus, although mTOR was present in a hierarchy of core protein/protein interaction modules within the CHI network, it was only the 92nd gene module as ranked by network centrality. Weighted for the size of the networks that were compared, the mTOR-containing pathway had a degree contribution to the CHI network model 10-fold less than it does in the overall human interactome (Figure 1B).
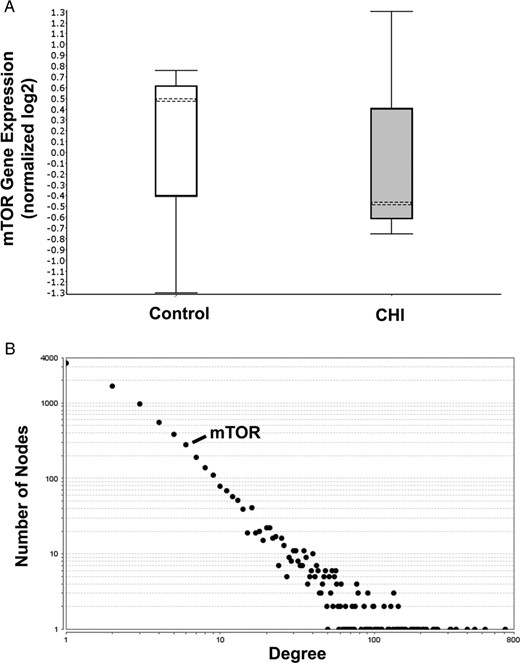
mTOR gene expression and inferred functional relevance as assessed by degree in a network model of CHI associated gene expression. A, Differential mTOR expression associated with CHI in comparison with matched normal tissue (n = 3). Box and whisker plot of mTOR expression (median marked as dotted line, whiskers represent upper and lower quartiles) is shown. Genes with differential expression in CHI (1967 genes, P < .01, paired t test) were used to generate a network model of inferred protein/protein interactions (8461 proteins and 23 579 interactions) using the BioGRID version 3.4.138 database. B, The number of connections (degree) made by each network element (protein); the overall distribution of degree is shown as a graph of log frequency and log degree. Ninety-seven pathways are represented by single points. Pathways with inferred function are toward the right-hand side of the plot. The position of mTOR is marked.
CHI-induced proliferation after treatment with sirolimus
To verify this interred pathway analysis, we used pancreatic tissue from two children (patient 7 and 8) to investigate the impact of continuous sirolimus treatment on the proliferative capacity of CHI pancreas, as shown in Figure 2. The incidence of cell proliferation is enhanced in diffuse CHI and remained high with no reduction after mTOR inhibitor treatment in the pancreas and islets (Figures 2 and 3). For patients 7 and 8, on average 6.57% of the pancreatic cells were proliferative compared with 2.81% ± 1.55% (mean ± SEM, n = 3 cases) of age-matched controls (n = 3 cases) and 6.4% ± 0.75% in CHI tissue not treated with sirolimus (n = 5 cases) (23) (Figure 3). The incidence of proliferation in islet cells for patients 7 and 8 was on average 1.81% compared with 1% ± 0.28% in control (n = 3) and 1.65% ± 0.23% in CHI tissue not treated with sirolimus (n = 5) (Figure 3).

Cell proliferation is not suppressed by sirolimus treatment. A, Ki67+ cells (arrowhead) were used to assess proliferation in the age-matched control (4 mo) and the pancreas of patient 8. The higher incidence of proliferating cells in CHI tissue was approximately 3-fold higher than controls. B, A comparison between the extent of Ki67+ cells (arrowheads) in the control (10 mo) and the pancreas of patient 7. In the control tissue, there were significantly fewer proliferating cells at 10 months compared with 4 months (panel A). However, in the CHI tissue, the rates of proliferation were 7-fold higher and too numerous to indicate by arrowheads. C and D, Data from the control and patient 7, which indicate that islet cell proliferation is not suppressed by sirolimus treatment. Scale bar (A), 200 μm; B, 100 μm; C, 50 μm.
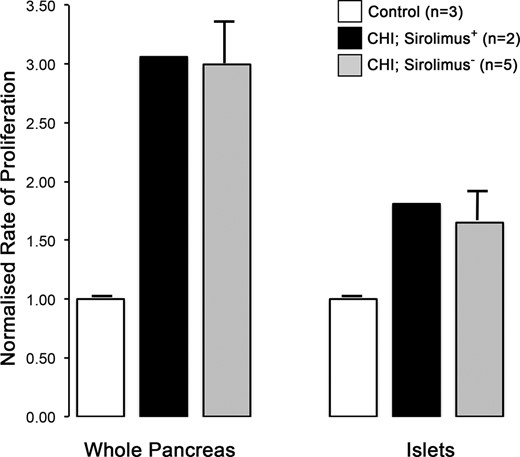
Quantification of proliferation in CHI tissue after sirolimus treatment. The rates of cell proliferation have been calculated from the fraction of Ki67+ cells and normalized to age-matched control tissue (n = 3 cases; pancreas, n = 23 673–66 083 cells; islets, n = 4672–4983 cells). Whole pancreas (n = 18 053 and 30 144 cells) and islet (n = 4171 and 2863 cells) data for patients 7 and 8 have been averaged. For comparison, data from age-matched CHI tissues not treated by sirolimus have also been included (n = 5 cases; pancreas, n = 28 903–78 262 cells; islets, n = 2657–5305 cells). Note how sirolimus treatment has no major impact on the enhanced rates of proliferation in the pancreas or islets in CHI tissue.
Discussion
The achievement of euglycemia is challenging in patients with severe CHI, who are unresponsive to complex medical treatment. Whereas subtotal pancreatectomy remains the procedure of choice after the failure of medical therapy, surgery is not completely curative and could still be associated with unsatisfactory neurodevelopmental outcomes. Therefore, there is a need for alternative treatments minimizing the requirement for irreversible pancreatic surgery, and the burden of demanding medical and nutritional intervention in severe CHI. Although sirolimus has been reported as successful in the management of four patients (8) and in sporadic case reports (28–32), there have been no systematic prospective studies of success/failure in cohorts of patients treated with mTOR inhibitors. Here we have described 10 patients treated in two specialized centers in France and the United Kingdom in which treatment success has been modest. We have also described for the first time one child unsuccessfully treated with everolimus, contrasting with successful treatment of insulinoma in adults (33).
Our cohort of patients is the largest series treated with sirolimus and monitored as per protocol and also includes a report of the first patient treated with everolimus. Whereas observational reports (8, 28, 30, 31) suggest satisfactory response to sirolimus and no adverse events, our experience suggests that drug response is only partial and has to be carefully considered for off-label prescribing. Our report provides a balanced perspective on the success of treatment with powerful immunosuppressant with potential harmful adverse events in young children.
We have strengthened our clinical observations with pancreatic tissue proliferation and network analysis to investigate the hypothesis that mTOR down-regulates the pathways of proliferation in the CHI pancreas. We have clearly demonstrated that mTOR pathways are not down-regulated, in keeping with nonresponse to sirolimus and the observation that proliferation remains high after treatment with sirolimus. However, one caveat in the analysis of pancreatic proliferation is that pancreatic tissue was not available in those with a response to sirolimus and that tissue analysis was not performed immediately after discontinuing sirolimus treatment.
The experience in two large centers clearly shows that mTOR treatment is ineffective in 70% patients and are accompanied by frequent adverse events (29, 34). Sirolimus is known to be a drug with a serious adverse event profile in older children and adults with no safety data in younger children, particularly neonates. Indeed, in one case report, sirolimus therapy achieved euglycemia but was complicated by life-threatening adverse events including sepsis and renal and hepatic failure, leading to the cessation of treatment (29). Long-term treatment with sirolimus has also been described to cause glucose intolerance by up-regulating hepatic gluconeogenesis, at the cost of excess lipid deposition in fatty tissues characterized by increasing levels of triglycerides and nonesterified fatty acid levels (35). Here we found that 40% of the cohort had moderate hypertriglyceridemia after less than 2 years of follow-up. The effects of long-term hepatic fatty changes at a young age remain to be evaluated but could be potentially detrimental to health.
In the original series of patients treated with sirolimus (8), one child with a homozygous mutation in an ATP-sensitive potassium channel gene responded to sirolimus but required additional octreotide treatment and dependence on gastrostomy feeding. In our cohort, three patients treated with sirolimus had homozygous mutations in ABCC8; in two patients treatment effect was partial, whereas in the other child, treatment was effective to achieve euglycemia. mTOR inhibitors were more effective in two other patients who were either heterozygous or compound heterozygous in ABCC8. However, all three patients successfully treated with sirolimus also required additional octreotide therapy. From our cohort it is not possible to identify which factors are associated with a greater probability of treatment success. Patient 5 with a de novo mutation in ABCC8 and diffuse CHI demonstrated response to sirolimus, implying that treatment in patients with dominantly inherited mutations may have a greater chance of success. In contrast in those with compound heterozygous mutations and homozygous mutations, two-thirds of patients failed to respond. Patient 7 without known mutations in ABCC8/KCNJ11 also did not show a response, implying that mutation status in ATP-sensitive potassium channel genes might impact on the severity of CHI but may not predict response to sirolimus treatment.
Chronic insulin resistance has been observed after the use of mTOR inhibitors in the prevention of renal graft rejection (36). Sirolimus is also associated with an increased risk of new-onset diabetes mellitus after transplantation (37). In those studies reporting successful treatment in severe hyperinsulism, the mechanism of action of sirolimus is proposed to involve a reduction in islet cell proliferation (30). This was recently supported by genomic data sets implicating the IGF-1/mTOR/Akt pathway with the pathophysiology of CHI (9). By contrast, we found no evidence for a reduction in either endocrine or exocrine cell proliferation in patients treated with sirolimus up to the point of surgery (Figure 2). A role for the IGF-1 receptor/mTORC2/Akt pathway in CHI is also questionable. In the study of Senniappan et al (9), CHI gene expression profiles were found to be enriched for proliferation and expansion, but this is not surprising because formalin-fixed neonatal tissue was compared with adult pancreas (age 29 y and 33 y). In our gene array data sets, mRNA expression profiles from CHI and age- and tissue-matched control pancreas were directly compared, and we found no significant involvement of the canonical mTOR signaling pathway (Figure 1). Genomic data sets can also be used to seed pathways of implied functional relevance using network biology, which detects the relationships between different biological components within a complex system (38). Network biology has been successfully used to investigate the pathobiology of enhanced cell proliferation in CHI (23); however, we found no impact of the mTOR pathway on the CHI disease interactome (Figure 1).
Conclusion
mTOR inhibitor treatment in severe diffuse CHI is successful only in a minority of patients and must used cautiously in CHI specialized centers as adverse events are frequent. The mechanism of action of mTOR inhibition in reducing insulin secretion is not clear in CHI but is unlikely to involve a decrease in islet cell proliferation.
Acknowledgments
We thank Dr Leo Zeef (Bioinformatics Core Facility University of Manchester) and Dr Andy Hayes (Genomic Technologies Core Facility, University of Manchester) for their analysis of gene expression in the CHI tissue. We are also grateful to the research nurses and clinical colleagues at Central Manchester University Hospitals National Health Service Trust and the Manchester Biomedical Research Centre and to the clinical colleagues at Necker Hospital (Paris), Sud Hospital (Rennes), and La Timone Hospital (Marseille, France).
This work was supported by the Northern Congenital Hyperinsulinism Service Charitable Fund (to M.J.D, I.B., and R.P.), the Association of Hyperinsulinisms (to J.-B.A. and P.d.L.), research and innovation supporting funds from Central Manchester University Hospitals and the University of Manchester (to M.J.D. and I.B.), the National Institute for Health Research (to M.J.D., I.B., and R.P.), and The Million Dollar Bike Fund Pilot Award MDBR-16–100-CHI (to M.J.D., I.B., and A.S.).
Disclosure Summary: The authors have nothing to disclose.
Abbreviations
- CHI
congenital hyperinsulinism
- 18F-DOPA
fluorine-18-dihydrophenylalanine
- mTOR
mammalian target of rapamycin
- PET
positron emission tomography.
