


It has been suggested that beta cell loss in type 2 diabetes (T2D) may be due to beta cell degranulation and/or altered cell identity. While shown to have a minor role in obese T2D, this has not been evaluated in lean T2D.
To establish the contribution of altered beta cell identity in lean T2D and, using a rodent model of lean T2D, whether changes in beta cell identity precede hyperglycemia.
We investigated the frequency of chromogranin A positive hormone negative (CPHN) and polyhormonal endocrine cells in pancreas from 10 lean nondiabetic and 10 lean T2D subjects and in pancreas from wild-type and human IAPP transgenic rats at the prediabetic and diabetic stages.
CPHN cells and polyhormonal-expressing cells were comparably increased in lean T2D and human IAPP transgenic rats, in the latter both before and at onset of diabetes. However, the extent of these cells could only account for approximately 2% of beta cell loss.
Degranulation and altered identity play at most a minor role in the beta cell deficit in lean T2D. Because the increase in CPHN and polyhormonal cells precede diabetes onset, these changes are likely a response to stress rather than hyperglycemia, and may reflect attempted regeneration.
Type 2 diabetes (T2D) is a clinical syndrome defined by hyperglycemia resulting from insufficient insulin secretion in the setting of insulin resistance, the defective insulin secretion not being due to the beta cell autoimmunity that defines type 1 diabetes. Beta cell failure in T2D likely has many different causes given the heterogeneity of the clinical presentation and course of T2D (1, 2). Hypotheses that have been posed to explain the deficit in beta cells in T2D include increased beta cell apoptosis mediated by protein misfolding and gluco- and/or lipotoxicity (3–5). Alternatively, it has been suggested that the apparent beta cell deficit may be due to beta cell transdifferentiation to other endocrine cell types or degranulation of beta cells to endocrine cells with no detectable hormone expression (6–8).
One aspect of the heterogeneity apparent in the clinical syndrome of T2D is that while in many individuals obesity precedes onset of diabetes, T2D also occurs in lean individuals (9, 10). Because the beta cell deficit in lean T2D (LT2D) in Caucasians (∼40%) is less than that in obese T2D (∼65%), the mechanisms subserving loss of beta cell function between these groups may differ (11). Therefore, although we recently established that neither degranulation or transdifferentiation of beta cells play more than a minor role in the beta cell deficit in obese individuals with T2D (12), the potential contribution of transdifferentiation or degranulation to the beta cell deficit in lean T2D has yet to be evaluated. We therefore now address that question in human pancreas of lean T2D vs nondiabetic controls in the present study.
In addition to addressing the potential numerical contribution of altered beta cell identity to the beta cell deficit in lean T2D, we also sought to understand if these alterations precede or are a consequence of the hyperglycemia that defines diabetes. It is not possible to obtain pancreas from humans in whom it is known would subsequently develop T2D. Therefore, to address the second question we turned to a rat model of T2D, the human IAPP transgenic (HIP) rat. The progression in this model from nondiabetic, but with detectable beta cell stress and impaired beta cell function, through to diabetes has been well-characterized (13, 14). Having established that with regard to beta cell degranulation/dedifferentiation this model is comparable to lean T2D in humans, we then examined pancreas from prediabetic animals to ascertain if the changes observed coincided with beta cell stress initiated by protein misfolding but before hyperglycemia, or developed later once glucose metabolism was dysregulated.
Materials and Methods
Human subjects
Sections of pancreas were obtained from the Mayo Clinic autopsy archives with institutional review board permission (#15-004992) from both Mayo Clinic and University of California, Los Angeles (UCLA). Two groups of adult human subjects were identified: 10 lean nondiabetic (LND) individuals and 10 age- and body mass index (BMI)-matched lean individuals with type 2 diabetes, all cases included being Caucasian. To be included, cases were required to have had 1) a full autopsy within 24 hours of death; 2) pancreatic tissue stored that was of adequate size and quality; and 3) no use of glucocorticoids. Cases were excluded if pancreatic tissue had undergone autolysis. Case subjects were identified based on these preferences in the Mayo Clinic autopsy database, and 4-μm sections of pancreas from the selected case subjects were obtained and made available to UCLA investigators in a manner coded to conceal the personal identity of the subjects. The LND and LT2D groups were matched for age (69.6 ± 3.3 vs 73.3 ± 4.5 years, LT2D vs LND, P = ns) and BMI (23.0 ± 0.5 vs 21.1 ± 0.8 kg/m2, LT2D vs LND, P = ns). The clinical characteristics of the human subjects are summarized in Table 1.
Clinical Characteristics of LT2D Subjects and LND Subjects
| LT2D | |||||
|---|---|---|---|---|---|
| Case ID | Age (y) | Sex | BMI | Cause of Death | Treatment |
| 1 | 71 | F | 24.1 | Staphylococcal endocarditis | Sulfonylurea |
| 2 | 82 | M | 24.6 | Ischemic heart disease | Insulin |
| 3 | 70 | F | 24.3 | Sepsis | Insulin |
| 4 | 88 | F | 22.7 | Ischemic heart disease | Diet |
| 5 | 57 | M | 21.9 | Congestive heart failure | Insulin |
| 6 | 57 | F | 19.3 | Pneumonia | Diet |
| 7 | 70 | M | 21.9 | Acute cerebral infarct | Insulin |
| 8 | 70 | M | 24.4 | Ischemic heart disease | Sulfonylurea |
| 9 | 73 | F | 24.3 | Ischemic heart disease | Diet |
| 10 | 58 | M | 22.9 | Pneumonia | Insulin |
| Mean | 69.6 | 23.0 | |||
| sem | 3.3 | 0.5 | |||
| LND | ||||
|---|---|---|---|---|
| Case ID | Age (y) | Sex | BMI | Cause of Death |
| 1 | 75 | F | 23.4 | Ischemic heart disease |
| 2 | 84 | M | 20.8 | Aspiration pneumonia |
| 3 | 75 | F | 19.1 | Acute liver failure, acetaminophen toxicity |
| 4 | 50 | M | 23.4 | Cardiac arrest |
| 5 | 89 | F | 18.6 | Massive intracerebral hemorrhage |
| 6 | 86 | M | 17.2 | Acute pneumonia |
| 7 | 52 | F | 23.6 | Arrhythmia |
| 8 | 84 | F | 18.8 | Cardiac arrest |
| 9 | 77 | M | 21.2 | Bronchopneumonia |
| 10 | 61 | F | 24.8 | Cardiac arrest |
| Mean | 73.3 | 21.1 | ||
| sem | 4.5 | 0.8 | ||
HIP rats
Sprague-Dawley rats transgenic for human IAPP (male, n = 4–6 each group) were used in this study as a model of LT2D that allowed evaluation of pancreas tissue preceding onset of diabetes, but at a time that there is already increased beta cell apoptosis and beta cell dysfunction (2–3 months) as well as at onset of diabetes (5–6 months). The generation and characterization of the HIP rats has been described previously (15). Rats were bred and housed individually throughout the study at the UCLA animal housing facility and subjected to a standard 12-hour light-dark cycle. The pancreatic sections of HIP rats studied here were obtained from a previously published study that reported the metabolic changes in the HIP rat vs WT controls (13, 14).
Pancreatic tissue processing and staining.
Pancreas was fixed in formaldehyde and embedded in paraffin for subsequent analysis as previously described (11). The 4-μm sections were stained for chromogranin A, insulin, glucagon, somatostatin, pancreatic polypeptide, and ghrelin. A standard immunohistochemistry protocol was used for fluorescent immunodetection of various proteins in pancreatic sections. One pancreas section obtained from the tail of pancreas was analyzed for each human subject. A complete cross-section of the entire pancreas was used for each rodent. Briefly, slides were incubated at 4° C overnight with a cocktail of primary antibodies prepared in blocking solution (3% BSA in TBST) at the following dilutions: mouse antiglucagon (1:1000, Sigma-Aldrich G2654); guinea-pig anti-insulin (1:100, Abcam7842), rat antisomatostatin (1:300, EMD Millipore MAB354), goat antipancreatic polypeptide (1:3000, 125 Everest Biotech EB06805), rat antighrelin (1:50, R&D Systems MAB8200), and rabbit antichromogranin A (1:200, Novus Biologicals NB120-15160). The primary antibodies were detected by a cocktail of appropriate secondary antibodies (Jackson ImmunoResearch) conjugated to Cy3 (1:200, for chromogranin A), fluorescein isothiocyanate (1:100 each, to detect glucagon, somatostatin, pancreatic polypeptide, and ghrelin) or Alexa 647 (1:100, to detect insulin). Slides were counterstained to mark the nuclei using a mounting medium containing 4′,6-diamidino-2-phenylindole (DAPI; Vectashield, Vector Labs), and viewed using a Leica DM6000 microscope (Leica Microsystems) and images were acquired using the 20× objective (200× magnification) using a Hamamatsu Orca-ER 132 camera (C4742-80-12AG, Indigo Scientific) and Openlab software (Improvision).
In this way, staining for the endocrine cocktail (glucagon, somatostatin, pancreatic polypeptide, and ghrelin, using fluorescein isothiocyanate as the fluorophore) could be distinguished from insulin staining (Alexa 647 being the fluorophore) and from chromogranin A (Cy3 being the fluorophore).
Morphometric analysis.
For the determination of pancreatic endocrine cells in the LND and LT2D human subjects and the rodent model of type 2 diabetes (HIP rats of 2–3 months, 5–6 months) plus their wild-type (WT) counterparts, 50 islets per sample (for human tissues) or 30–40 islets (for rat tissues) were imaged at 20× magnification. An islet was defined as a grouping of four or more chromogranin A positive cells. A cluster was defined as a grouping of three or fewer chromogranin A positive cells. Islets were selected by starting at the top left corner of the pancreatic tissue section and working across the tissue from left to right and back again in a serpentine fashion, imaging all islets in this systematic excursion across the tissue section. Analysis was performed in a blinded fashion (A.S.M.), and all chromogranin A positive hormone negative (CPHN) cells were confirmed by a second observer (A.E.B.). The endocrine cells contained within each islet were manually counted and the following data recorded: 1) the number of cells staining only for chromogranin A; 2) the number of cells costaining for the endocrine hormone cocktail and chromogranin A; 3) the number of cells costaining for insulin and chromogranin A; and 4) the number of cells costaining for insulin-endocrine cocktail-chromogranin A.
In the human studies, the number of endocrine cells counted within islets for the LT2D and LND groups was 1612 ± 132 and 1724 ± 200 cells per individual respectively. The number of endocrine cells counted in clusters in the LT2D and LND groups was 166 ± 28 and 73 ± 10 cells per individual. The mean number of CPHN cells per individual identified in islets from the T2D human subjects was 16.5 ± 2.7 cells per individual and nondiabetic human subjects was 8.3 ± 1.9 cells per individual. The mean number of CPHN cells per individual counted in clusters for the T2D human group was 20.3 ± 8.0 cells per individual and for the nondiabetic human group was 3.3 ± 0.6 per individual. At 20× magnification, using the Leica DM6000 with Hamamatsu Orca-ER camera and a 0.7× C-mount, each field of view was calculated to be 0.292 mm2. Within the fields imaged to obtain the 50 islets per subject, all clusters of endocrine cells (one, two, or three adjacent endocrine cells) were counted and recorded as outlined previously.
In rat studies, the mean number of endocrine cells counted within islets for rats was 1687 ± 223 vs 1543 ± 108, HIP vs WT, 2–3 months old and 1705 ± 170 vs 2331 ± 446, HIP vs WT, 5–6 months old. The mean number of CPHN cells counted within islets of rats was 74.5 ± 11.4 vs 38 ± 1.8, HIP vs WT, 2–3 months old and 61.7 ± 11 vs 28.25 ± 2.0, HIP vs WT, 5–6 months old. The mean number of CPHN counted in clusters in rats was 3.75 ± 2.7 vs 3.25 ± 0.5, HIP vs WT, 2–3 months old and 8.0 ± 2.0 vs 3.75 ± 1.5, HIP vs WT, 5–6 months old. All the data presented here represent mean ± SEM from two independent observations.
Statistical analysis
Statistical analysis was performed using the Student’s t test with GraphPad Prism 6.0 software (GraphPad Software). Data in graphs and tables are presented as means ± SEM. Findings were assumed statistically significant at P < .05.
Results
Composition of endocrine cells in islets in LT2D compared to LND controls
It has been proposed that the deficit in beta cell mass in T2D may be due to transdifferentiation of beta cells to other endocrine cell types or dedifferentiation of beta cells to endocrine cells expressing no known pancreatic endocrine hormone (CPHN cells) (6, 7, 12). To address the former first, we examined the composition of islets in LT2D and matched LND controls. As previously reported (11), there was a deficit in beta cells per islet section in LT2D (13.2 ± 2.0 vs 21.3 ± 2.4 cells/islet section, LT2D vs LND, P < .05) (Figure 1A). The sum of the other islet endocrine cells, evaluated using a cocktail of antibodies, was unchanged in LT2D (18.7 ± 1.8 vs 16.0 ± 2.5 cells/islet section, LT2D vs LND, P = .4) (Figure 1B). By implication, the deficit in beta cells in LT2D is not accounted for by transdifferentiation of beta cells to other endocrine cell types.
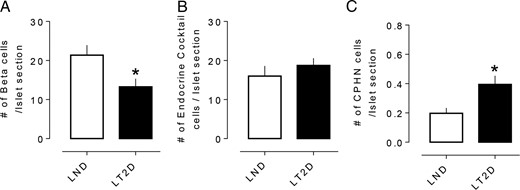
The number of hormone or nonhormone-expressing endocrine cells in islets in LND and LT2D. (A) The number of insulin expressing beta cells per islet section was decreased in LT2D cases. (B) No changes in number of islet hormone expressing endocrine cells per islet section other than insulin in LT2D subjects. (C) Number of CPHN cells per islet section was also increased in LT2D cases. A, B and C: white bars = LND subjects; black bars = LT2D subjects. All data were expressed as mean ± SEM, n = 10 per group, *P < .05.
While the frequency of nonhormone-expressing endocrine cells is increased in LT2D, the abundance of these cells cannot account for the deficit in beta cells in LT2D. To address the possibility that the deficit in beta cells in LT2D is due to dedifferentiation of beta cells to nonhormone-expressing endocrine cells (CPHN), we evaluated this in islets in LT2D compared to LND controls. An occasional CPHN cell was identified in islets from both LT2D and LND controls (Figure 2A and B). While the frequency of CPHN cells was low, they were increased approximately 2-fold in islets of LT2D (0.39 ± 0.05 vs 0.19 ± 0.03 cells/islet section, LT2D vs LND, P < .05) (Figure 1C). This difference accounts for approximately 2% of the deficit of beta cells per section in LT2D compared to LND controls, again implying that the deficit of beta cells in LT2D is not accounted for by dedifferentiation of beta cells to CPHN cells.
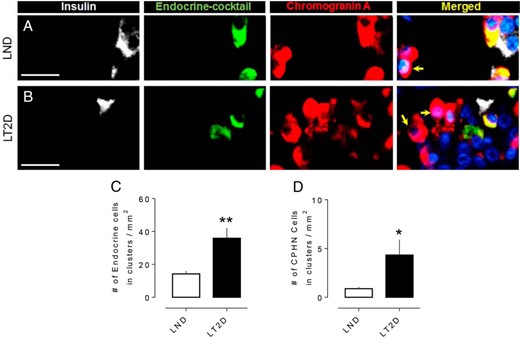
Examples of CPHN cells in pancreas from an LND (A) and an LT2D subject (B). Individual layers stained for insulin (white), endocrine cocktail (glucagon, somatostatin, pancreatic polypeptide and ghrelin) (green), chromogranin A (red), and DAPI (blue) are shown along with the merged (yellow) image. Arrows indicate CPHN cells. (C) The number of endocrine cells (both hormoneexpressing and nonhormoneexpressing) present in scattered clusters of endocrine cells is increased in LT2D. (D) The number of CPHN cells present in scattered clusters of endocrine cells is increased in LT2D. Scale bars, 50 μm (for A and B). (C and D) Data were presented as mean ± SEM, n = 10 per group; *P < .05; **P < .01.
Scattered endocrine cells, with a disproportionate increase in nonhormone-expressing cells, are more frequent in pancreas of T2D. In a prior study, we noted that isolated endocrine and CPHN cells scattered in the exocrine pancreas were more abundant in obese individuals with T2D (12), reproducing the pattern present in the late fetal and early postnatal pancreas in humans (12). We here note a similar pattern in LT2D with a 2.5-fold increase in scattered foci of pancreatic endocrine cells (35.9 ± 6.1 vs 14.1 ± 1.7 vs cells/mm2 of pancreas, LT2D vs LND, P < .01) (Figure 2C). Moreover, scattered CPHN cells were 4.7-fold more frequent in LT2D (4.3 ± 1.5 vs 0.9 ± 0.1 cells/mm2, LT2D vs LND, P < .05) (Figure 2D). This again raises the possibility that there may be attempted ongoing beta cell regeneration in LT2D since this pattern mimics that in late fetal and early natal human pancreas (12).
Progressive loss of beta cells in the HIP rat during development of diabetes follows a comparable pattern to humans with T2D. It is of interest to establish if the increase in CPHN in T2D precedes the onset of diabetes or occurs as a consequence of diabetes. Since it is not possible to evaluate the pancreas in humans through this transition, we evaluated the HIP rat model for this purpose because it has an islet phenotype that recapitulates most aspects of the islet in T2D, and has a predictable progression from nondiabetic with a normal beta cell mass but increased beta cell apoptosis and a defect in insulin secretion (age 2–3 months) to early borderline diabetes with a beta cell deficit comparable to that in humans by 5–6 months of age (13).
Consistent with prior studies, we here again note no beta cell deficit per islet section at 2–3 months of age (33.3 ± 3.0 vs 31.7 ± 4.1 beta cells/islet section, HIP vs WT, P = ns) but an approximate 45% deficit by 5–6 months of age coincident with diabetes onset (35.7 ± 5.4 vs 64.6 ± 9.0 beta cells/islet section, HIP vs WT, P < .05) (Figure 3C). Comparable to humans with T2D, the loss of beta cells in 5- to 6-month-old HIP rats or in the prediabetic state (2–3 months) was not accompanied by any increase in noninsulin expressing, endocrine cocktail expressing endocrine cells/islet section (14.1 ± 2.2 vs 14.2 ± 1.4, HIP vs WT, 2–3 months and 13.7 ± 2.5 vs 15.0 ± 2.7, HIP vs WT, 5–6 months endocrine cocktail expressing endocrine cells/islet section, P = ns) (Figure 3D).
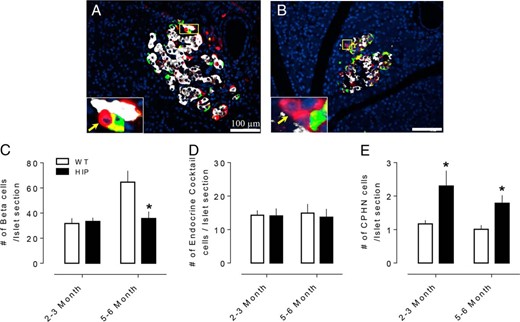
The number of hormone- or nonhormone-expressing endocrine cells in islets of WT and human HIP rats. Examples of CPHN cells in pancreas of 2- to 3-month (A) and 5- to 6-month (B) old HIP rat. Merged images of islet cells stained with insulin (white), endocrine cocktail (glucagon, somatostatin, pancreatic polypeptide, and ghrelin) (green), chromogranin A (red), and merged (yellow). Insets, higher magnification of endocrine cells where CPHN cells are indicated by arrows. (C) The number of insulin expressing beta cells was decreased in early onset diabetic (5–6 month old HIP rats) but not in nondiabetic (2- to 3-month-old HIP rats) compared to WT rats. (D) There was no change in the number of islet hormone expressing endocrine cells other than insulin in either 2–3 month or the 5–6 month in HIP rats compared to WT rats. (E) The number of CPHN cells is increased in both 2- to 3-month and 5- to 6-month-old HIP rats compared to WT rats. C, D, E: white bars: WT rats; black bars: HIP rats. All data were expressed as mean ± SEM, n = 4 per group, *P < .05.
We next sought to establish if the frequency of CPHN cells (in islets and in scattered cells) is more frequent in the HIP rat and, if so, if this precedes diabetes onset.
Increased CPHN cells in islets precedes diabetes onset in the HIP rat.
CPHN cells were identified in 2- to 3-month (Figure 3A) and 5- to 6-month-old (Figure 3B) WT and HIP rats. The frequency of CPHN cells per islet section was increased in HIP rats at 2–3 months of age (2.3 ± 0.45 vs 1.1 ± 0.1 cells/islet section, HIP vs WT, P < .05) preceding the loss of beta cell mass, and remained increased at 5–6 months of age (1.8 ± 0.2 vs 1.0 ± 0.1 cells/islet section, HIP vs WT, P < .05) with the loss of beta cells (Figure 3E). However, in contrast to humans with T2D, we did not identify either scattered CPHN cells or scattered endocrine cells in either WT or HIP rats.
When the beta cell deficit per islet is evaluated either in humans with LT2D (Figure 4A) or HIP rats (Figure 4B) side by side with the small increase in CPHN cells but lack of increase in other endocrine cells, it is clear that the deficit in beta cells in LT2D is not accounted for by de-or transdifferentiation.
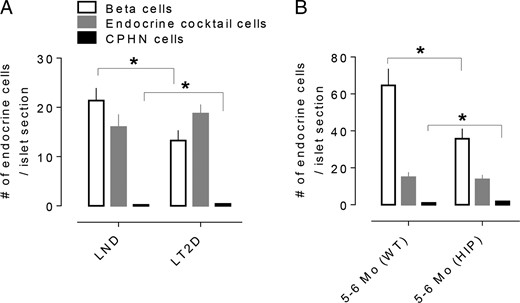
The impact of nonhormone-expressing endocrine cells on the deficit in beta cell mass in T2D is minimal. The number of CPHN cells/islet section is very small when compared with the number of beta cells/islet section in the LND, and the deficit in beta cells in the LT2D subjects cannot be accounted for by the increase in CPHN cells in type 2 diabetes. (A) There is an approximate 38% deficit in beta cells in the islets from the subjects with type 2 diabetes (13.2 ± 2.0 vs 21.3 ± 2.4 cells/islet section, LT2D vs LND, P < .05). The number of CPHN cells/islet section is increased in type 2 diabetes (0.39 ± 0.05 vs 0.19 ± 0.03 cells/islet section, LT2D vs LND, P < .01) but this increase does not account for the beta cell deficit seen in T2D. (B) A similar pattern of changes of islet endocrine cells was observed in HIP rats. The early onset of diabetes (5- to 6-month-old HIP rats) is associated with approximately 45% deficit in beta cells (35.7 ± 5.4 vs 64.6 ± 9.0, beta cells/islet section, HIP vs WT), which resembles that in the LT2D condition in humans. Again the number of CPHN cells in 5- to 6-month-old HIP rats is also increased (1.8 ± 0.2 vs 1.0 ± 0.1, cells/islet section, HIP vs WT). There was no change of islet endocrine cells expressing islet hormones other than insulin in both human and animal T2D; therefore, the beta cell deficit in T2D cannot be explained by conversion of beta cells to other endocrine cells. White bars: beta cells; gray bars: endocrine cocktail cells; black bars: CPHN cells per islet section. All data were expressed as mean ± SEM, n = 10 (human) and 4 (rat) per group. *P < .05.
While loss of beta cell mass in LT2D is not explained by deor transdifferentiation, there is long known and accumulating evidence that alterations in beta cell identity might contribute to beta cell dysfunction in residual beta cells in diabetes (16, 17). Since one of the ways this has recently been highlighted is to note beta cells that express other endocrine hormones (polyhormonal cells), we next evaluated the frequency of beta cells expressing other hormones in LT2D and the HIP rat.
Polyhormonal cells are more frequent in LT2D, and this increase precedes diabetes onset in the HIP rat. We used immunofluorescence staining of insulin and a cocktail of antibodies to noninsulin islet hormones (glucagon, somatostatin, pancreatic polypeptide, ghrelin) to identify insulin expressing cells that also express other islet hormones in LT2D (Figure 5A) and HIP rats (Figure 5B). Consistent with prior reports (17), these polyhormonal endocrine cells were more frequent in LT2D (2.4 ± 0.6 vs 0.6 ± 0.4 cells/mm2, LT2D vs ND, P < .05; Figure 5C). Polyhormonal endocrine cells were also more frequent in the HIP rat preceding loss of beta cells (2–3 months of age) (3.8 ± 1.1 vs 0.6 ± 0.2 cells/mm2 HIP rat vs WT, P < .05) and following loss of beta cells (5–6 months of age) (1.1 ± 0.1 vs 0.4 ± 0.2 cells/mm2 HIP rat vs WT, P < .01) (Figure 5D).
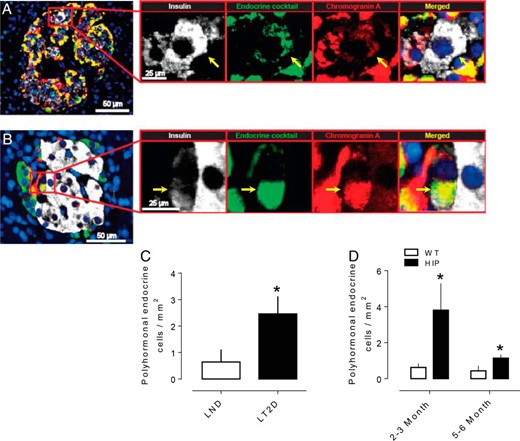
Increased number of polyhormonal endocrine cells in T2DM. Representative merged images of a pancreatic islet from a subject with T2DM (A) and HIP rat (B) showing polyhormonal cells. Insets in both panels show higher magnification of the indicated region in the low power images and the arrows show the cell that express insulin (white), endocrine cocktail (green), chromogranin A (red), and merged (yellow) with DAPI. The number of polyhormonal cells is increased in subjects with T2D (C) and in the T2D animal model (HIP rats) preceding (2–3 months of age) and following (5–6 months of age) diabetes (D). Scale bars, 50 μm (low-power images), 25 μm (insets). Data were presented as mean ± SEM, n = 4–6 each group *P < .05.
Taken together, these data indicate that the changes that have been ascribed to loss of differentiation in T2D also occur in the HIP rat model preceding a defect in beta cell mass or diabetes onset, but coincident with increased beta cell stress pathways induced by protein misfolding, and with impaired beta cell function and increased beta cell apoptosis.
Discussion
We conclude that neither beta cell dedifferentiation nor beta cell degranulation substantially contribute to the beta cell deficit in lean humans with T2D. These findings are therefore consistent with those in obese T2D (12) and T1D (18), and therefore differ from reports in some diabetic mouse models (6) that appear particularly prone to insulin degranulation.
Also, in common with recent studies of obese T2D and T1D, we identified an increase in endocrine and CPHN cells scattered in the exocrine pancreas in lean T2D (12, 18). While it is plausible that these are former beta cells that have dedifferentiated or transdifferentiated, that beta cells are not present scattered in a comparable abundance and pattern in adult nondiabetic pancreas argues against this (12). In contrast, we have noted abundant scattered endocrine and CPHN cells in exocrine pancreas in human fetal and neonatal pancreas (12), potentially suggesting that finding this pattern in both type 1 diabetes (T1D) and T2D may be indicative of attempted beta cell regeneration.
Of note, the human subjects in this study of lean T2D are older, by a mean of 9 years, compared with those in our previous study of obese T2D (12). This reflects the tendency of lean individuals to live longer than obese individuals, and therefore lean individuals available in an autopsy database are drawn from an older age group. It is possible that age and duration of diabetes may have an effect on the capacity for beta cell regeneration in the pancreas; however, we found no correlation between the frequency of nonhormone-expressing cells and age, BMI or duration of disease. One limitation of this study is the small number of individuals in the lean T2D cohort (n = 10), this being a reflection of the less frequent occurrence of T2D in lean individuals.
In addition to beta cell loss, alterations in beta cell identity have recently been emphasized as potentially of mechanistic importance in loss of beta cell function in diabetes (6–8). Using polyhormonal expression as a marker of altered beta cell identity, we reconfirm this finding in lean T2D with a comparable increase in the HIP rat model of T2D. The HIP rat is a model of T2D in which the islet phenotype closely reproduces that in humans with T2D with a comparable deficit in beta cells and islet amyloid derived from islet amyloid polypeptide (15). There is a deficit in beta cell function in the HIP rat that precedes diabetes onset and loss of beta cell mass but is coincident with the onset of increased beta cell endoplasmic reticulum stress and apoptosis (14). We show here that both the increase in CPHN cells and polyhormonal beta cells in the HIP rat is already present by 2–3 months of age, preceding diabetes onset or measurable loss of beta cell mass. This implies that stressed beta cells, in the HIP rat as a consequence of IAPP misfolding and cell dysfunction induced by IAPP toxic oligomers, provokes the alteration in beta cell identity and the increase in CPHN cells rather than hyperglycemia that develops from aged 5 months in this model (13).
We previously reported a similar frequency of islet cells immunoreactive for both insulin and glucagon in T2D (∼3%), but with a marked increase (∼17%) in patients that had been previously treated with a GLP-1 based drug for a year or more (19). Since the individuals that had been exposed to the same treatment did not have a defect in beta cell mass, it is plausible that the doubly immune-reactive beta cells for insulin and glucagon represent newly forming beta cells from an alpha cell precursor as has been confirmed by lineage tracing in mice, rather than the dedifferentiation of beta cells (20).
On the other hand, it is also possible that the insulin and glucagon expressing cells observed in both T2D in humans and in the HIP rat represent dedifferentiation of beta cells. A prior study (17) noted that double immunoreactive cells for insulin and glucagon were more frequent in T2D and identified most frequently proximate to the extracellular islet amyloid derived from IAPP, consistent with the HIP rat data reported here. In the same study, pancreas of obese nondiabetic nonhuman primates was evaluated in an effort to establish if changes in beta cell identity precede diabetes onset, but no alteration was observed. However, in nonhuman primates, as in humans, only a minority of obese individuals are vulnerable to develop T2D (21–23). Taken together, these studies suggest that altered beta cell identity occurs as a consequence of beta cell stress as opposed to hyperglycemia or obesity, and may represent newly forming beta cells or dedifferentiation of existing beta cells.
The defect in insulin secretion in T2D likely reflects both the deficit of beta cells in the setting of insulin resistance as well as beta cell dysfunction in the remaining cells and could be in part a manifestation of altered beta cell identity. A further complexity in humans with T2D is that some therapies (such as sulfonylureas) might favor beta cell degranulation (24) in contrast to others (insulin sensitizers and insulin) that may preserve insulin stores (25). Argument in favor of the importance of sufficient beta cell numbers is provided by the reproduction of the relationship between beta cell mass and loss of glycemic control when a beta cell deficit is induced by partial pancreas resection, pancreatitis, or toxin induction in humans (26, 27); nonhuman primates (28); dogs (29); pigs (30); or indeed by toxic IAPP oligomers in the HIP rat (13). Further, the defects in beta cell function in T2D were largely overcome by a single overnight induction of beta cell rest induced by somatostatin (31). Arguments in favor of the importance of the defect in insulin secretion in T2D is that it is detected long before disease onset (32–34), and in models of T2D that recapitulate the islet phenotype such as nonhuman primates and the HIP rat, beta cell dysfunction is detected early before loss of beta cell mass (13, 28).
Alterations in beta cell identity and increased CPHN cells have now been reported in T1D (18), lean and obese T2D (12) and a variety of rodent models (6), and now in the HIP rat model preceding onset of diabetes, but not in obese nondiabetic humans or nonhuman primates. The comparable findings in pancreas, resected at surgery, from brain dead organ donors or autopsy assures the findings are not an artifact of autopsy. Taken together, these findings also imply that beta cell stress, whether induced by autoimmunity, protein misfolding, and toxic IAPP oligomers or in some cases of deliberate beta cell genetic manipulation, may induce the changes most accurately described as altered beta cell identity, but in some cases as beta cell dedifferentiation. The assembled data do not support the concept that the defect in beta cell numbers in T2D is unimportant or that beta cell dedifferentiation is both specific to and primary as the defect in beta cell function leading to T2D.
Acknowledgments
The authors appreciate the editorial assistance of Bonnie Lui from the Larry L. Hillblom Islet Research Center at the University of California, Los Angeles.
This work was supported by funding the National Institutes of Health/National Institute of Diabetes and Digestive and Kidney Diseases Grant #DK077967 and Larry Hillblom Foundation Grant #2014-D-001-NET (to P.C.B.).
Author contributions: A.S.M.M., A.E.B., and M.C. performed the studies, undertook the microscopy, and performed the morphological analysis. A.S.M.M., A.E.B., S.D., P.C.B., and R.A.R. researched data, wrote the manuscript, reviewed the manuscript, edited the manuscript, and contributed to the discussion.
Disclosure Summary: The authors have nothing to disclose.
Abbreviations
- BMI
body mass index
- CPHN
chromogranin A positive hormone negative
- DAPI
4′,6-diamidino-2-phenylindole
- HIP
human IAPP transgenic rat
- LND
lean nondiabetic
- T1D
type 1 diabetes
- T2D
type 2 diabetes
- LT2D
lean type 2 diabetic
- WT
wild-type.
