


The risks of thyroid dysfunction after iodinated contrast media (ICM) exposure are largely unknown, especially in Asian populations.
The objective was to determine whether ICM exposure in patients with normal thyroid would increase the risk of thyroid dysfunction, including hyperthyroidism or hypothyroidism.
This was a retrospective cohort study including a random selection of 1 million people in 2005.
General population of Taiwan was studied.
Patients with ICM exposure were identified as cases, whereas patients without any ICM exposure were selected as controls.
Interventions included ICM exposure or nonexposure in normal thyroid function patients.
The primary endpoint was the composite risk of thyroid dysfunction associated with ICM exposure.
A total of 19 642 cases and 78 568 matched controls were recruited in this study. The mean ages of ICM exposure and nonexposure were 53.9 and 53.6 years, respectively, and mean follow-up durations were 4.1 and 5.6 years, respectively. After adjustment, patients with ICM exposure had a significantly higher risk of thyroid dysfunction (hazard ratio, 1.46; 95% confidence interval [CI], 1.29–1.66). In the subgroup analysis, the adjusted hazard ratios of hyperthyroidism and hypothyroidism compared with controls were 1.22 (95% CI, 1.04–1.44) and 2.00 (95% CI, 1.65–2.44), respectively.
ICM exposure was associated with higher risk of thyroid dysfunction, including hyperthyroidism and hypothyroidism.
The practice of modern medicine has come to rely heavily on imaging and interventional studies to diagnose and treat patients (1). In the United States, approximately 70 million computed tomography scans were arranged in 2007 (2). Important advances in medicine have allowed the incorporation of clinical imaging, such as computed tomography, iv pyelogram, cholangiogram, angiography, and coronary angiogram, into clinical practice, which has greatly improved disease diagnosis and patient health care. Unfortunately, imaging and interventional studies require iodinated contrast media (ICM) to improve the clarity of the image. ICM contains a large amount of iodine. In a single computed tomography examination, the patient may absorb between 100 and several thousand times the daily requirement for iodine. The nephrotoxicity effect of ICM has been widely studied (3); however, few studies have evaluated the effects of ICM on the normal thyroid gland in clinical practice.
The thyroid gland utilizes free iodide in serum to synthesize thyroid hormone for metabolic functions. Defense mechanisms of the normal thyroid gland after the rapid increase of serum iodide have been explained by the acute Wolff-Chaikoff effect (4) and regulation of the sodium-iodide symporter (5, 6). Previous studies showed that the effect of ICM exposure in the normal thyroid gland is minimal (7–9) and negligible (10) unless patients had a history of thyroid disease, such as Graves' disease, had a thyroid nodule, were elderly (11), lived in an iodine-deficient area (9, 12, 13), or had renal insufficiency (14). Moreover, patients with certain drug prescriptions such as amiodarone, lithium, and α-interferon were also considered to have an increased risk of thyroid dysfunction (15). Taiwan is an iodine-sufficient country because salt iodization has been mandatory since 1967 (16).
Few studies in the literature have evaluated the effect of thyroid function after ICM exposure, and most of those studies were relatively small cohort, case-control studies that were performed in Western countries (10, 15, 17). Therefore, we conducted a retrospective cohort study using data from Taiwan's National Health Insurance Research Database (NHIRD) to determine whether ICM exposure in normal thyroid patients increases the risk of thyroid dysfunction, including hyperthyroidism and hypothyroidism.
Subjects and Methods
This observational, retrospective cohort study was conducted using the Longitudinal Health Insurance Database 2005 dataset, which was obtained from Taiwan's National Health Insurance program. The dataset comprises a random selection of 1 million people, which is representative of 4% of the total population of 23 million people in Taiwan between January 1 and December 31, 2005. Patients were tracked from January 1, 2004, to December 31, 2010. Taiwan's National Health Insurance is a compulsory insurance system that is overseen by Taiwan's government, providing coverage for almost 99% of the entire population in Taiwan. This dataset comprises detailed information pertaining to patients' disease diagnosis, drug prescriptions, medical expenses, hospital admission, and discharge. A detailed description of patients' recruitment and sampling procedure is available on the NHIRD web site (18). All patients' data are scrambled and encrypted before release to the public for academic research. Data were extracted and analyzed by one independent reviewer. This study was reviewed and approved by the Institutional Review Board of Chung Shan Medical University Hospital, Taichung, Taiwan.
Patients with ICM exposure including computed tomography, coronary angiogram, iv pyelography, angiography, and cholangiography between January 1, 2005, and December 31, 2006, were identified and assigned to the study group, whereas patients without any ICM exposure during the entire study period served as controls. We followed the patients until December 31, 2010, with a total follow-up duration of 6 years. Because the aim of the study was to determine the effect of ICM exposure in normal thyroid patients, we further excluded patients with a history of thyroid disease (n = 1200) in the previous year before ICM exposure. Patients with any ICM exposure in the previous year of observation, ie, January 1 through December 31, 2004, were also excluded (n = 2026). In the non-ICM exposure group, individuals with any ICM exposure during the study period (n = 62 057), a history of thyroid disease in the previous year of observation (n = 13 113), ie, January 1 through December 31, 2004, and any missing data (n = 25) were excluded (Figure 1).
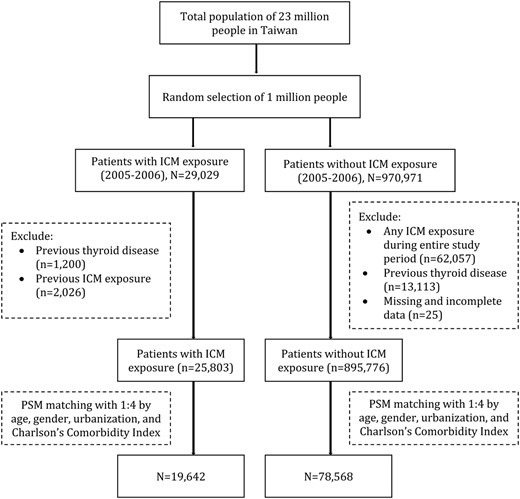
Flow diagram of assessment for eligibility.
PSM, propensity score matching.
Disease comorbidities that potentially increase the risk of thyroid dysfunction, such as diabetes mellitus, rheumatoid arthritis, depression, chronic kidney disease, anemia, Sjogren's syndrome, and systemic lupus erythematous (SLE), were identified, as well as drug prescriptions, such as amiodarone, β-blocker, carbamazepine, dexamethasone, interferon, IL-6, lithium, phenobarbital, phenytoin, propylthiouracil, and rifampicin. The Charlson comorbidity index was used to adjust the disease comorbidities between cases and controls (19). Four matched controls with propensity score matching of baseline characteristics, such as age, gender, urbanization, and disease comorbidities (Charlson comorbidity index), were selected for every ICM exposure case to minimize selection bias, thereby allowing a more accurate evaluation of the thyroid dysfunction after ICM exposure. We further designated the ICM exposure date as the index date and followed these patients until the first event of thyroid dysfunction, including hyperthyroidism or hypothyroidism, which served as the event date, whereas disenrollment, mortality, or December 31, 2010, was designated as the end date.
A number of comorbidities and covariates were identified by documented evidence of a diagnosis at the time of entry. Patients without a history of hyperthyroidism, hypothyroidism, prescription of antithyroid drugs, or T4 replacement, and with no history of thyroid operation were considered as having normal thyroid function. “Hyperthyroidism” was defined as an inpatient hospitalization with International Classification of Diseases, 9th Revision, Clinical Modification (ICD9-CM) code 242.x, or at least two outpatient physician visits with ICD9-CM code 242.x, or one outpatient physician visit with ICD9-CM code 242.x plus antithyroid drug prescription. “Hypothyroidism” was defined as an inpatient hospitalization with ICD9-CM code of 244.x, or at least two outpatient visits with ICD9-CM code 244.x, or one outpatient visit plus thyroid hormone drug prescription. Patients who fulfilled the criteria of either hyperthyroidism or hypothyroidism were considered to have thyroid dysfunction. A detailed description of the definitions of variables is provided in Supplemental Table 1. The primary endpoint in this study was the composite risk of thyroid dysfunction, including hyperthyroidism or hypothyroidism caused by ICM exposure.
Descriptive analysis was used to compare basic characteristics between ICM exposure and non-ICM exposure patients. Unpaired Student's t test and χ2 test were used to compare the parametric continuous and categorical data, respectively, between the two groups. Hazard ratio (HR) and Cox proportional hazards model with 95% confidence interval (CI) were used to analyze the data and to determine the risk of thyroid dysfunction. A two-sided P value < .05 was considered to be statistically significant. Cumulative hazard curves of the time to the first event of thyroid dysfunction were calculated using the Kaplan-Meier method. All statistical analyses were performed using the SPSS Statistical Package, version 18 (SPSS Inc).
Results
Table 1 shows the baseline demographic characteristics of normal thyroid patients with ICM exposure and nonexposed patients. A total of 25 803 ICM exposure patients and 895 776 non-ICM exposure patients were identified, whereas a total of 19 642 patients and 78 568 matched controls were recruited in this study. The mean ages of ICM exposure and nonexposure patients were 53.9 and 53.6 years, respectively, and mean follow-up durations were 4.1 and 5.6 years, respectively. After adjusting for all variables, no significant differences were observed between cases and controls. A total of 383 ICM exposure patients (cumulative risk, 1.9%) had thyroid dysfunction, compared with 1252 patients (cumulative risk, 1.5%) without ICM exposure. The number needed to harm was one for every 250 people. The mean durations for a thyroid dysfunction event since ICM exposure were 2 years and 3 years for ICM-exposed and nonexposed patients, respectively. Women and patients with older ages also had a higher risk of thyroid dysfunction.
Baseline Demographic Data of Study Population
| Unmatched | Matched | |||||||||
|---|---|---|---|---|---|---|---|---|---|---|
| Contrast Media (n = 25 803) | Noncontrast Media (n = 895 776) | P Value | Contrast Media (n = 19 642) | Noncontrast Media (n = 78 568) | P Value | |||||
| n | % | n | % | n | % | n | % | |||
| Age on index date, y | <.001 | .786 | ||||||||
| <20 | 1130 | 4.4 | 260 640 | 29.1 | 1123 | 5.7 | 4491 | 5.7 | ||
| 20–40 | 3534 | 13.7 | 317 354 | 35.4 | 3349 | 17.1 | 13 297 | 16.9 | ||
| 40–60 | 8580 | 33.3 | 229 028 | 25.6 | 7113 | 36.2 | 28 240 | 35.9 | ||
| ≥60 | 12 559 | 48.7 | 88 754 | 9.9 | 8057 | 41.0 | 32 540 | 41.4 | ||
| Gender | <.001 | .505 | ||||||||
| Female | 10 944 | 42.4 | 452 464 | 50.5 | 8875 | 45.2 | 35 708 | 45.4 | ||
| Male | 14 859 | 57.6 | 443 312 | 49.5 | 10 767 | 54.8 | 42 860 | 54.6 | ||
| Urbanization | <.001 | .908 | ||||||||
| Urban | 14 800 | 57.4 | 552 324 | 61.7 | 11 340 | 57.7 | 45 489 | 57.9 | ||
| Suburban | 7850 | 30.4 | 267 901 | 29.9 | 6025 | 30.7 | 24 031 | 30.6 | ||
| Rural | 3153 | 12.2 | 75 551 | 8.4 | 2277 | 11.6 | 9048 | 11.5 | ||
| Charlson comorbidity index | <.001 | .707 | ||||||||
| 0 | 7080 | 27.4 | 740 456 | 82.7 | 7080 | 36.0 | 28 321 | 36.0 | ||
| 1 | 10 993 | 42.6 | 138 233 | 15.4 | 10 541 | 53.7 | 42 009 | 53.5 | ||
| ≥2 | 7730 | 30.0 | 17 087 | 1.9 | 2021 | 10.3 | 8238 | 10.5 | ||
| Use of drugs | 9268 | 35.9 | 67 525 | 7.5 | <.001 | 6524 | 33.2 | 15 129 | 19.3 | <.001 |
| Diabetes | 5774 | 22.4 | 31 243 | 3.5 | <.001 | 3513 | 17.9 | 13 979 | 17.8 | .761 |
| Rheumatoid arthritis | 580 | 2.2 | 3929 | 0.4 | <.001 | 415 | 2.1 | 1254 | 1.6 | <.001 |
| Depression | 475 | 1.8 | 3671 | 0.4 | <.001 | 341 | 1.7 | 625 | 0.8 | <.001 |
| CKD | 1335 | 5.2 | 2336 | 0.3 | <.001 | 466 | 2.4 | 1076 | 1.4 | <.001 |
| Anemia | 2450 | 9.5 | 13 051 | 1.5 | <.001 | 1399 | 7.1 | 2487 | 3.2 | <.001 |
| Sjogren's syndrome | 221 | 0.9 | 1508 | 0.2 | <.001 | 151 | 0.8 | 370 | 0.5 | <.001 |
| SLE | 89 | 0.3 | 631 | 0.1 | <.001 | 73 | 0.4 | 163 | 0.2 | <.001 |
Abbreviation: CKD, chronic kidney disease. Use of drugs: amiodarone, β-blocker, carbamazepine, dexamethasone, interferon, IL-6, lithium, phenobarbital, phenytoin, and rifampicin.
Table 2 shows the results of the Cox proportional hazard model for normal thyroid patients with ICM exposure and nonexposure. After adjusting for all variables, patients with ICM exposure had a significantly higher risk of thyroid dysfunction (HR, 1.46; 95% CI, 1.29–1.66) compared with that of patients in the non-ICM exposure group. In the subgroup analysis, the adjusted HRs of hyperthyroidism and hypothyroidism compared with controls were 1.22 (95% CI, 1.04–1.44), and 2.00 (95% CI, 1.65–2.44), respectively. Use of specific drugs (described above) also increased the risk of overall thyroid dysfunction (HR, 1.45; 95% CI, 1.28–1.63), as well as hyperthyroidism (HR, 1.47; 95% CI, 1.26–1.70) and hypothyroidism (HR, 1.44; 95% CI, 1.19–1.74). Interestingly, most thyroid-related comorbidities did not increase the risk of thyroid dysfunction, except for anemia, which increased the risk of overall thyroid dysfunction (HR, 1.28; 95% CI, 1.02–1.60), and SLE, which increased the risk of hypothyroidism (HR, 2.57; 95% CI, 1.05–6.28). Furthermore, patients with a higher Charlson comorbidity index had a higher risk of thyroid dysfunction.
Cox Proportional Hazard Model to Evaluate the Risk of Thyroid Dysfunction in ICM Exposure Patients
| Overall Thyroid Dysfunction | Hyperthyroidism | Hypothyroidism | ||||||||||
|---|---|---|---|---|---|---|---|---|---|---|---|---|
| HRa | P | 95% CI | HRa | P | 95% CI | HRa | P | 95% CI | ||||
| Lower | Upper | Lower | Upper | Lower | Upper | |||||||
| Contrast media | ||||||||||||
| No | 1 | 1 | 1 | |||||||||
| Yes | 1.46 | c | 1.29 | 1.66 | 1.22 | b | 1.04 | 1.44 | 2.00 | c | 1.65 | 2.44 |
| Age on index date, y | ||||||||||||
| <20 | 1 | 1 | 1 | |||||||||
| 20–40 | 2.95 | c | 1.95 | 4.47 | 2.50 | c | 1.62 | 3.86 | 3.71 | c | 1.49 | 9.27 |
| 40–60 | 3.44 | c | 2.30 | 5.15 | 2.61 | c | 1.70 | 3.99 | 5.98 | c | 2.45 | 14.58 |
| ≥60 | 2.87 | c | 1.91 | 4.31 | 1.76 | b | 1.14 | 2.71 | 7.24 | c | 2.96 | 17.70 |
| Gender | ||||||||||||
| Female | 1 | 1 | 1 | |||||||||
| Male | 0.38 | c | 0.34 | 0.42 | 0.36 | 0.31 | 0.41 | 0.41 | c | 0.34 | 0.50 | |
| Urbanization | ||||||||||||
| Urban | 1 | 1 | 1 | |||||||||
| Suburban | 0.88 | b | 0.78 | 0.99 | 0.84 | b | 0.72 | 0.97 | 0.98 | 0.81 | 1.18 | |
| Rural | 0.84 | 0.71 | 1.00 | 0.84 | 0.67 | 1.04 | 0.89 | 0.67 | 1.17 | |||
| Charlson comorbidity index | ||||||||||||
| 0 | 1 | 1 | 1 | |||||||||
| 1 | 1.12 | 0.99 | 1.28 | 1.13 | 0.97 | 1.32 | 1.05 | 0.85 | 1.30 | |||
| ≥2 | 1.30 | b | 1.08 | 1.56 | 1.27 | b | 1.01 | 1.59 | 1.30 | 0.96 | 1.77 | |
| Use of drugs | 1.45 | c | 1.28 | 1.63 | 1.47 | c | 1.26 | 1.70 | 1.44 | c | 1.19 | 1.74 |
| Diabetes | 0.98 | 0.85 | 1.12 | 0.95 | 0.79 | 1.13 | 0.94 | 0.76 | 1.18 | |||
| Rheumatoid arthritis | 1.06 | 0.75 | 1.50 | 0.98 | 0.63 | 1.54 | 1.15 | 0.68 | 1.94 | |||
| Depression | 1.23 | 0.81 | 1.87 | 1.24 | 0.74 | 2.07 | 1.50 | 0.82 | 2.73 | |||
| CKD | 0.91 | 0.61 | 1.37 | 0.86 | 0.51 | 1.46 | 0.98 | 0.53 | 1.81 | |||
| Anemia | 1.28 | b | 1.02 | 1.60 | 1.26 | 0.96 | 1.67 | 1.31 | 0.92 | 1.86 | ||
| Sjogren's syndrome | 1.47 | 0.89 | 2.42 | 1.52 | 0.81 | 2.85 | 1.46 | 0.68 | 3.12 | |||
| SLE | 1.46 | 0.72 | 2.94 | 0.79 | 0.25 | 2.47 | 2.57 | b | 1.05 | 6.28 | ||
Abbreviation: CKD, chronic kidney disease. Use of drugs: amiodarone, β-blocker, carbamazepine, dexamethasone, interferon, IL-6, lithium, phenobarbital, phenytoin, and rifampicin.
Adjusted for age, gender, urbanization, Charlson comorbidity index, use of drug, diabetes, rheumatoid arthritis, depression, CKD, anemia, Sjogren's syndrome, and SLE.
P < .05.
P < .01.
Table 3 shows the risk of thyroid dysfunction after various model adjustments. Model 1 was adjusted for age, gender, and urbanization status; model 2 was adjusted for model 1 plus confounding disease and comorbidities; and model 3 was adjusted for all autoimmune diseases (ICD-9 CM codes of 710–739), given the fact that autoimmune diseases increase the frequency of associated thyroid diseases. The risks of thyroid dysfunction were significantly increased in patients with ICM exposure even after various adjustments. Figure 2 shows the Kaplan-Meier curves of normal thyroid patients with ICM exposure and nonexposure. The increase in the first event of thyroid dysfunction seemed to emerge after 1 month of ICM exposure, with continued divergence of the cumulative free-of-thyroid-dysfunction curves over the 6-year follow-up period.
HR of Contrast Media Versus Noncontrast Media According to Various Model Adjustments
| Contrast Media (Yes vs no) | Model 1 | Model 2 | Model 3 | |||||||||
|---|---|---|---|---|---|---|---|---|---|---|---|---|
| HR | P | 95% CI | HR | P | 95% CI | HR | P | 95% CI | ||||
| Lower | Upper | Lower | Upper | Lower | Upper | |||||||
| Thyroid dysfunction | 1.57 | b | 1.38 | 1.78 | 1.54 | b | 1.36 | 1.75 | 1.42 | b | 1.25 | 1.61 |
| Hyperthyroidism | 1.31 | b | 1.12 | 1.54 | 1.29 | b | 1.10 | 1.52 | 1.19 | a | 1.01 | 1.40 |
| Hypothyroidism | 2.17 | b | 1.79 | 2.63 | 2.12 | b | 1.74 | 2.57 | 1.93 | b | 1.58 | 2.35 |
Model 1, adjusted age, gender, and urbanization status; model 2, model 1 + Charlson comorbidity index + comorbidities; model 3, model 1 + all autoimmune diseases.
P < .05.
P < .01.
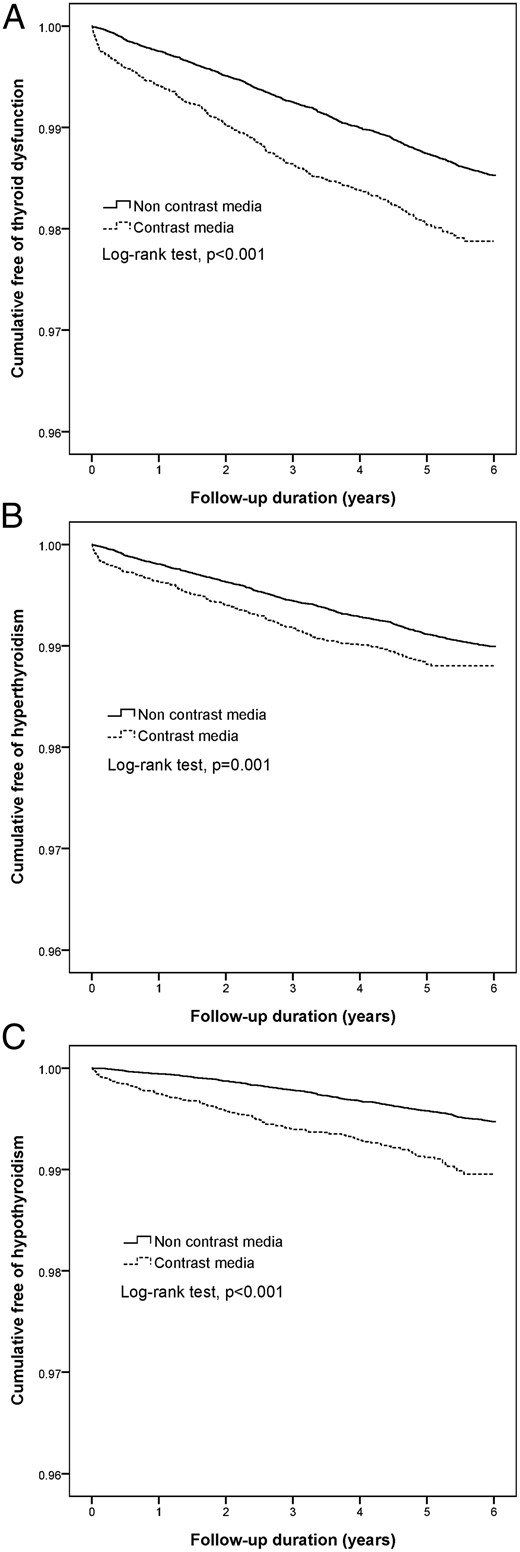
Kaplan-Meier analysis among ICM exposure and nonexposure in normal thyroid patients.
A, Overall thyroid dysfunction; B, hyperthyroidism; C, hypothyroidism.
Table 4 shows the risk of thyroid dysfunction, including hyperthyroidism and hypothyroidism, according to frequency of exposure to ICM. Patients with one exposure to ICM showed the highest risk of thyroid dysfunction compared with non-ICM exposure (HR, 1.86; 95% CI, 1.61–2.14). The risks of thyroid dysfunction were not linearly correlated with frequency of ICM exposure. Interestingly, patients with two or more exposures to ICM did not have an increased risk of hyperthyroidism. However, a correlation was still found between the frequency of ICM exposure and the risk of hypothyroidism.
HR of Thyroid Dysfunction According to Frequency of ICM Exposure
| ICM | Thyroid Dysfunction | Hyperthyroidism | Hypothyroidism | |||||||||
|---|---|---|---|---|---|---|---|---|---|---|---|---|
| HRa | P | 95% CI | HRa | P | 95% CI | HRa | P | 95% CI | ||||
| Lower | Upper | Lower | Upper | Lower | Upper | |||||||
| 0 | 1 | 1 | 1 | |||||||||
| 1 | 1.86 | c | 1.61 | 2.14 | 1.57 | c | 1.29 | 1.90 | 2.27 | c | 1.77 | 2.91 |
| 2 | 1.31 | b | 1.02 | 1.69 | 0.85 | 0.57 | 1.25 | 2.22 | c | 1.55 | 3.16 | |
| ≥3 | 1.15 | 0.93 | 1.44 | 0.88 | 0.64 | 1.20 | 1.50 | b | 1.07 | 2.11 | ||
Adjusted for age, gender, urbanization, Charlson comorbidity index, drugs, and comorbidities.
P < .05.
P < .01.
Discussion
This is the first population-based study to evaluate the risk of thyroid dysfunction in normal thyroid patients with and without ICM exposure in an Asian country. These findings suggest that normal thyroid patients with ICM exposure had an increased risk of thyroid dysfunction compared with that of patients with non-ICM exposure. The mean duration of thyroid dysfunction was 2 years after ICM exposure. Patients with a higher Charlson comorbidity index, Sjogren's syndrome, or SLE had a higher risk of thyroid dysfunction.
The mechanism of ICM-induced hyperthyroidism involves impairment of the acute Wolff-Chaikoff effect due to rapid iodine excess and influx into the thyroid gland. Excess iodine intake will result in transient or permanent hyperthyroidism (13, 20). The following diseases were reported to be associated with a higher risk of hyperthyroidism after ICM exposure: nodular goiter, Graves' disease, and long-standing iodine deficiency (12). In this study, we found a 22% increased risk of hyperthyroidism in ICM-exposed patients. Furthermore, there was a more than 2-fold increased risk of hyperthyroidism in patients between 20 and 60 years old compared with patients less than 20 years old. Interestingly, there appeared to be a protective effect in patients who lived in suburban and rural areas compared with patients who lived in urban areas.
With respect to the mechanism of ICM-induced hypothyroidism, the disorder probably occurs when the thyroid gland fails to escape from the acute Wolff-Chaikoff effect after excess iodine intake. The symptoms are usually mild and transient, and a wide variety of diseases were associated with hypothyroidism after ICM exposure: Hashimoto's thyroiditis, previously treated Graves' disease, thyroid operation, and postpartum thyroiditis (21). In this study, we found a 1-fold increased risk of hypothyroidism in ICM-exposed patients. Furthermore, older age was also linearly correlated with the risk of hypothyroidism. However, urbanization status did not significantly affect the risk of hypothyroidism during this study period. In contrast with findings reported by Rhee et al (17) that showed the median incidence of hyperthyroidism and hypothyroidism was 4 months and 1 year, respectively, our study showed that hyperthyroidism and hypothyroidism incidence persisted longer, with durations of 1.8 and 2.1 years, respectively.
The pharmacokinetics of all currently available ICM is similar. The half-life of ICM in patients with normal renal function was approximately 2 hours. Therefore, approximately 20 hours are required for the entire administrated ICM to be totally excreted (22). In normal thyroid patients, Lee et al demonstrated that the peak of urinary iodine concentration occurred at 1.1 weeks, and the mean time to normalization was 5.2 weeks after ICM administration (23). Interestingly, a prospective study by Padovani et al (24) in Brazil, which assessed athyreotic patients after ICM exposure, also found that urinary iodine concentration returned to baseline levels within 1 month.
In addition, we found that the frequency of ICM exposure was not linearly correlated with the risk of thyroid dysfunction; patients with two or more ICM exposures did not have an increased risk of hyperthyroidism, whereas patients with two or more ICM exposures had a higher risk of hypothyroidism. The exact mechanism of this phenomenon is not clearly understood. We hypothesize that the “stunning effect” plays a certain role in hyperthyroidism, which involves a reduction in the absorption of excess iodine in patients with subsequent iodine exposure. The mechanism of increased frequency of ICM exposure associated with hypothyroidism could also be explained by the failure to escape from the Wolff-Chaikoff effect, and certainly, the effect of radiation exposure related to hypothyroidism cannot be underestimated. Most of the time, ICM-related thyroid dysfunction was minimal and transient. Therefore, routine prophylactic medication was not recommended before ICM examination in clinical practice (7–11).
The strengths of this study included the large sample size that was obtained from Taiwan's NHIRD, the long duration of follow-up, the strict inclusion criteria, and the evaluation of thyroid dysfunction between normal thyroid patients with and without ICM exposure, which has not been previously investigated in an Asian population. However, there were also several limitations in the present study. First, it was not possible to collect data on the exact dose and detailed ICM osmolarity in every ICM-related examination. Second, because the NHIRD is primarily maintained for reimbursement, there are no detailed data on nutrition status and laboratory data such as TSH, free T4, T3, urinary iodine level, or antibody, which may potentially mask subclinical disease. Therefore, further large, randomized, controlled trials are needed to confirm the results of this study.
Because the dataset used in the present study was derived from the whole population without a sampling procedure, potential selection bias related to sampling error was not a concern. Although thyroid dysfunction might have been misclassified, the likelihood of such an occurrence was low because miscategorized diagnoses influence reimbursement, which would not be tolerated by hospitals and clinics. In fact, Taiwan's National Health Insurance program conducts stringent monitoring of claims to avoid overdiagnosis and prevent financial irregularities.
Finally, this study supports the evidence that ICM exposure is associated with higher risk of thyroid dysfunction in Asians, including hyperthyroidism and hypothyroidism. The number needed to harm for thyroid dysfunction was one in every 250 patients exposed to ICM. Although ICM-related imaging and interventional studies improve the disease diagnosis rate and quality of health, physicians should be aware of the complications of ICM and should apply it cautiously in clinical practice.
Acknowledgments
We thank Yu-Hsun Wang of Chung Shan Medical University Hospital for his support and contribution.
This work was supported by grants from the Chung Shan Medical University Hospital (CSH-2012-A-015).
We verified that all authors had access to the data and a role in writing the manuscript. C.-N.H., J.-Y.C., and E.K. designed the study. C.-N.H., J.-Y.C., E.K., Y.-S.Y., C.-H.P., and Y.-R.L. acquired, analyzed, and interpreted the data. E.K. wrote the manuscript. C.-N.H. and J.-Y.C. reviewed and edited the manuscript. C.-N.H. drafted the manuscript, is the guarantor of this work, and takes responsibility for the integrity of the data and the accuracy of the data analysis.
The interpretation and conclusions contained herein do not represent those of the Bureau of National Health Insurance, the Department of Health, or the National Health Research Institutes.
Disclosure Summary: The authors have nothing to disclose.
