


A potentially altered protein expression profile in orbital tissue from patients with thyroid-associated orbitopathy (TAO) is suspected.
To detect for the first time changes in proteomic patterns of orbital connective tissue in TAO and compare these with control tissue using mass spectrometry.
Proteomics cross-sectional, comparative study.
Two academic endocrine institutions.
A total of 64 orbital and peripheral adipose tissue samples were collected from 39 patients with TAO and 25 control subjects.
Samples were analyzed and identified using matrix-assisted laser desorption/ionization time-of-flight mass spectrometry technology.
Mean intensity values of all identified peptides per protein.
Thirty-one proteins were identified, of which 16 differentiated between controls and patients with TAO. Different protein patterns between orbital and peripheral adipose tissue were observed. Compared to controls, 10 proteins were markedly up-regulated (≥2-fold) in the orbital tissue of untreated patients: beta IV spectrin (6.2-fold), GTP binding G protein 2 (5.6-fold), POTE ankyrin domain family member F (5.4-fold), xylulokinase (4.1-fold), kinesin family member 1A and lipocalin 1 (both 3.6-fold), semicarbazide-sensitive metalloproteinase amine oxidase 3 and polymerase I transcript release factor (both 3.4-fold), cell-cycle protein elongin A binding protein 1 (3.3-fold), annexin A2 and cavin (both 3-fold), protein pointing to cell proliferation histone H4 (2.8-fold), and ADAM metallopeptidase with thrombospondin type 1 motif 14 (2.7-fold). The highest protein up-regulations were noted in the orbital tissue of medically untreated patients. Steroid therapy markedly reduced up-regulation of these proteins, foremost in nonsmokers.
Proteins involved in tissue inflammation, adipose tissue differentiation, lipid metabolism, and tissue remodeling were up-regulated in orbital tissue of untreated patients with TAO. Steroids decreased the expression of these proteins, whereas smoking attenuated such effect.
Thyroid-associated orbitopathy (TAO) is an inflammatory disorder of the orbit and is the most frequent extrathyroidal manifestation in patients with autoimmune thyroid disease (1). The orbital tissue is infiltrated by activated mononuclear cells releasing proinflammatory cytokines that stimulate target orbital fibroblasts to secrete hydrophilic mucopolysaccharides leading to edema, swelling of retrobulbar tissue, and proptosis (1, 2). Recent gene expression studies have shown that markers of adipogenesis (ie, the stearoyl-coenzyme A desaturase) and inflammation (cyclooxygenase-2) in orbital tissue are related to disease activity in TAO (3). Furthermore, immediate early genes, ie, the cysteine-rich, angiogenic inducer 61 (CYR61), are overexpressed in orbital tissue of patients with active TAO (4), and this is induced by smoking (5). Also, both smoking and gene polymorphisms of CYR61 rs 12756618 interact to increase the risk of TAO (6).
Proteomic analysis and mass spectrometry are ideally suitable for mass screening of peptides in body fluids and various tissues (7–9). However, very scarce data pertaining to proteomics in patients with autoimmune thyroid diseases are available. In a pilot project, we detected a set of protein biomarkers using the surface-enhanced laser desorption/ionization time-of-flight (TOF) mass spectrometry technology (10). Using these proteins, peptides were identified in the tear fluid of TAO patients with a specificity of 99% (11). Proteins were further characterized with matrix-assisted laser desorption/ionization (MALDI) TOF mass spectrometry (11). A subsequent proteomics and microarray study revealed a significantly different protein panel in TAO vs dry eye syndrome and/or controls (12). Now, in the present multicenter study, we aimed to look for dysregulated proteins in the orbital connective tissue of patients with TAO and compare the protein profile to orbital and peripheral adipose tissue of subjects devoid of autoimmune and thyroid disorders. We looked for the impact of specific steroid treatment and smoking on the orbital protein pattern.
Subjects and Methods
Subjects and tissue samples
A total of 64 tissue samples, 39 orbital tissue samples of patients with TAO collected during orbital decompression surgery (six nonsmoker patients without previous steroid treatment, 16 previously steroid-treated nonsmokers, and 17 steroid-treated smokers), 12 orbital samples collected during blepharoplasty or translid fat resection from nonsmoker subjects devoid of autoimmune and thyroid disorders, and 13 peripheral adipose tissue samples obtained from the healthy arm of patients with lymphedema (seven smokers and six nonsmokers) were included. Thirteen orbital TAO samples and the peripheral tissue samples were collected in Malmö, Sweden. All patients and controls gave their written informed consent. The study protocol was approved by the Ethics Committee of the state of Rhineland Palatinate, Germany, in accordance with the ethical standards in the Declaration of Helsinki. All patients underwent complete endocrine and ophthalmic investigation. Diagnosis and definition of clinical activity and severity of TAO were based on the criteria recommended by the Consensus Statement of the European Group on Graves' Orbitopathy, EUGOGO (13).
Tissue collection and lysis
Biopsies of adipose tissue samples from patients and controls were performed exclusively during routine surgeries, independently of the current study. No additional tissue was removed during surgery. Samples were immediately frozen in liquid nitrogen (Mainz) or treated with the substance RNAlater (Ambion) overnight (Malmö) before being frozen and stored until use. To extract the proteins, samples were thawed on ice and dissociated with the Proteo Extract Dissociation Buffer Kit (Calbiochem). The manufacturer's protocol was modified as follows: tissue <500 mg was dissociated with only 1.5 mL tissue dissociation buffer, no cell strainer was used, and centrifugation was performed at 7000 rpm for 30 minutes. Lysis of samples was performed using 200 μL PBS containing 0.1% SDS and a pestle for Eppendorf tubes. Samples were vortexed, treated with ultrasound, and then subjected to a freeze-thaw cycle with liquid nitrogen. Afterward, the samples were centrifuged at 14 000 rpm for 30 minutes. This was conducted two times for each sample, and the supernatant was unified. Subsequently, samples were precipitated with 100% ice-cold acetone. Samples of each study collective were pooled (using the same amount of protein of each sample). Per pool group, 50 μg of protein was applied on an SDS gel.
MALDI mass spectrometry and data acquisition
Samples were separated on a one-dimensional SDS-PAGE. Per lane and pool group, 50 μg were applied on the gel. An overnight in gel digestion and an elution of the peptides followed. Samples were evaporated and adjusted to pH ≤ 4 with 0.5% trifluoroacetic acid for fractionation with zip tips (Zip Tip Pipette Tips; Merck Millipore) according to the manufacturer's protocol. Samples where eluted in five steps with 15, 25, 35, 45, and 50% acetonitrile solution and then directly spotted to a steel target. The sample was co-crystallized with an energy-absorbing matrix (cinnamic acid). Data acquisition was accomplished using MALDI TOF/TOF mass spectrometer (Ultraflex II TOF/TOF; Bruker Daltonics) with a nitrogen laser. After acquiring the digest spectra with 100 laser shots averaged from five sample positions in the linear mode, peptides below m/z 4000 Da with good peak intensity were selected for fragmentation analysis using a reflector mode. Peptide fragmentation was performed using collision-induced dissociation, and 50 laser shots from five sample positions were summed up for each parent ion. All spectra were externally calibrated by using the peptide calibration standard (Angiotensin II 1047, 19 Angiotensin I 1297.49, Substance P 1348.64, Bombesin 1620.86, ACTH clip 1–17 2093.08, ACTH clip 18–39 2465.19, Somatostatin 28 3147.47; Bruker Daltonics). Data processing of raw spectra, peak detection, and protein identification was performed using Bruker software (Flex analysis 2.4 and BioTools 3.1) and MASCOT. The MALDI spectra obtained were used for database searches with MASCOT using SwissProt release 11_1 (Swiss Institute of Bioinformatics) database. MASCOT compares the peptide and lift spectra against peptide patterns in the database and searches for homologies. BioTools Software, which is linked with the MASCOT server, was used. If the data of the spectra were matching the data in the database, probability if this was a contingency was determined. Protein queries were run under Mudpit Scoring conditions with a significance threshold of P < .05 for protein identification.
Data analysis
With the help of the P2M software (Proteomics Pipeline Mainz; Experimental Ophthalmology), intensities of identified proteins were normalized and clustered. Corresponding cluster lists containing the normalized peak intensity values and the identifications for each sample were exported to Statistica (version 6.2; StatSoft). Peptide intensity values for each protein were averaged, and tables with the mean intensities were constructed. Differences of mean intensities ≥2-fold or ≤0.5-fold were considered as significantly up- or down-regulated, respectively.
Results
Demographic, clinical, and serological data
The demographic, clinical, and serological data of the 39 patients with TAO and the 25 control subjects are summarized in Table 1. All baseline serum TSH levels of controls were within the normal range. Nonsmoker patients who did not require immunosuppressive treatment before sample collection showed a more prevalent mild clinical TAO phenotype vs smokers. In this group, two of six patients had a euthyroid TAO and an autoimmune thyroiditis. Eight, 15, and 11 patients with TAO and Graves' hyperthyroidism have been treated with a 12-month course of antithyroid drugs, radioactive iodine, or thyroidectomy, respectively. In patients with clinically active and severe TAO, glucocorticoids were administered iv according to a published treatment protocol (14–16) 5 months (median; range, 1–22 mo) before decompression surgery.
Demographic Data
| Untreated Nonsmokers | Steroid-Treated Nonsmokers | Steroid-Treated Smokers | Control Orbital Tissue | Control Peripheral Tissue | |
|---|---|---|---|---|---|
| No. of patients | 6 | 16 | 17 | 12 | 13 |
| Age, median (range), y | 30 (20–73) | 55.1 (20–76) | 48.5 (27–71) | 67.2 (48–85) | 61 (16–78) |
| Females | 5 (83.3) | 11 (68.8) | 10 (58.8) | 8 (66.7) | 12 (92.3) |
| Nonsmoker | 6 (100) | 16 (100) | 0 (0) | 12 (100) | 6 (46.2) |
| Duration of TAO, median (range), mo | 47.5 (10–162) | 22.5 (8–646) | 28 (6–131) | ||
| Active TAO | 0 | 11 (68) | 13 (76.5) | ||
| Clinical activity score of TAO, median (range, 0–7 points) | 1 (0–2) | 3.5 (0–5) | 4 (1–5) | ||
| Severity classes | |||||
| Mild | 2 (33.3) | 2 (12.5) | 2 (11.8) | ||
| Moderate-to-severe | 4 (66.7) | 13 (81.3) | 15 (88.2) | ||
| Sight-threatening | 0 | 1 (6.3) | 0 (0) | ||
| NOSPECS-score of TAO, median (range, 0–18 points) | 5.2 (2.5–7) | 6 (4–10.5) | 6 (2–10.5) | ||
| Duration of autoimmune thyroid disease, median (range), mo | 90 (10–332) | 86 (10–646) | 90 (10–332) | ||
| Thyroid involvement | |||||
| Graves' disease | 4 (66) | 16 (100) | 17 (100) | ||
| Hashimoto's thyroiditis | 1 (16.7) | 0 | 0 | ||
| Euthyroid TAO | 1 (16.7) | 0 | 0 | ||
| Thyroid treatment | |||||
| Antithyroid drugs | 0 | 2 (12.5) | 6 (35.3) | ||
| Radioactive iodine | 1 (16.7) | 10 (62.5) | 4 (23.5) | ||
| Thyroidectomy | 2 (16.7) | 3 (18.8) | 6 (35.5) | ||
| Thyroid function at orbital decompression surgery | |||||
| Euthyroid | 6 (100) | 14 (87.5) | 15 (88.2) | ||
| Hyperthyroid | 0 | 2 (12.5) | 2 (11.8) | ||
| TSH receptor antibody positive | 5 (83.3) | 14 (87.5) | 14 (82.4) |
Demographic, clinical, and serological data of the 39 patients with TAO and the 25 euthyroid control subjects. Data are expressed as number (percentage) unless stated otherwise.
Proteome analysis
Patients' orbital tissue vs control tissue
Mean intensity values (and SD) of all measured peptides per protein and the calculated protein ratios between the various patient and control groups are presented in Tables 2 and 3, respectively. Thirty-one proteins were identified, of which 16 differentiated between patients with TAO and controls. Ten proteins are up-regulated in patients' orbital adipose tissue vs control orbital adipose tissue: polymerase I and transcript release factor (PTRF or caveolin-1, 3.1-fold), beta IV spectrin (SPTN4, 3-fold), elongin A binding protein 1 (REXO1, 2.9-fold), the metalloproteinase semicarbazide-sensitive amine oxidase 3 (AOC3, 2.6-fold), myosin heavy chain 6 (MYH6, 2.4-fold). Furthermore, GTPB2, a G protein; XYLB, a xylulokinase homolog; and myosin heavy chain 3 (MYH3) were all 2.3-fold up-regulated. The protein pointing to cell proliferation histone H4 (H4) and the ADAM metallopeptidase with thrombospondin type 1 motif 14 (ATS14 or ADAMTS14) were 2.13- and 2.07-fold up-regulated, respectively (Figure 1A). The deregulated proteins are involved in adipogenesis, lipid metabolism, and inflammatory response, determined with the pathway analysis software Ingenuity 2012 (Ingenuity Systems Inc).
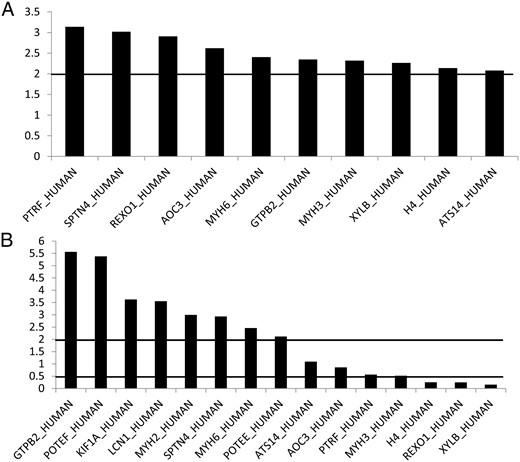
A, TAO patients' orbital adipose tissue vs control orbital adipose tissue (mean intensity ratios). Ratios, either higher than 2 or lower than 0.5, were regarded as significantly up- or down-regulated. B, TAO patients' orbital adipose tissue vs control peripheral subcutaneous adipose tissue (mean intensity ratios). Ratios, either higher than 2 or lower than 0.5, were regarded as significantly up- or down-regulated.
Mean Intensity Peptide Values
| Patient Orbital Adipose Tissue | Control Tissue | |||||||||||
|---|---|---|---|---|---|---|---|---|---|---|---|---|
| Untreated Nonsmokers | Steroid-Treated Nonsmokers | Steroid-Treated Smokers | Orbital Adipose Tissue | Peripheral Adipose Tissue, Smokers | Peripheral Adipose Tissue, Nonsmokers | |||||||
| Mean | SD | Mean | SD | Mean | SD | Mean | SD | Mean | SD | Mean | SD | |
| SPTN4 | 18 312.70 | 14 423.07 | 6492.55 | 2167.21 | 6300.30 | 4725.17 | 2908.95 | 113.07 | 2877.30 | 1604.11 | 3109.60 | 1334.35 |
| XYLB | 9599.00 | 5394.98 | 4134.63 | 825.72 | 4170.13 | 2920.17 | 2287.88 | 194.28 | 28 138.50 | 25 479.12 | 37 726.25 | 34 138.63 |
| AOC3 | 5939.43 | 5161.36 | 3595.50 | 921.06 | 4257.39 | 3246.88 | 1719.61 | 108.14 | 6488.93 | 5869.02 | 4007.21 | 3405.76 |
| PTRF | 6289.80 | 2770.53 | 6401.80 | 4600.15 | 4945.20 | 4288.74 | 1833.70 | 2.69 | 9625.00 | 3755.09 | 10 777.40 | 3661.38 |
| REXO1 | 9194.50 | 6347.05 | 5917.75 | 3369.01 | 8399.83 | 8213.05 | 2812.58 | 160.63 | 26 849.67 | 31 574.58 | 39 105.67 | 45 149.88 |
| ANXA2 | 8109.48 | 6512.78 | 3281.56 | 91.36 | 4289.68 | 2537.10 | 2616.52 | 229.89 | 4304.88 | 2912.26 | 4842.80 | 3459.34 |
| CAV1 | 9186.00 | 2693.00 | 1105.92 | 4076.00 | 1538.66 | 2982.00 | 902.27 | 4695.00 | 7291.00 | |||
| KIF1A | 7683.30 | 4942.38 | 2715.70 | 1450.98 | 4025.20 | 1526.36 | 2550.85 | 387.85 | 1130.10 | 1348.41 | 1129.10 | 1707.69 |
| GTPB2 | 13 848.29 | 8619.58 | 15 900.29 | 18 557.92 | 8005.21 | 1748.88 | 4800.29 | 614.58 | 2106.14 | 1027.16 | 1948.71 | 1151.34 |
| H4 | 7723.92 | 5170.54 | 4619.42 | 683.77 | 5490.25 | 4446.41 | 2711.33 | 361.80 | 19 523.67 | 25 289.09 | 25 901.17 | 34 631.17 |
| ATS14 | 5240.50 | 3850.98 | 1955.88 | 131.70 | 4891.75 | 3967.93 | 1901.38 | 95.28 | 4470.75 | 2833.80 | 2761.00 | 2016.05 |
| POTEE | 4443.50 | 2672.91 | 2211.19 | 57.54 | 3795.44 | 2289.52 | 2000.56 | 363.19 | 1621.75 | 1271.62 | 1575.13 | 977.66 |
| MYH6 | 3419.00 | 0.00 | 5354.50 | 874.69 | 3964.00 | 1083.29 | 1898.50 | 197.28 | 3714.00 | |||
| MYH3 | 3448.25 | 1209.61 | 5750.88 | 4151.95 | 3247.88 | 1753.09 | 2012.50 | 160.16 | 9121.25 | 5271.69 | 8936.00 | 5242.75 |
| POTEF | 7371.00 | 3438.50 | 4862.77 | 5303.50 | 362.75 | 6551.50 | 2339.82 | 1114.00 | ||||
| MYH2 | 1880.45 | 521.75 | 2641.64 | 219.72 | 4023.05 | 2489.47 | 1984.27 | 21.73 | 1487.45 | 1566.95 | 682.18 | 888.65 |
| LCN1 | 2961.50 | 409.41 | 1973.25 | 2189.56 | 4564.75 | 2813.93 | 3221.50 | 750.95 | 770.00 | 130.11 | 1061.00 | 452.55 |
Data are expressed as mean intensity values, MALDI measurements ± 1 SD, of all identified peptides per protein and patient/control pooled groups.
Protein Ratios
| Patient Orbital Adipose Tissue vs Control Orbital Adipose Tissue | Patient Orbital Adipose Tissue vs Control Peripheral Adipose Tissue | ||||||||
|---|---|---|---|---|---|---|---|---|---|
| Untreated Nonsmoker | Steroid-Treated Nonsmoker | Steroid-Treated Smoker | Untreated TAO Nonsmoker vs Control Smoker | Untreated TAO Nonsmoker vs Control Nonsmoker | Steroid-Treated TAO Nonsmoker vs Control Smoker | Steroid-Treated TAO Nonsmoker vs Control Nonsmoker | Steroid-Treated TAO Smoker vs Control Smoker | Steroid-Treated TAO Smoker vs Control Nonsmoker | |
| SPTN4 | 6.295 | 2.232 | 2.166 | 6.365 | 5.889 | 2.190 | 2.088 | 2.256 | 2.088 |
| XYLB | 4.196 | 1.807 | 1.823 | 0.341 | 0.254 | 0.148 | 0.110 | 0.147 | 0.110 |
| AOC3 | 3.454 | 2.091 | 2.476 | 0.915 | 1.482 | 0.656 | 0.897 | 0.554 | 0.897 |
| PTRF | 3.430 | 3.491 | 2.697 | 0.653 | 0.584 | 0.514 | 0.594 | 0.665 | 0.594 |
| REXO1 | 3.269 | 2.104 | 2.987 | 0.342 | 0.235 | 0.313 | 0.151 | 0.220 | 0.151 |
| ANXA2 | 3.099 | 1.254 | 1.639 | 1.884 | 1.675 | 0.996 | 0.678 | 0.762 | 0.678 |
| CAV1 | 3.080 | 0.903 | 1.367 | 1.957 | 1.260 | 0.868 | 0.369 | 0.574 | 0.369 |
| KIF1A | 3.012 | 1.065 | 1.578 | 6.799 | 6.805 | 3.562 | 2.405 | 2.403 | 2.405 |
| GTPB2 | 2.885 | 3.312 | 1.668 | 6.575 | 7.106 | 3.801 | 8.159 | 7.549 | 8.159 |
| H4 | 2.849 | 1.704 | 2.025 | 0.396 | 0.298 | 0.281 | 0.178 | 0.237 | 0.178 |
| ATS14 | 2.756 | 1.029 | 2.573 | 1.172 | 1.898 | 1.094 | 0.708 | 0.437 | 0.708 |
| POTEE | 2.221 | 1.105 | 1.897 | 2.740 | 2.821 | 2.340 | 1.404 | 1.363 | 1.404 |
| MYH6 | 1.801 | 2.820 | 2.088 | 0.921 | 1.067 | 1.442 | |||
| MYH3 | 1.713 | 2.858 | 1.614 | 0.378 | 0.386 | 0.356 | 0.644 | 0.630 | 0.644 |
| POTEF | 1.125 | 0.525 | 0.810 | 6.617 | 4.761 | 3.087 | |||
| MYH2 | 0.948 | 1.331 | 2.027 | 1.264 | 2.757 | 2.705 | 3.872 | 1.776 | 3.872 |
| LCN1 | 0.919 | 0.613 | 1.417 | 3.846 | 2.791 | 5.928 | 1.860 | 2.563 | 1.860 |
Protein ratios between the various patient and control groups are shown. Ratios, either higher than 2 or lower than 0.5, were regarded as significantly up- or down-regulated. Missing protein ratios were due to the absence of measured proteins in the corresponding sample. Significant up or downregulations are in bold.
Comparing patients' orbital tissue vs peripheral subcutaneous fat, the following proteins were up-regulated: GTPB2 (5.6-fold), POTE ankyrin domain family member F (POTEF; 5.4-fold), kinesin family member 1A (KIF1A; 3.6-fold), lipocalin 1 (LCN1; 3.6-fold), MYH2 (3.5-fold), SPTN4 (2.9-fold), and MYH6 (2.5-fold), whereas the proteins XYLB (ratio, 0.15), REXO (0.24), and H4 (0.25) were down-regulated (Figure 1B).
The most marked protein up-regulations were noted in the orbital tissue of TAO patients not previously treated with steroids vs control orbital tissue (Figure 2): SPTN4 (6.2-fold); XYLB (4.1-fold); AOC3 (3.4-fold); PTRF or caveolin-1 (3.4-fold); REXO1 (3.3-fold); the structural protein annexin A2 (ANXA2), cavin (CAV1), and KIF1A, all 3-fold; the G protein GTPB2 (2.9-fold); H4 (2.8-fold); ATS14 or ADAM14 (2.7-fold); and POTEE (2.2-fold). There was no relationship between the thyroid metabolic status and the proteome expression profiles.
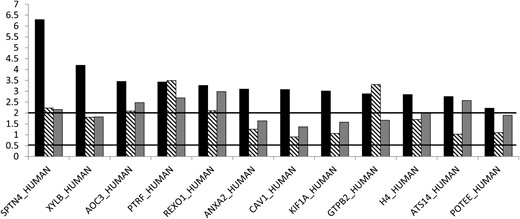
Protein ratios in orbital tissue of patients with TAO.
Black columns, untreated; striped columns, steroid-treated nonsmokers; gray columns, steroid-treated smokers. Ratios, either higher than 2 or lower than 0.5, were regarded as significantly up- or down-regulated.
When comparing orbital tissue of previously steroid-treated nonsmoker patients with control orbital tissue of nonsmokers, seven up-regulated proteins were noted, ie, PTRF (3.4-fold), GTPB2 (3.3-fold), SPTN4 (2.2-fold) and REXO1 (2.1-fold). When looking at orbital tissue of steroid-treated TAO smokers vs control orbital tissue eight up-regulated proteins were detected; ie, REXO (2.9-fold), PTRF (2.6-fold), ATS14 (2.5-fold), AOC3 (2.4-fold), SPTN4 (2.1-fold), and H4 (2-fold).
Control orbital adipose tissue vs control peripheral adipose tissue
When comparing control orbital vs control peripheral connective tissue, different protein patterns were observed. As shown in Figure 3, LCN1 (3.6-fold) and GTPB2 (2.3-fold) were up-regulated. However most proteins were down-regulated: XYLB (14-fold; ratio, 0.07), REXO (11-fold; ratio, 0.09), PTRF (5.5-fold; ratio, 0.18), and AOC3 (3-fold; ratio, 0.35).
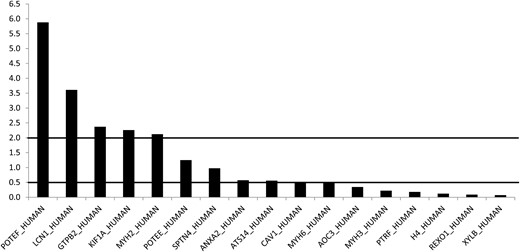
Control orbital adipose tissue vs control peripheral subcutaneous adipose tissue (mean intensity ratios).
Ratios, either higher than 2 or lower than 0.5, were regarded as significantly up- or down-regulated.
Discussion
For the first time, proteome analysis of the orbital connective adipose tissue of patients with TAO was compared to both control orbital adipose tissue and peripheral subcutaneous fat. The multicenter design of this comparative study allowed us to include a relatively large number of samples and to look for the impact of both immunosuppressive treatment and smoking on the regulation of the identified proteins. The deregulated proteins were peptides involved in tissue inflammation, adipose tissue differentiation, lipid metabolism, and tissue remodeling. Steroid treatment decreased the expression of these proteins, whereas smoking attenuated such effect. The importance of testing control orbital tissue became apparent because different protein expressions, ie, tissue inflammation and remodeling, were registered in control orbital vs peripheral connective tissue.
Very scarce proteomic data and only one similar study with as few as six tissue samples are available in the literature. In this single report (17), comparison of orbital fat proteins from TAO patients with controls showed significant differences in the proteome, and up-regulation of specific proteins in orbital tissue from TAO was associated with biochemical mechanisms or capacities against endoplasmic reticulum stress, mitochondria dysfunction, and cell proliferation as well as apoptosis in TAO orbital tissue. Also, a correlation between the decreased protein concentrations of proline-rich proteins and uridine diphosphate-glucose-dehydrogenase with smoking was shown. This is in line with findings that smoking is a risk factor for development of TAO and has an impact on orbital tissue composition (5). This is also in line with our previous studies showing a significant reduction of protective proteins in the tear fluid of patients with TAO (11, 12).
The findings of overexpression of proteins that appear to be relevant to the observed TAO pathology are quite interesting and could suggest a molecular (protein) basis for the pathogenesis of TAO (18). Because most tissues examined were collected from previously treated patients with a TAO of relatively long duration, an overexpression of proteins involved in lipid metabolism and tissue remodeling, ie, fibroblast and adipocyte proliferation, as well as orbital fibrosis is not surprising. However, inflammatory proteins also were up-regulated in untreated patients, and with this respect, we focused on the up-regulated metalloproteinase AOC3 (19–21) which is involved in leukocyte tethering (22) and rolling during inflammatory processes (23–25). In addition to its inflammatory involvement, AOC3 contributes to glucose uptake and fat cell differentiation through insulin-mimicking effects in adipocytes (26–28). Additional proteins involved in adipogenesis and pathophysiology of metabolic diseases (29) were the up-regulated G protein GTP binding protein 2 and xylulokinase, the final enzyme in the glucuronate-xylulose pathway (30), which produces xylulose 5-phosphate, a key regulator of lipogenesis (31, 32).
Also up-regulated were structural proteins involved in the remodeling of orbital tissue; beta IV spectrin, an actin/plasma membrane crosslinking and molecular scaffold protein that links the plasma membrane to the actin cytoskeleton, is involved in the determination of cell shape, the arrangement of transmembrane proteins, and the organization of organelles. Also, annexin A2, a member of a calcium-dependent phospholipid-binding protein family that plays a role in the regulation of cellular growth, in signal transduction pathways, and in cell–cell adhesion via membrane/cytoskeletal organization, was up-regulated in the single published study dealing with orbital protein expression in TAO (17). Furthermore, the up-regulated protein ADAMTS14 is a disintegrin-like and metalloproteinase domain with thrombospondin type 1 modules. This is in line with a recently published overexpression of another member of the ADAMTS family, ADAMTS 1 motif 1 (4). Expression of matrixins can be increased by inflammatory cytokines, growth factors, and cell–cell interaction (33). Finally, KIF1A, a member of the kinesin family, is an anterograde motor protein and carries membranous organelles along axonal microtubules in neurons (34–36). Remodeling of the orbital tissue explains its up-regulation best.
As in tear fluid of patients with TAO (11), proteins that are involved in inflammatory processes were up-regulated in the current study, ie, POTEE and POTEF both paralogs of POTEI, an isoform of POTE-2a-actin, which is elevated in Hela cells treated with proapoptotic factors, eg, the FAS ligand, antibodies to FAS ligand, and TRAIL. Also, overexpression of POTEI was demonstrated to induce apoptosis (29). Thus, up-regulation of POTEI paralogs in TAO may point to eventual apoptosis of infiltrative mononuclear cells during the course of the disease and/or apoptosis of target cells within the process of tissue remodeling in the orbit.
Limitations of this study have to be acknowledged. Proteomic studies such as this cannot by themselves discern whether the differentially expressed proteins are indeed involved pathophysiologically in the generation of the morbid process or are simply epiphenomena. Furthermore, although samples were processed separately, they were pooled for the analysis. This may eventually impact the reproducibility of the findings.
In conclusion, proteomics revealed up-regulated proteins of lipid metabolism, inflammation, and tissue remodeling in orbital adipose tissue of patients with TAO. In addition, smoking attenuated the effects of steroids.
Acknowledgments
Disclosure Summary: The authors have nothing to disclose.
Abbreviations
- ANXA2
annexin A2
- AOC3
semicarbazide-sensitive amine oxidase 3
- ATS14
ADAM metallopeptidase with thrombospondin type 1 motif 14
- CAV1
caveolin-1
- GTPB2
GTP binding protein 2
- H4
histone H4
- KIF1A
kinesin family member 1A
- LCN1
lipocalin 1
- MALDI
matrix-assisted laser desorption/ionization
- MYH2/3/6
myosin heavy chain 2/3/6
- POTEE/F
POTE ankyrin domain family, member E/F
- PTRF
polymerase I and transcript release factor or cavin 1
- REXO1
elongin A binding protein 1
- SPTN4
beta IV spectrin
- TAO
thyroid-associated orbitopathy
- TOF
time-of-flight
- XYLB
xylulokinase homolog.
