


Angiopoietin-like protein 8 (ANGPTL8)/betatrophin is a secreted protein initially involved in β-cell replication. Recent data in humans and mice models suggest that ANGPTL8/betatrophin is more related to lipid metabolism.
The aim of the present study was to compare the circulating concentrations of ANGPTL8/betatrophin in individuals with dyslipidemia defined as having high or low levels of high-density lipoprotein (HDL)-cholesterol or triglycerides, respectively.
Serum concentrations of ANGPTL8/betatrophin were measured by an ELISA in 177 subjects. We studied two different selected case-control dyslipidemic cohorts including individuals with high (n = 43) or low (n = 46) circulating concentrations of HDL-cholesterol or with low (n = 48) or high (n = 40) levels of triglycerides.
Circulating concentrations of ANGPTL8/betatrophin were significantly lower in individuals with dyslipidemia (P < .001) in both males (controls 27.8 ± 15.2 vs dyslipidemic 17.0 ± 11.2 ng/mL) and females (controls 50.0 ± 22.2 vs dyslipidemic 27.0 ± 16.5 ng/mL). The magnitude of the differences was higher in dyslipidemic patients with low HDL-cholesterol than in those with high triglyceride concentrations. ANGPTL8/betatrophin levels were lower in subjects with type 2 diabetes (P < .001), but the impact of type 2 diabetes vanished (P = .257) when the effect of dyslipidemia was included in the analysis.
We conclude that serum ANGPTL8/betatrophin concentrations are altered in human dyslipidemia. ANGPTL8/betatrophin emerges as a potential player in dyslipidemia with a strong association with HDL-cholesterol and a potential therapeutic tool for the treatment of dyslipidemia.
Decreased circulating high-density lipoprotein (HDL)-cholesterol (HDL-C) particles, and increased triglyceride (TG) levels are features of atherogenic dyslipidemia (1). Dyslipidemia is a typical hallmark of obesity, insulin resistance, and type 2 diabetes (T2D) as well as metabolic syndrome, emerging as a major risk factor for cardiovascular disease (1, 2). In the last decades, a wide number of molecules have been linked to the altered levels of HDL-C and TG that take place in the aforementioned metabolic disturbances (3, 4).
Angiopoietin-like protein 8 (ANGPTL8)/betatrophin, is a 22-kDa protein primarily expressed in liver and adipose tissue, also known as lipasin (5), refeeding-induced fat and liver (6), LOC55908, hepatocellular carcinoma-associated protein TD26 and encoded by the Gm6484 gene in mice and C19ORF80 in humans (7). ANGPTL8/betatrophin was initially suggested to promote pancreatic β-cell proliferation (7). However, recent studies in Angptl8-deficient mice revealed profound alterations in TG metabolism but no abnormalities in glucose homeostasis (8), suggesting that ANGPTL8/betatrophin does not play a role in controlling β-cell growth (9). There is a controversy regarding the levels of this molecule in metabolic conditions such as obesity and T2D (7). In this regard, our group and others have evidenced decreased levels of ANGPTL8/betatrophin in obesity and T2D in adults (10, 11) as well as in children and adolescents (12, 13), whereas others have reported unchanged or increased levels (7, 14–16). These discrepancies have been suggested to be explained by methodological disparities between the available commercial immunoassays detecting different proteolytic ANGPTL8/betatrophin subspecies (17).
Very recently we have shown that serum ANGPTL8/betatrophin concentrations are increased in obese subjects after surgically induced weight loss but not after weight loss achieved by conventional dietary treatment, and this increase takes place in parallel to the increase in HDL-C levels. The weight loss-associated ANGPTL8/betatrophin changes were more related to the changes in HDL-C concentrations than to the improvement in insulin sensitivity (18).
To investigate the possible relation of ANGPTL8/betatrophin with the presence of dyslipidemia, we analyzed the serum concentrations of ANGPTL8/betatrophin in patients with low concentrations of HDL-C as well as in subjects with high levels of TG. Our hypothesis was that ANGPTL8/betatrophin levels might be closely related with lipid levels, being altered in patients with dyslipidemia.
Subjects and Methods
Subjects
To analyze the concentrations ANGPTL8/betatrophin in dyslipidemia, 177 Caucasian subjects were recruited from healthy volunteers and patients attending the Department of Endocrinology and Nutrition at the Clínica Universidad de Navarra. We studied two different selected case-control dyslipidemic cohorts including individuals with high (n = 43) or low (n = 46) circulating concentrations of HDL-C or with low (n = 48) or high (n = 40) levels of TG. Diagnosis of dyslipidemia was based on having HDL-C levels less than 40 mg/dL in men and less than 50 mg/dL in women or TG concentrations of 150 mg/dL or greater (3, 19). Levels of HDL-C in the low HDL-C group ranged from 16 to 32 mg/dL and from 66 to 139 mg/dL in the high HDL-C group, whereas concentrations of TG in the high TG group ranged from 251 to 887 mg/dL, and from 31 to 65 mg/dL in the low TG group. Subjects were additionally classified as having normoglycemia (NG), impaired glucose tolerance (IGT), or T2D following the criteria of the American Diabetes Association (20) based on plasma glucose 2 hours after an oral glucose tolerance test (OGTT). Glucose intolerance or T2D was of recent onset, being diagnosed after the OGTT, and, therefore, participants were not on antidiabetic medication or insulin therapy. Antihypertensive or lipid-lowering medication was registered. Subjects were also classified according to body mass index (BMI) as lean, overweight, or obese following the World Health Organization criteria (21). Participants underwent a clinical assessment including a medical history, physical examination, body composition analysis, and comorbidity evaluation performed by a multidisciplinary consultation team. Individuals with signs of infection were excluded. The experimental design was approved, from an ethical and scientific standpoint, by the hospital’s ethical committee responsible for research, and volunteers gave their informed consent to participate in the study.
Anthropometric measurements and physical activity
The anthropometric and body composition determinations as well as the blood extraction were performed on a single day. Height was measured to the nearest 0.1 cm with a Holtain stadiometer (Holtain Ltd), whereas body weight was measured with a calibrated electronic scale to the nearest 0.1 kg with subjects wearing a swim suit and cap. Waist circumference was measured at the midpoint between the iliac crest and the rib cage on the midaxillary line. Blood pressure was measured after a 5-minute rest in the semisitting position with a sphygmomanometer. Blood pressure was determined at least three times at the right upper arm, and the mean was used in the analyses. Body density was estimated by ADP (Bod-Pod; Life Measurements). Percentage of body fat was estimated from body density using the Siri equation as previously described (21). Physical activity level (PAL) was estimated by a validated questionnaire (22).
Serum biochemistry
Blood samples were collected after an overnight fast in the morning to avoid potential confounding influences due to hormonal rhythmicity. Plasma glucose was analyzed by an automated analyzer (Roche/Hitachi Modular P800) as previously described (21). Insulin was measured by means of an enzyme-amplified chemiluminescence assay (Immulite 2000; Siemens AG). Total cholesterol and TG concentrations were determined by enzymatic spectrophotometric methods (Roche). Serum HDL-C was quantified by a colorimetric method in a Beckman Synchron CX analyzer (Beckman Instruments, Ltd). Low-density lipoprotein-cholesterol (LDL-C) was calculated by the Friedewald formula. In 12 cases (11 males and one female), LDL-C was not calculated because the TG levels were higher than 400 mg/dL (23). Non-HDL-cholesterol (nonHDL-C) was calculated as the total cholesterol minus HDL-C because it has been suggested as a better marker of the atherogenic dyslipidemia than HDL-C (24). White blood cell (WBC) count was measured using an automated cell counter (Beckman Coulter). Uric acid, alanine aminotransferase (ALT), aspartate aminotransferase (AST), γ-glutamyltransferase (γ-GT), and creatinine were measured by enzymatic tests (Roche) in an automated analyzer (Roche/Hitachi Modular P800). The AST to ALT ratio was calculated as an indirect indicator of hepatic steatosis and fatty liver disease (25). Leptin was quantified by a double-antibody RIA method (Linco Research, Inc) as previously described (26); the intra- and interassay coefficients of variation were 5.0% and 4.5%, respectively. Serum ANGPTL8/betatrophin concentrations were determined using a validated ELISA kit (human ANGPTL8 ELISA kit, CSB-EL028107HU; Cusabio) with the intra- and interassay coefficients of variation being less than 8% and less than 10%, respectively, as previously described (10).
Statistical analysis
Data are presented as mean ± SD unless otherwise indicated. Differences between groups were analyzed by a two-way ANOVA with gender and dyslipidemia as the main factors or a one-way ANOVA followed by Fisher’s least significant differences (LSD) tests when an interaction was detected. A one-way ANOVA followed by Fisher’s LSD tests were also used to assess the effects of T2D, obesity, and dyslipidemic treatment. Correlations between two variables were computed by Pearson’s correlation coefficients (r). Multivariate stepwise linear regression analysis was conducted for the dependent variables ANGPTL8/betatrophin or HDL-C including the variables that showed a significant correlation with ANGPTL8/betatrophin or HDL-C as the independent variables. The calculations were performed using the SPSS version 23 (SPSS Inc). A value of P < .05 was considered statistically significant.
Results
Patients with low HDL-C concentrations showed higher BMI, waist circumference, and waist to height ratio (WHR) as well as lower physical activity than individuals with high HDL-C (Table 1). They exhibited higher insulin resistance evidenced by increased insulinemia, homeostatic model assessment (HOMA), and glucose and insulin levels 2 hours after an OGTT in addition to reduced quantitative insulin sensitivity check index (QUICKI). Patients with low HDL-C levels also showed higher TG and lower total cholesterol levels and higher levels of uric acid and WBC numbers than those from the high HDL-C group. They also showed lower AST to ALT ratio, suggestive of a higher presence of fatty liver. In the second cohort, subjects with high TG concentrations were slightly older, exhibiting higher waist circumference and WHR (Table 2). They exhibited notable changes in the markers of insulin resistance and in all variables of the lipid profile. Finally, they showed higher levels of uric acid, WBC, and γ-GT, as compared with those with low serum TG concentrations.
Anthropometric and Biochemical Characteristics of the Subjects Included in the Study of Dyslipidemia According to High or Low Circulating HDL-C Concentrations
| n = 89 | Male | Female | P Two-Way ANOVA | ||||
|---|---|---|---|---|---|---|---|
| High HDL-C | Low HDL-C | High HDL-C | Low HDL-C | ||||
| 22 | 22 | 21 | 24 | HDL-C | Gender | Inter. | |
| Age, y | 45 ± 16 | 40 ± 12 | 43 ± 15 | 39 ± 13 | .166 | .714 | .981 |
| Weight, kg | 97 ± 14 | 106 ± 18 | 82 ± 17 | 97 ± 24 | .005 | .003 | .385 |
| BMI, kg/m2 | 32.7 ± 4.5 | 35.5 ± 6.1 | 31.9 ± 5.5 | 37.3 ± 7.3 | .001 | .667 | .318 |
| Body fat, % | 39.1 ± 8.7 | 36.5 ± 6.8 | 47.0 ± 7.2 | 48.5 ± 6.4 | .724 | <.001 | .184 |
| Waist circumference, cm | 108 ± 9 | 115 ± 13 | 100 ± 15 | 108 ± 15 | .009 | .013 | .752 |
| WHR | 0.96 ± 0.07 | 1.02 ± 0.06 | 0.86 ± 0.08 | 0.91 ± 0.08 | <.001 | <.001 | .849 |
| PAL, AU | 1.86 ± 0.38 | 1.57 ± 0.51 | 2.00 ± 0.01 | 1.65 ± 0.35 | .040 | .448 | .841 |
| SBP, mm Hg | 126 ± 15 | 127 ± 18 | 116 ± 19 | 124 ± 16 | .250 | .095 | .352 |
| DBP, mm Hg | 79 ± 10 | 80 ± 11 | 73 ± 8 | 79 ± 9 | .097 | .069 | .148 |
| Glucose, mg/dL | 100 ± 16 | 106 ± 24 | 93 ± 9 | 98 ± 22 | .185 | .055 | .964 |
| Insulin, μU/mL | 7.6 ± 4.1 | 22.0 ± 15.4 | 10.4 ± 17.2 | 16.5 ± 18.4 | .002 | .669 | .194 |
| Glucose 2-h OGTT, mg/dL | 129 ± 65 | 170 ± 61 | 115 ± 33 | 163 ± 66 | <.001 | .394 | .747 |
| Insulin 2-h OGTT, μU/mL | 77.0 ± 49.4 | 131.4 ± 69.6 | 59.8 ± 43.4 | 120.2 ± 79.2 | <.001 | .288 | .822 |
| HOMA | 1.89 ± 1.07 | 6.15 ± 5.85 | 2.41 ± 3.99 | 4.44 ± 6.14 | .003 | .559 | .272 |
| QUICKI | 0.352 ± 0.044 | 0.293 ± 0.032 | 0.358 ± 0.045 | 0.316 ± 0.044 | <.001 | .093 | .331 |
| Triglycerides, mg/dL | 82 (69–102) | 151 (113–270) | 73 (56–100) | 160 (119–221) | <.001 | .369 | .737 |
| Total cholesterol, mg/dL | 224 ± 39 | 180 ± 41 | 226 ± 30 | 194 ± 34 | <.001 | .320 | .476 |
| LDL-C, mg/dL | 131 ± 38 | 117 ± 43 | 100 ± 27 | 132 ± 31a | .211 | .278 | .003 |
| HDL-C, mg/dL | 75 ± 8 | 25 ± 3b | 110 ± 13 | 28 ± 4b | <.001 | <.001 | <.001 |
| nonHDL-C, mg/dL | 149 ± 40 | 155 ± 40 | 117 ± 30 | 166 ± 34b | <.001 | .167 | .006 |
| Uric acid, mg/dL | 6.2 ± 0.9 | 7.2 ± 1.8 | 4.4 ± 0.9 | 5.4 ± 1.6 | .002 | <.001 | .944 |
| Creatinine, mg/dL | 0.94 ± 0.13 | 0.99 ± 0.12 | 0.75 ± 0.12 | 0.76 ± 0.14 | .231 | <.001 | .516 |
| WBC, 106 cells/mL | 6.3 ± 1.4 | 7.2 ± 3.1 | 6.0 ± 1.5 | 6.9 ± 1.4 | .040 | .450 | .935 |
| ALT, IU/L | 31 ± 28 | 43 ± 31 | 18 ± 14 | 21 ± 11 | .128 | <.001 | .326 |
| AST, IU/L | 21 ± 15 | 20 ± 10 | 19 ± 25 | 15 ± 6 | .446 | .299 | .637 |
| AST to ALT ratio | 0.80 ± 0.30 | 0.55 ± 0.18 | 1.01 ± 0.33 | 0.80 ± 0.27 | <.001 | <.001 | .748 |
| γ-GT, IU/L | 41 ± 56 | 35 ± 20 | 14 ± 8 | 18 ± 9 | .863 | <.001 | .437 |
| Leptin, ng/mL | 23.7 ± 17.8 | 21.7 ± 12.4 | 32.8 ± 16.9 | 50.0 ± 25.7a | .062 | <.001 | .020 |
Abbreviations: BF%, body fat percentage; DBP, diastolic blood pressure; SBP, systolic blood pressure. Data are mean ± SD or median (interquartile range). Differences between groups were analyzed by a two-way ANOVA. If an interaction was detected, a one-way ANOVA followed by Fisher’s LSD tests was performed. Bold values denote statistical significance at P < .05.
P < .01 vs high HDL-C of the same gender.
P < .001 vs high HDL-C of the same gender.
Anthropometric and Biochemical Characteristics of the Subjects Included in the Study of Dyslipidemia According to Low or High Triglyceride Concentrations
| Male | Female | P Two-Way ANOVA | |||||
|---|---|---|---|---|---|---|---|
| Low TG | High TG | Low TG | High TG | TG | Gender | Interquartile Range | |
| n = 88 | 21 | 21 | 27 | 19 | |||
| Age, y | 34 ± 10 | 40 ± 10 | 44 ± 9 | 48 ± 13 | .026 | <.001 | .504 |
| Weight, kg | 104 ± 22 | 109 ± 25 | 90 ± 24 | 94 ± 9 | .337 | .003 | .831 |
| BMI, kg/m2 | 32.7 ± 5.6 | 36.2 ± 7.8 | 35.4 ± 7.7 | 36.9 ± 3.4 | .076 | .239 | .485 |
| Body fat, % | 33.5 ± 9.4 | 37.8 ± 7.7 | 48.5 ± 8.1 | 48.8 ± 3.9 | .171 | <.001 | .217 |
| Waist circumference, cm | 108 ± 16 | 116 ± 17 | 102 ± 20 | 110 ± 7 | .026 | .102 | .963 |
| WHR | 0.95 ± 0.07 | 1.01 ± 0.08 | 0.86 ± 0.10 | 0.95 ± 0.06 | <.001 | <.001 | .450 |
| PAL, AU | 1.39 ± 0.40 | 1.40 ± 0.55 | 1.68 ± 0.35 | 1.65 ± 0.47 | .970 | .144 | .907 |
| SBP, mm Hg | 123 ± 14 | 124 ± 17 | 119 ± 17 | 131 ± 17 | .066 | .657 | .139 |
| DBP, mm Hg | 77 ± 10 | 79 ± 10 | 76 ± 10 | 82 ± 11 | .043 | .504 | .271 |
| Glucose, mg/dL | 90 ± 7 | 103 ± 15 | 86 ± 11 | 107 ± 13 | <.001 | .997 | .181 |
| Insulin, μU/mL | 9.6 ± 5.5 | 17.9 ± 10.6 | 7.7 ± 5.9 | 23.8 ± 19.5 | <.001 | .416 | .111 |
| Glucose 2-h OGTT, mg/dL | 105 ± 20 | 159 ± 56 | 113 ± 29 | 172 ± 62 | <.001 | .268 | .814 |
| Insulin 2-h OGTT, μU/mL | 70.2 ± 55.8 | 106.8 ± 55.5 | 61.4 ± 52.5 | 130.3 ± 69.2 | <.001 | .559 | .198 |
| HOMA | 2.15 ± 1.28 | 4.67 ± 3.12 | 1.70 ± 1.41 | 6.59 ± 6.40 | <.001 | .325 | .118 |
| QUICKI | 0.352 ± 0.035 | 0.317 ± 0.031a | 0.375 ± 0.049 | 0.303 ± 0.023b | <.001 | .585 | .022 |
| Triglycerides, mg/dL | 52 (50–58) | 415 (335–496)b | 40 (37–57) | 298 (283–350)b | <.001 | <.001 | .002 |
| Total cholesterol, mg/dL | 166 ± 36 | 250 ± 49 | 186 ± 34 | 249 ± 41 | <.001 | .268 | .223 |
| LDL-C, mg/dL | 105 ± 35 | 154 ± 47 | 109 ± 31 | 143 ± 39 | <.001 | .669 | .430 |
| HDL-C, mg/dL | 50 ± 12 | 38 ± 6a | 68 ± 15 | 44 ± 11b | <.001 | <.001 | .024 |
| nonHDL-C, mg/dL | 116 ± 36 | 213 ± 47 | 118 ± 30 | 206 ± 38 | <.001 | .761 | .564 |
| Uric acid, mg/dL | 6.1 ± 0.7 | 7.1 ± 1.6 | 4.4 ± 1.1 | 6.0 ± 1.3 | <.001 | <.001 | .279 |
| Creatinine, mg/dL | 0.95 ± 0.13 | 0.89 ± 0.13 | 0.70 ± 0.10 | 0.78 ± 0.11c | .743 | <.001 | .004 |
| WBC, 106 cells/mL | 6.0 ± 1.3 | 7.0 ± 1.5 | 6.0 ± 1.7 | 7.6 ± 1.6 | <.001 | .324 | .359 |
| ALT, IU/L | 35 ± 24 | 37 ± 22 | 19 ± 18 | 30 ± 19 | .124 | .015 | .352 |
| AST, IU/L | 18 ± 8 | 22 ± 10 | 16 ± 15 | 18 ± 8 | .241 | .219 | .655 |
| AST to ALT ratio | 0.60 ± 0.24 | 0.63 ± 0.12 | 0.97 ± 0.36 | 0.66 ± 0.18b | .011 | <.001 | .004 |
| γ-GT, IU/L | 24 ± 21 | 48 ± 32 | 13 ± 8 | 37 ± 32 | <.001 | .039 | .946 |
| Leptin, ng/mL | 17.4 ± 13.3 | 21.9 ± 21.2 | 40.7 ± 23.5 | 45.1 ± 18.8 | .301 | <.001 | .994 |
Abbreviations: BF%, body fat percentage; DBP, diastolic blood pressure; SBP, systolic blood pressure. Data are mean ± SD or median (interquartile range). Differences between groups were analyzed by a two-way ANOVA. If an interaction was detected, a one-way ANOVA followed by Fisher’s LSD tests was performed. Bold values denote statistical significance at P < .05.
P < .01 vs low TG of the same gender.
P < .001 vs low TG of the same gender.
P < .05 vs low TG of the same gender.
Characteristics of the whole sample (n = 177) is depicted in Supplemental Table 1. Four controls according to the HDL-C classification had TG levels that classified them as dyslipidemic, whereas three controls according to the TG classification had HDL-C levels that classified them as dyslipidemic. Circulating concentrations of ANGPTL8/betatrophin were significantly lower in individuals with dyslipidemia (P < .001) in both males (controls [C] 27.8 ± 15.2 vs individuals with dyslipidemia [DL] 17.0 ± 11.2 ng/mL) and females (C 50.0 ± 22.2 vs DL 27.0 ± 16.5 ng/mL) as depicted in Figure 1A, with females exhibiting higher levels than males in agreement with our previous works (10, 18). The magnitude of the differences in ANGPTL8/betatrophin levels was higher in dyslipidemic patients with low HDL-C (males: high HDL-C 31.3 ± 16.8 vs low HDL-C 13.3 ± 7.2 ng/mL, P < .001; females: high HDL-C 57.2 ± 22.4 vs low HDL-C 22.6 ± 14.3 ng/mL, P < .001 main effect of HDL-C levels) than in dyslipidemic subjects with high TG concentrations (males: low TG 26.1 ± 12.5 vs high TG 16.2 ± 10.3 ng/mL; females: low TG 43.3 ± 20.0 vs high TG 31.2 ± 17.9 ng/mL, P < .001 main effect of TG levels) as can be observed in Figure 1, B and C.
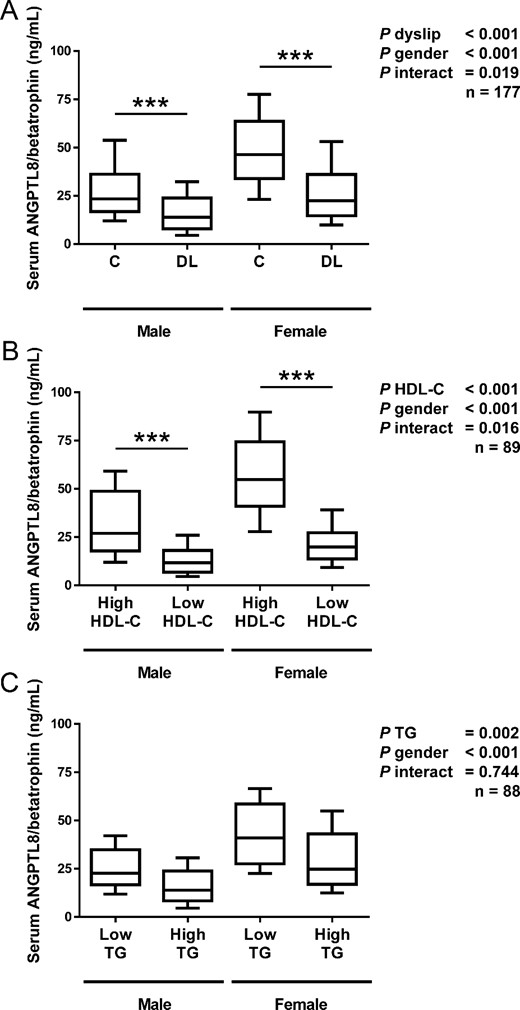
Comparison of serum ANGPTL8/betatrophin in male and female subjects with or without dyslipidemia in the global sample of 177 subjects (A). Subjects with high or low levels of HDL-C (n = 89; B) and individuals exhibiting low or high concentrations of triglycerides (n = 88; C) are shown. Box represents interquartile range and median inside, with whiskers showing 10th/90th percentiles. Statistical differences between the groups were analyzed by a two-way ANOVA and, when an interaction was detected, by a one-way ANOVA followed by Fisher’s LSD tests. ***, P < .001 vs control of the same gender.
Interestingly, we observed a significant decrease (P < .001) in ANGPTL8/betatrophin levels in subjects with IGT and T2D (Figure 2A) in agreement with our previous observation (10). However, this trend vanished (P = .257) when the effect of dyslipidemia was included in the analysis (Figure 2B), and only a significant effect of dyslipidemia (P < .001) was detected in the two-way ANOVA. Similarly, we observed a tendency toward lower levels of ANGPTL8/betatrophin levels regarding obesity, although the effect did not reach statistical significance, likely due to the low size of lean subjects (n = 5) in the sample (Supplemental Figure 1A). Once again, the effect of obesity was entirely due to the effect of dyslipidemia, as can be observed in the 2-way ANOVA analysis presented in Supplemental Figure 1B.
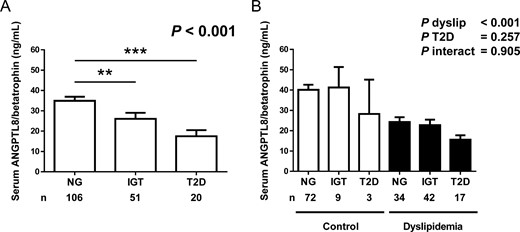
A, Comparison of serum ANGPTL8/betatrophin concentrations in the NG, IGT, and T2D groups in the whole sample (NG, n = 106; IGT, n = 51; T2D, n = 20). Bars represent mean ± SEM. Statistical differences between groups were analyzed by a one-way ANOVA followed by Fisher’s LSD tests. **, P < .01, ***, P < .001 vs NG. B, Serum levels of ANGPTL8/betatrophin in subjects classified according to glycemic status and the presence of dyslipidemia. Bars represent mean ± SEM. Statistical differences between groups were analyzed by a two-way ANOVA.
A highly significant correlation (P < .001 for all), even after adjustment for gender, was found between ANGPTL8/betatrophin and WHR (r = −0.29), markers of insulin resistance (r = −0.28 to r = −0.35), nonHDL-C (r = −0.24), and TG concentrations (r = −0.33), with the highest association observed for HDL-cholesterol levels (r = 0.56) (Supplemental Table 2 and Supplemental Figure 2, A–F). In the multiple linear regression analyses (Supplemental Table 3), the model that best predicted ANGPTL8/betatrophin levels included HDL-C levels (P < .001), sex (P = .007), and uric acid (P = .009) as predictive variables. This model explained 44% of the total variability of ANGPTL8/betatrophin concentrations (P < .001). On the other hand, the model that best predicted HDL-C levels (Supplemental Table 4) included ANGPTL8/betatrophin (P < .001), AST to ALT ratio (P = .002), TG (P = .011), and QUICKI (P = .035) as the predictive variables explaining 46% of the total variability of HDL-C levels (P < .001).
Finally, we analyzed the effect of lipid-lowering drugs in serum ANGPTL8/betatrophin levels (Supplemental Figure 3). Patients under treatment with statins (n = 14, seven males and seven females), although exhibiting a high degree of variability in serum ANGPTL8/betatrophin concentrations, showed no difference with controls, whereas patients taking fibrates (n = 5, three males and two females) showed statistically significant differences with controls (P < .001) and patients under statin treatment (P < .05). However, due to the low levels of individuals in each group, the study of the effect of these drugs on ANGPTL8/betatrophin concentrations in randomized studies is needed. No effect of antihypertensive medication was found.
Discussion
The main findings of the present study are as follows: 1) serum concentrations of ANGPTL8/betatrophin concentrations are markedly reduced in patients with dyslipidemia; 2) the magnitude of the differences in ANGPTL8/betatrophin levels are greater in dyslipidemic patients with low HDL-C (vs high HDL-C) than in dyslipidemic subjects with high TG concentrations (vs low TG); and 3) ANGPTL8/betatrophin levels are closely associated with HDL-C concentrations.
Patients with dyslipidemia included in the present study exhibited a dramatic decrease in serum ANGPTL8/betatrophin concentrations. This finding was consistently observed, regardless of the dyslipidemia diagnosis being based on either HDL-C or TG levels. However, the magnitude of the decrease in ANGPTL8/betatrophin levels was higher in patients classified according to HDL-C levels. To our knowledge there is only one work analyzing the impact of dyslipidemia on ANGPTL8/betatrophin levels reporting increased levels in dyslipidemic patients (27). The study was conducted in a smaller sample of patients with albuminuria, and no information regarding diagnostic criteria, number of dyslipidemic individuals from the whole sample, sex distribution, or antilipidemic medication was provided (27). The discrepancy may be explained by methodological issues because some concerns have been raised regarding the detection of ANGPTL/betatrophin by ELISA (17). In this sense, similar discrepancies regarding ANGPTL8/betatrophin levels in obesity and T2D were found between previous studies performed in different centers reporting decreased values (10–13, 18, 28) and those from other groups reporting increased levels (14, 29) or no changes (16, 30, 31). We carried out the measurements by using an ELISA from two different providers, CUSABIO (the same as the one used in the present study) and AVISCERA, obtaining similar results (10, 11). Strikingly, most of these studies including the study by Chen et al (27) have been performed using the EIAAB ELISA, which paradoxically has been shown to yield ANGTPL8/betatrophin levels that correlate negatively with BMI according to the methodological paper published in Diabetologia (17) and others (31). Other factors such as ethnicity, fasting, nutritional composition of meals, or other metabolic factors could also offer alternative explanations.
It was initially suggested that ANGPTL8/betatrophin was involved in β-cell replication exerting a role in glucose homeostasis (7). Although ANGPTL8/betatrophin levels exhibit a high correlation with several markers of obesity and insulin resistance and a relationship with glucose metabolism cannot be discarded, our two-way ANOVA including T2D or obesity and dyslipidemia as main factors (Figure 2 and Supplemental Figure 1) suggests that ANGPTL8/betatrophin is more deeply involved in lipid metabolism than in obesity or glucose metabolism in humans, and that the altered levels observed in obesity and T2D could be due to the dyslipidemia that frequently accompanies both metabolic conditions (1). Several mice studies have shown that ANGPTL8/betatrophin operates as a blood lipid regulator by modulating serum TG levels (5, 6, 32). ANGPTL8/betatrophin apparently induces TG elevation through reduced TG clearance by lipoprotein lipase (LPL) inhibition (5, 7, 33, 34). Moreover, ANGPTL8/betatrophin overexpression increases TG levels (5, 32), whereas ANGPTL8/betatrophin deficiency reduces TG concentrations associated with both a reduction in very low-density lipoprotein secretion and an increase in LPL activity, exerting no effect on glucose homeostasis (8, 9).
Interestingly, a strong negative association between ANGPTL8/betatrophin and uric acid concentrations was found. Given the cross-sectional nature of our study, it is not possible to find out a mechanism explaining this observation. It is plausible that the underlying mechanisms relate to the association of increased levels of uric acid with obesity and/or the increased insulin resistance, factors frequently associated with hyperuricemia (35) and related to ANGPTL8/betatrophin levels. Further research to clarify this association is warranted.
In agreement with the observations made in mice, human large-scale genomic studies have evidenced that sequence variants in the C19ORF80 gene, the gene encoding ANGPTL8/betatrophin, are associated with lipid traits but not to markers of glucose homeostasis (32, 36). Interestingly, a single-nucleotide polymorphism in the ANGPTL8/betatrophin gene, which substitutes tryptophan for arginine at residue 59, apparently conferring a loss of function, is consistently associated with lower plasma levels of HDL-C (32, 37–39) without changes in TG levels, similarly to what is observed in humans with complete ANGPTL3 deficiency that exhibit in addition reduced TG concentrations (32, 40). Recently it has been shown that inactivating mutations in ANGPTL4 are associated with lower levels of TG and higher HDL-C levels, conferring a lower risk of coronary artery disease (41). The divergent impact of ANGPTL3, ANGPTL4, and ANGPTL8/betatrophin deficiencies in lipid concentrations deserves further research. Therefore, reduced activity of ANGPTL8/betatrophin may render low levels of HDL-C, whereas an increase in ANGPTL8/betatrophin might translate into an HDL-C concentration rise. Data from the present study support this notion, pointing out ANGPTL8/betatrophin as an important regulator of HDL-C. In this sense, we have recently reported that ANGPTL8/betatrophin levels increase after surgically induced but not after diet-induced weight loss, in association with a concomitant increase in HDL-C concentrations (18). In agreement with our data, it has been shown that metabolic syndrome patients with the lowest ANGPTL8/betatrophin levels exhibit the greatest increases in HDL-C levels after being treated with hypocaloric diets (42). Therefore, the development of ANGPTL8/betatrophin-derived drugs that elevate HDL-C concentrations may yield new useful therapeutic tools to combat atherogenic dyslipidemia.
The ANGPTLs 3, 4, and 8 have emerged as key regulators of serum lipid metabolism regulating LPL activity in a tissue-specific fashion in cardiac and skeletal muscles and white adipose tissue, which is controlled by fasting/refeeding (33, 34). ANGPTL3 and -8 have been shown to be oppositely regulated by insulin in the liver (43). Moreover, insulin markedly increases ANGPTL8/betatrophin in adipose tissue and the liver but not in plasma (43). Because ANGPTL3 levels are increased in mice and humans with metabolic syndrome (44, 45), a decrease in ANGPTL8 could be expected. Given the cross-sectional nature of our study, it is not possible to know whether ANGPTL8/betatrophin has an impact on lipids (and HDL-C in particular) or the reverse. It might be speculated that ANGPTL8/betatrophin levels may be decreased in response to the increased lipidemia as a compensatory mechanism aimed at reducing lipid levels. To gain insight into the apparently divergent regulation of the different members of the ANGPTL family and whether their circulating concentrations reflect their actual tissue activity both in the fasting and the postprandial states needs further research.
One limitation of our work is that it is a case-control, cross-sectional study that allows only showing associations, not causality; therefore, future studies analyzing the effect of the modification of ANGPTL8/betatrophin levels on lipid levels in humans should confirm our findings. Because ANGPTL8/betatrophin has been shown to play a key role in the metabolic transition between fasting and refeeding in mice (8), the association of ANGPTL8/betatrophin with lipid levels in humans in the postprandial state also merits further research. Another potential limitation of our study is that we have not measured HDL subspecies such as apolipoprotein A-I or HDL particle number (46, 47). In this sense, future studies might focus on the analysis of the relation of ANGPTL8/betatrophin with cholesterol efflux capacity, a biomarker of reverse cholesterol transport that has been more closely associated with cardiovascular events than HDL-C levels (2). However, whether all these related markers are unequivocally better than HDL-C levels remains to be elucidated, with HDL-C still being considered a highly effective biomarker for predicting cardiovascular risk (4). Another limitation pertains to the generalizability to other populations. This study was conducted in Caucasian subjects and would need to be confirmed in other populations.
In conclusion, our results show that circulating ANGPTL8/betatrophin concentrations are decreased in patients with dyslipidemia defined either as low or high levels of HDL-C or TG, respectively. Moreover, the magnitude of the difference in ANGPTL8/betatrophin levels between cases and controls were markedly greater in dyslipidemia defined by HDL-C. In this sense, ANGPTL8/betatrophin concentrations emerged as a significant determinant of HDL-C levels. Further studies modulating ANGPTL8/betatrophin levels and activity will undoubtedly help to elucidate the exact role of ANGPTL8/betatrophin in lipid homeostasis as well as its therapeutic potential for treating or preventing cardiometabolic alterations.
Acknowledgments
We gratefully acknowledge the valuable collaboration of all the members of the Nutrition Unit for their technical support. We also thank all the subjects who participated in this study.
The funders had no role in the study design, data collection and analysis, decision to publish, or preparation of the manuscript.
This work was supported by grants from the Fondo de Investigación Fondo Europeo de Desarrollo Regional (FEDER), Instituto de Salud Carlos III (Grants PI12/00515, PI13/00460, and PI14/00950) and the Centro de Investigación Biomédica en Red Fisiopatología de la Obesidad y Nutrición, Instituto de Salud Carlos III (Spain).
Disclosure Summary: The authors have nothing to disclose.
Abbreviations
- ALT
alanine aminotransferase
- ANGPTL8
angiopoietin-like protein 8
- AST
aspartate aminotransferase
- BMI
body mass index
- C
controls
- DL
individuals with dyslipidemia
- γ-GT
γ-glutamyltransferase
- HDL
high-density lipoprotein
- HDL-C
HDL-cholesterol
- HOMA
homeostatic model assessment
- IGT
impaired glucose tolerance
- LDL-C
low-density lipoprotein-cholesterol
- LPL
lipoprotein lipase
- LSD
least significant differences
- NG
normoglycemia
- nonHDL-C
non-HDL-C
- OGTT
oral glucose tolerance test
- PAL
physical activity level
- QUICKI
quantitative insulin sensitivity check index
- T2D
type 2 diabetes
- TG
triglycerides
- WBC
white blood cell
- WHR
waist to height ratio.
