


The levels of bone formation and resorption can be assessed at the tissue level by bone histomorphometry on transiliac bone biopsies. Systemic biochemical markers of bone turnover reflect the overall bone formation and resorption at the level of the entire skeleton but cannot discriminate the different skeletal compartments.
Our aim was to investigate the correlations between the serum biochemical markers of formation and resorption with histomorphometric parameters.
We performed post hoc analysis of a previous clinical study.
Patients were selected from the general population.
A total of 371 untreated postmenopausal osteoporotic women aged 50 to 84 years with a lumbar T-score ≤ −2.5 SD or ≤ −1 SD with at least one osteoporotic fracture.
Transiliac bone biopsies were obtained after a double tetracycline labeling, and blood samples were collected.
The static and dynamic parameters of formation and bone resorption were measured by histomorphometry. Serum biochemical markers of formation (bone alkaline phosphatase [ALP]; procollagen type I N-terminal propeptide [PINP]) and resorption (C-terminal crosslinking telopeptide of collagen type 1 [sCTX]) were assessed.
The mean values of biochemical markers were: bone ALP, 15.0 ± 5.2 ng/mL; PINP, 56.2 ± 21.9 μg/mL; and sCTX, 0.58 ± 0.26 ng/mL. Bone ALP and PINP were significantly correlated with both the static and dynamic parameters of formation (0.21 ≤ r' ≤ 0.36; 0.01 ≥ P ≥ .0001). sCTX was significantly correlated with all resorption parameters (0.18 ≤ r' ≤ 0.24; 0.02 ≥ P ≥ .0001).
Bone turnover markers were significantly but modestly associated with bone turnover parameters measured in iliac cancellous bone. The iliac crest bone may not represent perfectly the whole bone turnover.
Bone turnover is characterized by the succession of two opposite activities, the degradation of old bone by the osteoclasts followed by the formation of new bone by osteoblasts. These two phases are coupled in time and space at the level of the basic multicellular unit. Postmenopausal osteoporosis is characterized by an imbalance between resorption and formation in favor of the resorption associated with an increase in the rate of the bone turnover. The negative balance within each remodeling unit associated with the increased number of remodeling units results in a loss of bone mass and a deterioration of the bone architecture. The levels of bone formation and resorption can be assessed at the tissue level by bone histomorphometry in the different bone compartments. This invasive method permits assessment of the bone turnover at the bone structural unit on transiliac biopsies. Bone histomorphometry remains the only method that allows the study of bone remodeling at the basic structural unit level. Furthermore, the use of the tetracycline double labeling provides the measurement of dynamic parameters of bone formation. This method allows for a time dimension in the analysis of the bone turnover. In patients, however, bone biopsies could be obtained only at the iliac crest, except for surgical samples taken at other sites under specific conditions. Previous studies have shown that the level of bone turnover obtained from transiliac bone biopsies is representative of that observed at other sites of the skeleton (1–3). Antiosteoporotic agents, anabolic or antiresorptive drugs, are active at various bone sites, but the basic level of the turnover and the magnitude of treatment response vary across the skeletal sites (4, 5).
Serum assays of biochemical bone turnover markers (BTMs) have been developed to assess either enzymatic activities of osteoblasts and osteoclasts or breakdown products of bone tissue. They reflect the overall bone formation and resorption at the level of the entire skeleton and may help to identify patients at high risk for fracture (6–8) and to monitor the efficacy of antiresorptive or anabolic agents (9). The markers of formation reflect the rate of synthesis of the main constituents of bone tissue. The most sensitive and widely used markers of formation are serum osteocalcin, the bone isoenzyme of alkaline phosphatase (bone ALP), and the procollagen type I N-terminal propeptide (PINP). The bone resorption can be evaluated by the assessment of the breakdown products of type I collagen such as the crosslinks pyridinoline and deoxypyridinoline, the terminal crosslinking telopeptide of type I collagen generated by the cathepsin K (N- and C-terminal telopeptides of type 1 collagen [CTX]) or by matrix metalloprotease. Serum 5b isoenzyme of tartrate-resistant acid phosphatase reflects the number and the crosslinked C-telopeptide of type 1 collagen generated activity of the osteoclasts. Recently, the use of serum PINP (sPINP) and serum CTX (sCTX) as reference biochemical markers of bone formation and resorption, respectively, has been recommended (10). However, BTMs reflect the turnover of the entire skeleton and cannot discriminate the bone turnover changes in the different skeletal compartments. Furthermore, they are not specific of bone because type I collagen is present in other connective tissue, but PINP present in blood mainly derives from bone. In the last few years, new BTM have been developed and are under investigation (11). Several factors may affect the variability of the BTM assays. Fasting and feeding status strongly influences the BTM levels (12). For these reasons, in clinical studies or in clinical practice, blood samples must be collected in the same conditions, preferably in the early morning after an overnight fast.
The relationship between the level of BTMs and the activity of formation or resorption at the tissue level has been poorly investigated in small samples (13–15), and investigators did not address the currently recommended markers, CTX and PINP. The aim of the present study was to investigate whether the BTMs of bone formation (bone ALP and PINP) and resorption (CTX) were correlated with histomorphometric parameters measured on transiliac bone biopsies in a large sample of untreated postmenopausal osteoporotic women.
Subjects and Methods
This study is a post hoc analysis from a previously published randomized controlled trial using alendronate and strontium ranelate (16). Here, we use the baseline data collected before starting the therapies. The selection criteria of patients were fully described in the previous report. Briefly, postmenopausal women were selected if they were at least 50 years old, were postmenopausal for at least 3 years, had a T-score ≤ −2.5 SD at the lumbar L1/L4 and/or femoral neck level, or had a T-score ≤ −1 SD at the lumbar L1-L4 and/or femoral neck level with at least one prevalent low trauma fracture. All patients were ambulatory. Patients were excluded if they had a history of disease affecting bone metabolism other than osteoporosis, had significantly impaired renal function (creatinine clearance < 35 mL/min), had undergone a previous bone biopsy within 1 year, or had a previous double-labeling with tetracycline or tetracycline treatment within 1 year. Patients treated with any drugs developed for bone diseases or interfering with bone metabolism were also excluded. A total of 371 untreated patients aged 50–84 years were selected. The study received ethical review board approval at all sites, and all patients gave informed written consent.
Biochemical markers
Serum BTMs were assessed before any treatment. Markers of bone formation were bone ALP and serum PINP. The marker of bone resorption was sCTX. Fasting blood was collected, and biochemical markers were assessed by immunoassay methods: bone ALP by immunoradiometric assay using the Tandem-R Ostase kit (Beckman Coulter), PINP by RIA using Uniq PINP RIA (Orion Diagnostica), and sCTX by ELISA using the Serum CrossLaps ELISA kit (IDS). The intra-assay coefficients of variation were 2.3–3.7% for bone ALP, 1.6–3% for CTX, and 1.2–4.9% for PINP. The glomerular filtration rate (eGFR) was estimated by the Chronic Kidney Disease Epidemiology collaborators' formula (17).
Bone histomorphometry
A transiliac bone biopsy was performed with a 7.5-mm inner diameter trephine. Before the bone biopsy, patients received a double fluorochrome labeling with 600 mg/d demeclocycline hydrochloride according to the following schedule: 2 days on, 10 days off, 2 days on. Biopsies were performed within 5 to 7 days of the last dose of demeclocycline. The bone biopsy specimens were stored in 70% ethanol.
After fixation in 70% ethanol and dehydration in 100% ethanol, specimens were embedded in methyl methacrylate. Three sets of 8-μm-thick sections were cut 200 μm apart in the central part of the sample. In each set, sections were stained with modified Goldner's trichrome or solochrome cyanine R. Some sections were left unstained for the measurement of the fluorochrome labels under fluorescence (18, 19)
The quantitative analysis was performed on all complete and unbroken samples. The histomorphometry measurements were done on the whole tissue, including the cancellous and endocortical envelopes of three sections (one per set) with a total cancellous bone tissue volume ≥ 20 mm2.
The parameters of bone structure were measured with an automatic image analyzer (MorphoExpert; Explora Nova). The static parameters reflecting resorption, formation, and the dynamic parameters of bone formation and mineralization were measured using a semiautomatic image analyzer (Tablet' Measure; Explora Nova). The abbreviations of the bone histomorphometric parameters used were recommended by the American Society for Bone and Mineral Research Histomorphometric Nomenclature Committee (20). All measured thicknesses were multiplied by π/4. Bone resorption was assessed with measurements of eroded surface (ES)/bone surface (BS; %), osteoclast number (Oc.N)/BS (/mm), osteoclast surface (Oc.S)/BS (%), mean and maximum erosion depth (E.De; μm), eroded volume (EV)/bone volume (BV; %). Static bone formation was reflected by osteoblast surfaces (Ob.S/BS; %), osteoid surfaces (OS/BS; %), volume (OV/BV; %), and thickness (O.Th; μm). Osteoid seams with a minimum width of 2.5 μm were measured. All these parameters were measured on Goldner-stained sections. The mineral apposition rate (μm/d) and the ratio of mineralizing surface (MS)/BS (%) (calculated as double plus half of single labeled surfaces) were analyzed on unstained sections under UV light. The mean wall thickness (μm) was measured in cancellous bone on Solochrome cyanine R-stained sections under polarized light. The bone formation rate (BFR) (BFR/BS [μm3/μm2/d] = [MS/BS] × mineral apposition rate) and activation frequency (Ac.f) (Ac.f per year = [BFR/BS]/wall thickness) were calculated.
Statistical analysis
Results were expressed as mean ± SD. Correlations between BTM and histomorphometric parameters were analyzed by the nonparametric Spearman rank correlation test. A P value < .05 was considered significant.
Results
A total of 371 patients were selected and included in the study. Descriptive statistics for the baseline characteristics and serum BTMs are presented in Table 1. Among these patients, 82 had at least one prevalent osteoporotic fracture, and 26 had eGFR lower than 60 (range, 36 to 59; mean, 53.4 ± 6.2) mL/min/1.73 m2. A total of 367 patients had a complete bone biopsy assessable for bone histomorphometry. Mean values of histomorphometric parameters of formation and resorption are presented in Table 1.
Baseline Characteristics of Patients, Serum Biochemical Markers and Histomorphometric Parameters of Cancellous Bone Remodeling in 371 Untreated Postmenopausal Women With Osteoporosis
| Bone histomorphometry | |
|---|---|
| OS/BS, % | 687 ± 246 |
| OV/BV, % | 5.80 ± 3.04 |
| MS/BS, % | 56.0 ± 4.2 |
| BFR/BS, μm3/μm2/d | 0.037 ± 0.258 |
| Ac.f/y | 0.44 ± 0.30 |
| ES/BS, % | 124.9 ± 5.39 |
| Oc.S/BS, % | 698.6 ± 252.4 |
| Mean E.De, μm | 9.4 ± 2.1 |
| EV/BV, % | 0.46 ± 0.30 |
| Baseline characteristics and biochemical markers | |
| Age, y | 63.70 ± 7.22 |
| Years since menopause | 15.80 ± 7.90 |
| BMI, kg/m2 | 25.80 ± 3.98 |
| eGFR, mL/min/1.73 m2 | 81.91 ± 13.87 |
| sBALP, ng/mL | 15.27 ± 5.39 |
| sPINP, μg/mL | 56.42 ± 20.39 |
| sCTX, ng/mL | 0.60 ± 0.26 |
Abbreviations: BMI, body mass index; sBALP, serum bone ALP. Data are expressed as mean ± SD. eGFR was estimated by the Chronic Kidney Disease Epidemiology formula.
The patients with at least one prevalent osteoporotic fracture were significantly older than those without fracture (age, 66.1 ± 6.9 vs 62.9 ± 7.1 y, respectively; P < .0001). The group with fracture was characterized by a significantly lower sPINP (52.4 ± 16.8 and 57.6 ± 21.2; P < .05) and sCTX (0.53 ± 0.18 and 0.62 ± 0.27; P < .01) when compared to the group without fracture.
Biochemical serum markers of bone formation
Bone ALP and PINP were significantly and negatively correlated with the age of the patients (P < .001 and .002, respectively) and body mass index (P < .04). However, no correlation was found between age and the histomorphometric parameters of bone turnover, which were similar in patients older than 75 years (n = 28) to that in patients younger than 75 years (MS/BS, 5.96 ± 4.15 and 6.10 ± 4.36%; BFR/BS, 0.036 ± 0.025 and 0.038 ± 0.03 μm3/μm2/d; Ac.f, 0.44 ± 0.30 and 0.45 ± 0.32/y in patients younger and older than 75 y, respectively). Bone ALP and PINP were significantly correlated (r'= 0.58; P < .0001) and were also significantly correlated with sCTX (r'= 0.51 and 0.66; P < .0001, respectively).
Bone ALP and PINP were significantly correlated with all static and dynamic parameters of bone formation (0.21 < r' < 0.36; P < .0001) (Table 2 and Figure 1). A significant correlation was also observed between bone ALP or sPINP and the O.Th (P < .002), but after adjustment for age, only PINP remained correlated significantly with the O.Th (P < .01). No correlation was found with the mineralization rate.
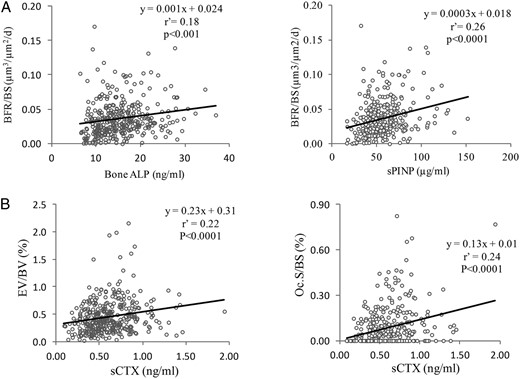
Correlation between the biochemical markers and histomorphometric parameters: A, Correlation between the cancellous BFR/BS and the biochemical markers of the formation may also explain serum bone ALP and sPINP.
B, Correlations between sCTX and the histomorphometric parameters of the resorption in cancellous bone: osteoclast surfaces (Oc.S/BS) and the eroded volume (EV/BV). r', Spearman coefficient of correlation.
Spearman Correlations Between Biochemical Markers and Histomorphometric Parameters of Bone Formation Measured in Cancellous and Endosteal Iliac Bone
| sBALP (n = 367) | sPINP (n = 367) | |||||||
|---|---|---|---|---|---|---|---|---|
| Cancellous | Endosteal | Cancellous | Endosteal | |||||
| r' | P | r' | P | r' | P | r' | P | |
| OS/BS | 0.21 | .0001 | 0.27 | .0001 | 0.24 | .0001 | 0.40 | .0001 |
| Ob.S/BS | 0.24 | .0001 | 0.28 | .0001 | 0.24 | .0001 | 0.41 | .0001 |
| OV/BV | 0.23 | .0001 | 0.26 | .0001 | ||||
| O.Th | 0.12 | .02 | 0.20 | .001 | 0.16 | .002 | 0.26 | .0001 |
| MS/BS | 0.25 | .0001 | 0.30 | .0001 | 0.30 | .0001 | 0.41 | .0001 |
| BFR/BS | 0.24 | .0001 | 0.27 | .0001 | 0.26 | .0001 | 0.39 | .0001 |
| Ac.f | 0.24 | .0001 | 0.26 | .0001 | ||||
Abbreviations: sBALP, serum bone ALP; r', Spearman coefficient of correlation.
Similar results were observed for histomorphometric parameters measured in the cancellous or endosteal bone, with coefficients of correlation slightly higher for endosteal parameters (Table 2).
Biochemical markers of bone resorption
sCTX was significantly correlated with the serum PTH level (P < .001).
sCTX was significantly correlated with all histomorphometric parameters of bone resorption (0.18 < r' < 0.24; P < .0001) (Table 3 and Figure 1). sCTX was also significantly correlated with the static and dynamic parameters of bone formation (0.17 < r' < 0.30; P < .001 to .0001). These correlations were also observed after adjustment for age.
Spearman Correlations Between Biochemical Markers and Histomorphometric Parameters of Bone Resorption Measured in Cancellous and Endosteal Iliac Bone
| sCTX (n = 367) | ||||
|---|---|---|---|---|
| Cancellous | Endosteal | |||
| r' | P | r' | P | |
| ES/BS | 0.22 | .0001 | 0.31 | .0001 |
| Oc.S/BS | 0.24 | .0001 | 0.35 | .0001 |
| Oc.N/BS | 0.24 | .0001 | 0.35 | .0001 |
| EV/BV | 0.22 | .0001 | ||
| Mean E.De | 0.18 | .001 | ||
| Maximum E.De | 0.21 | .0001 | ||
r', Spearman coefficient of correlation.
Similar results were observed for histomorphometric parameters measured in the cancellous or endosteal bone, with coefficients of correlation slightly higher for endosteal parameters (Table 3).
Influence of renal function
In a subgroup of patients (n = 27; mean age, 69 ± 7 y) with eGFR < 60 mL/min/1.73 m2, no correlation was found between the serum BTM and the histomorphometric parameters of bone formation or resorption (Figure 2) in contrast to the patients (n = 344; mean age, 63 ± 7 y) with eGFR higher than 60 mL/min/1.73 m2. But eGFR was significantly correlated with the osteoid parameters (Figure 3).
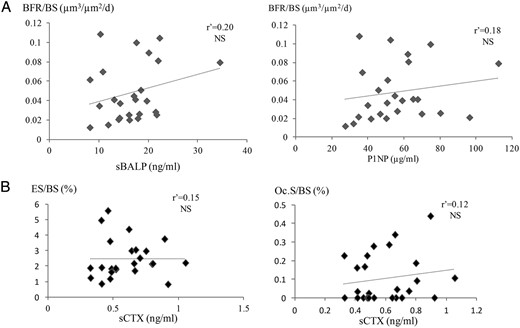
In the subgroup of 26 patients with moderately reduced renal function (eGFR < 60 mL/min/1.73 m2), no correlation was found between: (A) sBALP, sPINP, and histomorphometric parameters of bone formation (BFR/BS, bone formation rate); and (B) sCTX and the histomorphometric parameters of the bone resorption (ES/BS, eroded surfaces; Oc.S/BS, osteoclast surfaces).
r', Spearman coefficient of correlation; sBALP, serum bone ALP.
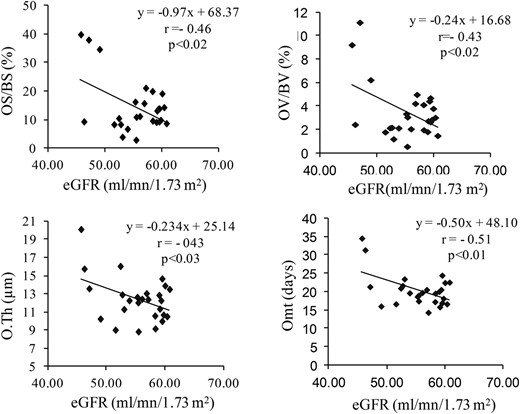
Correlations between osteoid parameters and the GFR in the subgroup of 26 patients with moderately reduced renal function (eGFR < 60 mL/min/1.73 m2).
r': Spearman coefficient of correlation. Omt, osteoïd maturation time.
Discussion
These results showed that in a large population of well-characterized postmenopausal osteoporotic women, the serum BTMs of formation, bone ALP and PINP, were correlated with the histomorphometric parameters of bone formation measured in iliac cancellous bone. Similar results were observed with the parameters assessed in the endosteal compartment. It has been previously reported that bone ALP activity was higher in cancellous than cortical bone with a different distribution of the two isoforms of bone ALP between the bone compartments (21). Bone ALP and PINP are both produced by the osteoblasts, but they reflect different stages of the formation. Bone ALP is an enzyme localized in the osteoblast membrane that is involved in mineralization. PINP is cleaved during the extracellular processing of collagen type I. Collagen being the most abundant organic component of bone matrix, PINP is a good marker of osteoblast activity. These two BTMs are correlated with both static and dynamic parameters of the formation. Static parameters of formation (OS, OV, and O.Th) evaluate the matrix synthesized by the osteoblasts. The dynamic parameters, which are derived from the measurements of the tetracycline labels, reflect the active bone formation and allow for assessing the mineralization rate. Furthermore, in a steady state, ie, when the birth rate of new resorption cavities is equal to the activation of new formation sites, BFR and Ac.f reflect the rate of the bone turnover (22). The coupling between bone resorption and formation may explain the correlation observed also between serum bone ALP, sPINP, and the histomorphometric parameters of resorption.
Significant correlations were observed between sCTX and the histomorphometric parameters of resorption. Several markers of bone resorption are available that are either collagen degradation products such as pyridinoline, deoxypyridinoline, N-terminal telopeptide of type 1 collagen, or noncollagenous protein such as bone sialoprotein or enzymes expressed by osteoclast during the resorption as tartrate-resistant acid phosphates and cathepsin K (23). Based on the specificity for bone resorption, sensitivity to changes related to bone diseases or treatment and the reproducibility of the dosage, sCTX has been recognized as the referent serum marker of resorption (10). In contrast to formation, no dynamic parameter is available for assessing the erosion activity on histological bone sections. The eroded surfaces represent the extent of crenated surfaces, but on histological sections, the site of active resorption at the time of the biopsy cannot be differentiated from those where the resorption is ended and the formation not yet initiated. This is emphasized by the extension of the reversal phase. The parameters evaluating the amount of eroded volume (E.De mean and max, EV/BV) were not directly measured because the pre-existing surface has vanished. Their measurements were based on the reconstruction of the initial bone surface and make assumptions about its position. Nevertheless, despite these limits of the histomorphometric measurements, the resorption parameters measured on cancellous iliac bone were significantly correlated with sCTX, which reflects the resorption at the entire skeleton level.
In a subgroup of 26 patients with moderately reduced renal function (eGFR, 36 to 59 mL/min/1.73 m2), no correlation was found between BTM and histomorphometric parameters, in contrast to previous studies performed in patients with renal osteodystrophy with low or high bone turnover (24). But, except for bone ALP, the markers assessed were different from those analyzed in the present study. In this study, the bone turnover strongly varied, as shown by BFR/BS ranging from 0.001 to 1.66, whereas it was from 0.007 to 0.109 μm3/μm2/d in our subgroup. In contrast, in patients with eGFR higher than 60 mL/min/1.73 m2 (n = 344), the correlations remained significant. CTX and PINP are cleared by the kidney. Therefore, their levels in this subset of moderate chronic kidney disease may reflect more the impaired renal function than bone turnover. Alternatively, the interindividual variability in the BTM levels may also indicate that significant correlations could be evidenced only in a large group of patients. The analysis of a possible influence of the renal function on the BTM levels requires a larger population with a wider range of eGFR.
In conclusion, in a population of postmenopausal osteoporotic women, BTMs were significantly but modestly associated with bone turnover parameters measured at the tissue level in cancellous or endosteal compartments of iliac bone. BTMs reflect the turnover of the entire skeleton, including the periosteal, cortical, endocortical, and cancellous compartments when the histomorphometric parameters assess a small part of the iliac crest. Iliac cancellous bone provides useful information on the bone architecture, turnover, and mineralization, but variability exists across the skeletal sites. BTMs integrate these variations in contrast to bone histomorphometry, which precisely assesses one part of iliac bone. For these reasons, histomorphometry cannot represent perfectly the bone turnover of the entire skeleton.
Acknowledgments
This study has been funded by Servier.
Disclosure Summary: P.C., N.P.-M., J.-P.R., and P.G. have no conflict of interest. R.C. serves on advisory boards of Amgen, Pfizer, and Bioiberica and at conferences of Amgen, Chugai-Roche, BMS, Pfizer, Abbvie, and Lilly.
Abbreviations
- Ac.f
activation frequency
- ALP
alkaline phosphatase
- BFR
bone formation rate
- BS
bone surface
- BTM
bone turnover marker
- BV
bone volume
- CTX
C-terminal telopeptides of type 1 collagen
- E.De
erosion depth
- eGFR
estimated glomerular filtration rate
- ES
eroded surface
- EV
eroded volume
- MS
mineralizing surface
- Ob.S
osteoblast surface
- Oc.N
osteoclast number
- Oc.S
osteoclast surface
- OS
osteoid surface
- O.Th
osteoid thickness
- OV
osteoid volume
- PINP
procollagen type I N-terminal propeptide
- s-
serum.
