


To our knowledge, no study has examined the effects of soy intake on metabolic status of women with gestational diabetes mellitus (GDM).
This study was designed to assess the effects of soy intake on metabolic status of GDM women.
A randomized clinical trial was performed among 68 women with GDM. Women were randomly assigned to receive either a control diet containing 0.8-g/kg protein (70% animal and 30% plant proteins) (n = 34) or a soy diet containing the same amount of protein with 35% animal protein, 35% soy protein, and 30% other plant proteins (n = 34) for 6 weeks.
Compared with soy protein consumption, the control group significantly increased fasting plasma glucose (+1.4 ± 11.6 vs −12.7 ± 13.2 mg/dL, P < .001), serum insulin levels (+5.0 ± 11.6 vs −0.9 ± 10.0 μIU/mL, P = .02), homeostasis model of assessment-insulin resistance (+1.2 ± 2.7 vs −0.8 ± 2.2, P = .002), and decreased quantitative insulin sensitivity check index (−0.007 ± 0.02 vs +0.01 ± 0.03, P = .004). Administration of the control diet resulted in a significant difference in serum triglycerides changes (+31.3 ± 38.0 vs +8.9 ± 46.1 mg/dL, P = .03) compared with soy protein. There were a significant decrease in total antioxidant capacity (−35.0 ± 136.2 vs +81.8 ± 188.8 mmol/L, P = .005) and glutathione (−41.3 ± 145.7 vs +53.3 ± 117.3 μmol/L, P = .004) by the control diet intake compared with soy protein. The control diet group had a higher incidence of newborn hyperbilirubinemia (32.4% vs 8.8%, P = .01) and newborn hospitalization (20.6% vs 2.9%, P = .02) compared with soy protein.
Soy protein consumption in women with GDM significantly improved the glucose homeostasis parameters, triglycerides, and biomarkers of oxidative stress, as well as reductions in the incidence of newborn hyperbilirubinemia and hospitalizations.
Gestational diabetes mellitus (GDM) is a frequent medical condition that is defined as impaired carbohydrate and fat metabolism which has an impact on the insulin resistance and dyslipidemia during pregnancy (1). According to the diagnostic criteria and the studied population, the prevalence of GDM ranges from 1.7% to 11.6% (2). GDM is associated with several aberrations for maternal and their newborns, including pregnancy-induced hypertension, preeclampsia, polyhydramnion, primary cesarean deliveries, increased risk for type 2 diabetes mellitus, neonatal hypoglycemia, hyperbilirubinemia, respiratory distress syndrome, and polycythemia (3, 4).
Recently, human studies have shown the association between dietary pattern and metabolic profiles, inflammatory factors, biomarkers of oxidative stress, and pregnancy outcomes among women with GDM (5–7). In general, healthy dietary pattern may be favorably associated with the metabolic profiles and inflammatory markers (8, 9). A longitudinal study showed that soy protein consumption for 4 years significantly decreased lipid profiles and inflammatory factor among patients with type 2 diabetic who had nephropathy (10). In addition, a significant reduction in insulin levels and lipid profiles was seen after the soy protein substitution for 12 weeks among hyperlipidemic hemodialysis patients (11). However, no significant difference in lipid levels or insulin sensitivity was found after 24 weeks of soy-based supplementation (30-g soy protein, 9-g cotyledon fiber, and 100-mg isoflavones) in hypercholesterolaemic participants (12).
Favorable effects of soy protein on metabolic profiles may result from the higher arginine to lysine and methionine amino acid (13), up-regulation of low-density lipoprotein (LDL) receptors by the 7S globulin protein exists in soy (14), isoflavone content (15) and trace components such as plant sterols, phytates, folates and oxalates (13). According to the best of our knowledge, no study assessed the effect of soy protein intake on glucose homeostasis parameters, lipid profiles, markers of inflammation and oxidative stress in patients with GDM. We hypothesized that the consumption of soy protein diet might help GDM patients to control their metabolic profiles. The aim of the current study was to determine the effects of soy protein intake on metabolic status of women with GDM.
Subjects and Methods
Patients
This randomized, parallel clinical trial was performed in Kashan, Iran, from September 2014 to January 2015 in accordance with the Declaration of Helsinki of 1975, as revised in 2008 and Good Clinical Practice guidelines. The Ethics Committee of Kashan University of Medical Sciences (KUMS) reviewed and approved the study protocol (registered in the Iranian registry of clinical trials, IRCT201412085623N31). Written informed consent was obtained from all patients before the intervention. Based on the suggested formula for parallel clinical trials, considering the type 1 error of 5% and the study power of 80%, we reached the sample size of 28 for each group. However, we recruited 34 patients in each group (totaled 64 persons) to compensate for the probable loss of follow-up. The inclusion criteria were pregnant women with GDM diagnosed by a “one-step” 2-hour 75-g oral glucose tolerance test and aged 18–40 years (at wk 24–28 of gestation). A diagnosis of GDM (one-step) was based on the American Diabetes Association criteria (16). When anyone of the next plasma glucose values was met or exceeded were diagnosed with GDM: fasting plasma glucose (FPG) more than or equal to 92 mg/dL, 1-hour value more than or equal to 180 mg/dL, or 2-hour value more than or equal to 153 mg/dL. In addition, we did not include women who had FPG more than 105 and blood glucose 2-hour postprandial more than 120 mg/dL because of ethical consideration, because they might needed insulin therapy. In the present study, we were excluded if they had a history of diabetes (type 1 or type 2 diabetes or glucose intolerance already diagnosed in the current pregnancy), or significant renal impairment, or those with premature preterm rupture of membrane, placenta abruption, preeclampsia, eclampsia, chronic hypertension, and hypothyroidism. Gestational age was assessed from the date of last menstrual period and concurrent clinical assessment (17). After screening 90 pregnant women with GDM in the Naghavi maternity clinic affiliated with KUMS, 68 patients were eligible for enrollment. At the beginning of the study, all patients were matched based on body mass index (BMI) (<30 and ≥30 kg/m2) and weeks of gestation (<26 or ≥26 wk). Then, patients were randomly allocated into 2 groups to receive either soy protein (n = 34) or control diet (n = 34) for a duration of 6 weeks.
Study design
Women were randomly assigned to receive either a diet (control diet) containing 0.8-g/kg protein (70% animal and 30% plant proteins) (n = 34), or a diet (soy diet) containing the same amount of protein with 35% animal protein, 35% soy protein, and 30% other plant proteins (n = 34) for a duration of 6 weeks. Randomization and allocation were done by a trained midwife and were masked from the researcher and patients until the main analyses were completed. Although the duration of the supplementation was only 6 weeks, we followed the patients until delivery. Pregnant women in the soy protein group received textured soy protein (Sobhan). In addition, all participants received education regarding the preparation of their meals with soy protein. A trained nutritionist explained that soy protein should be washed and soaked for 30 minutes and then cooked in boiling water with turmeric, lemon juice, and tomato paste for 10 minutes. Based on our analysis, the nutrients composition (per 30 g) of soy protein consumed by the study participants were as follows: protein (15 g), fat (0.3 g), fiber (10 g), total phytoestrogen (75 mg), magnesium (89 mg), calcium (85 mg), and potassium (1 mg). The soy protein used in our study was a commercially available product. The protein and fat values of the soy were measured according to the methods of Kjeldahl and Soxhlet, respectively. Fiber content was assessed gravimetrically as the difference in weights of a test sample before and after extraction in a solution. All pregnant women were requested not to change their routine physical activity or usual dietary intakes during the study and were asked not to consume any soy protein products other than those provided to them by the investigators. In addition, all patients followed the national supplementation guideline and consumed 400 μg/d of folic acid starting at the beginning of pregnancy and 60 mg/d of ferrous sulfate as of the second trimester. All patients provided 3 dietary recalls (once during the weekend and on 2 weekdays) and 3 physical activity records to verify that they maintained their usual diet and physical activity during the intervention. Both dietary recalls and physical activity records were taken at weeks 2, 4, and 6 of intervention. To obtain information on participant nutrient intake based on these 3-day food diaries, we used Nutritionist IV software (First Databank) modified for the Iranian foods.
Assessment of anthropometric variables
All patients were assessed for the anthropometric measurements, including height and body weight at the beginning of the study and 6 weeks after the intervention. Height in standing position and without shoes and body weight, whereas participants were minimally clothed without shoes using digital scales (Seca) were determined. BMI was calculated as body weight (kg)/height2 (m). A trained midwife at the maternity clinic measured anthropometric indices. Infant length and weight were measured using standard methods (Seca 155 Scale) during the first 24 hours after birth and were recorded to the nearest 1 mm and 10 g, respectively. Infant head circumference was measured to the nearest 1 mm with a Seca girth measuring tape. All anthropometric measures were performed by a trained midwife. We also collected data on infants' 1- and 5-minute Apgar scores. Macrosomic babies were defined as those whose birth weight was more than 4000 g (18). Newborn hospitalization was defined as hypoxia, low-risk Apgar scores 6–7 (at 5 or 15 min of age), high-risk Apgar scores at 1 minute 0–5 and at 5 or 15 minutes less than 6, hyperbilirubinemia, birth weight less than 2500 g, and/or gestational age less than 32 weeks, sepsis, pneumonia, or meningitis, hypoglycemia (blood glucose <1.7 mmol/L) (19).
Biochemical and polyhydramnios assessment
Before the onset and after the end-of-trial, 10-mL blood samples were taken from each patient at the Kashan reference laboratory. Blood was collected in 2 separate tubes: 1) one without EDTA to separate the serum, in order to quantify serum insulin, lipid profiles and high-sensitivity C-reactive protein (hs-CRP) levels; and 2) another one containing EDTA to examine FPG, nitric oxide (NO), and biomarkers of oxidative stress. FPG levels were measured on the day blood was collected. Blood samples were immediately centrifuged (Hettich D-78532) at 3500 rpm for 10 minutes to separate the serum. Serum lipid profiles were also measured on the day of blood collection. The samples were then stored at −70°C until being analyzed at the KUMS reference laboratory. Commercial kits were used to determine FPG, serum cholesterol, triglycerides, very-LDL-cholesterol (VLDL-C), LDL-C, and high-density lipoprotein-cholesterol (HDL-C) concentrations (Pars Azmun). All inter- and intraassay coefficient of variations for FPG, lipid profiles were less than 5%. Serum insulin levels were measured by ELISA kit (Monobind). Homeostasis model of assessment-insulin resistance (HOMA-IR) and homeostasis model of assessment-estimated β-cell function (HOMA-B) and quantitative insulin sensitivity check index (QUICKI) were calculated based on suggested formulas (20). Serum hs-CRP was determined using an ELISA kit (LDN). The plasma NO concentrations were determined by the Griess method modified by Tatsch et al (21). Plasma total antioxidant capacity (TAC) was assessed by the use of the ferric reducing antioxidant power method modified by Benzie and Strain (22). Plasma total glutathione (GSH) was examined using the method of Beutler and Gelbart (23). Plasma malondialdehyde (MDA) was measured by using the colorimetry method (24). Coefficient of variations for plasma TAC, GSH, and MDA were 0.9%, 2.5%, and 3.6%, respectively. Hyperbilirubinemia was defined as total serum bilirubin level at or above 15 mg/dL (257 mol/L) in infants 25–48 hours old, 18 mg/dL (308 mol/L) in infants 49–72 hours old, and 20 mg/dL (342 mol/L) in infants older than 72 hours (25). Polyhydramnios was diagnosed using sonographic estimation at the postintervention. On the basis of this measurement, polyhydramnios was defined as an amniotic fluid index in excess of 25 cm (26).
Statistical analysis
At first, we were checked normal distribution of all variables with the Kolmogorov-Smirnov test. Intention-to-treat analysis of the primary study end-point was performed for all the randomly assigned participants. Independent sample Student's t test was used to detect differences in the general characteristics and dietary intake between the 2 groups. The Pearson χ2 test was used to compare categorical variables. To determine the effects of soy protein intake on markers of insulin metabolism, lipid profiles, inflammatory factors, and biomarkers of oxidative stress biomarkers, we used two-way repeated measures ANOVA, where treatment × time interactions were tested by using Pillai's trace. In these analyses, the treatments (soy protein vs control) were regarded as between-subject factors, and time with 2 time points (baseline and wk 6 of the intervention) was considered a within-subject factor. To identify within-group differences (before and after the 6-wk intervention), we used paired-samples t tests. We used two-way repeated measures ANOVA in the adjusted models, which were adjusted for maternal age, baseline values, including baseline BMI. Statistical significance was defined as P < .05. Statistical analysis was performed by using SPSS for Windows version 18.0 (SPSS).
Results
As demonstrated in the study flow diagram (Figure 1), during the intervention phase of the study, 2 patients due to personal reasons were excluded from the control group. Finally, 66 participants (soy protein group [n = 34] and control group [n = 32]) completed the trial. However, because the analysis was based on the intention-to-treat, all 68 women (34 in each group) were included in the final analysis.
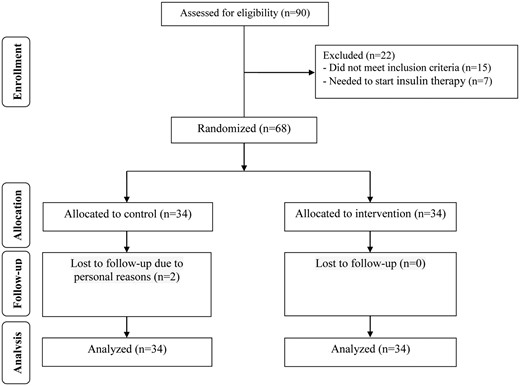
Summary of patient flow diagram.
Baseline demographic characteristics of patients in the 2 groups were not statistically different (Table 1).
General Characteristics of Women With GDM
| Control Group (n = 34) | Soy Protein Group (n = 34) | P Value | |
|---|---|---|---|
| Maternal age (y) | 29.3 ± 4.2 | 28.2 ± 4.6 | .30 |
| Height (cm) | 160.4 ± 4.4 | 162.5 ± 4.9 | .06 |
| Weight at study baseline (kg) | 72.9 ± 8.5 | 76.1 ± 12.3 | .22 |
| Weight at end-of-trial (kg) | 74.8 ± 8.5 | 78.3 ± 12.1 | .16 |
| Weight change (kg) | 1.9 ± 0.9 | 2.2 ± 1.0 | .08 |
| BMI at study baseline (kg/m2) | 28.4 ± 3.4 | 28.9 ± 5.0 | .63 |
| BMI at end-of-trial (kg/m2) | 29.1 ± 3.4 | 29.7 ± 5.0 | .54 |
| BMI change (kg/m2) | 0.7 ± 0.3 | 0.8 ± 0.4 | .12 |
All values are mean ± SD. P values were obtained from independent t tests.
Based on the 3-day dietary recalls obtained throughout the intervention, statistically significant differences were observed between the 2 groups in terms of dietary intakes of energy (P = .01), fats (P = .006), saturated fatty acids (P = .01), polyunsaturated fatty acids (PUFAs) (P = .02), cholesterol (P = .01), and total dietary fiber (P = .01) (Table 2).
Dietary Intake of Women With GDM Throughout the Study
| Control Group (n = 34) | Soy Protein Group (n = 34) | P Value | |
|---|---|---|---|
| Energy (kcal/d) | 2426 ± 191 | 2308 ± 194 | .01 |
| Carbohydrates (g/d) | 331.1 ± 43.3 | 315.1 ± 41.9 | .08 |
| Protein (g/d) | 87.6 ± 10.1 | 86.7 ± 15.0 | .75 |
| Fat (g/d) | 86.5 ± 14.3 | 77.6 ± 12.0 | .006 |
| SFAs (g/d) | 24.5 ± 5.3 | 20.9 ± 5.9 | .01 |
| PUFAs (g/d) | 28.9 ± 7.8 | 24.8 ± 6.8 | .02 |
| Cholesterol (mg/d) | 207.0 ± 114.7 | 151.5 ± 70.3 | .01 |
| TDF (g/d) | 18.4 ± 5.0 | 21.4 ± 5.1 | .01 |
All values are mean ± SD. P values were obtained from independent t tests. SFA, saturated fatty acid; TDF, total dietary fiber.
After 6 weeks of intervention, compared with soy protein consumption, the control group significantly increased FPG (+1.4 ± 11.6 vs −12.7 ± 13.2 mg/dL, P < .001), serum insulin levels (+5.0 ± 11.6 vs −0.9 ± 10.0 μIU/mL, P = .02), HOMA-IR (+1.2 ± 2.7 vs −0.8 ± 2.2, P = .002), and decreased QUICKI (−0.007 ± 0.02 vs +0.01 ± 0.03, P = .004) (Table 3). Administration of the control diet resulted in significant differences in serum triglycerides (+31.3 ± 38.0 vs +8.9 ± 46.1 mg/dL, P = .03) and VLDL-C changes (+6.3 ± 7.6 vs +1.8 ± 9.2 mg/dL, P = .03) compared with soy protein. There were a significant decrease in plasma TAC (−35.0 ± 136.2 vs +81.8 ± 188.8 mmol/L, P = .005), GSH (−41.3 ± 145.7 vs +53.3 ± 117.3 μmol/L, P = .004), and a significant increase in MDA levels (−0.1 ± 0.8 vs +0.4 ± 1.4 μmol/L, P = .04) by the control diet intake compared with soy protein. We did not observe any significant effect of soy protein intake on other lipid profiles and inflammatory factors. In addition, within-group differences demonstrated a significant rise in serum insulin (P = .01), HOMA-IR (P = .01), HOMA-B (P = .02), serum triglycerides (P < .001), VLDL-C (P < .001), and total-cholesterol to HDL-C ratio (P = .02) in the control group. Within-group differences indicated a significant reduction in FPG (P < .001) and a significant rise in QUICKI (P = .01), TAC (P = .01), and GSH (P = .01) in the soy group.
Metabolic Profiles, Markers of Inflammation, and Oxidative Stress at Baseline and After a 6-Week Intervention in Women With GDM
| Control Group (n = 34) | Soy Protein Group (n = 34) | P Valueb | |||||||||
|---|---|---|---|---|---|---|---|---|---|---|---|
| Wk0 | Wk6 | Change | P Valuea | Wk0 | Wk6 | Change | P Valuea | Time | Group | Time × Group | |
| FPG (mg/dL) | 91.9 ± 9.5 | 93.3 ± 10.7 | 1.4 ± 11.6 | .49 | 95.4 ± 9.5 | 82.7 ± 9.3 | −12.7 ± 13.2 | <.001 | <.001 | .05 | <.001 |
| Insulin (μIU/mL) | 13.6 ± 5.5 | 18.6 ± 12.6 | 5.0 ± 11.6 | .01 | 16.9 ± 9.5 | 16.0 ± 10.1 | −0.9 ± 10.0 | .55 | .12 | .82 | .02 |
| HOMA-IR | 3.1 ± 1.4 | 4.3 ± 2.8 | 1.2 ± 2.7 | .01 | 4.1 ± 2.3 | 3.3 ± 2.2 | −0.8 ± 2.2 | .05 | .47 | .99 | .002 |
| HOMA-B | 49.5 ± 19.9 | 68.9 ± 51.6 | 19.4 ± 46.2 | .02 | 59.9 ± 34.9 | 65.8 ± 42.3 | 5.9 ± 42.3 | .42 | .02 | .63 | .21 |
| QUICKI | 0.3 ± 0.02 | 0.3 ± 0.03 | −0.007 ± 0.02 | .10 | 0.3 ± 0.02 | 0.3 ± 0.01 | 0.01 ± 0.03 | .01 | .39 | .51 | .004 |
| Triglycerides (mg/dL) | 182.1 ± 62.8 | 213.4 ± 71.1 | 31.3 ± 38.0 | <.001 | 168.9 ± 62.4 | 177.8 ± 64.8 | 8.9 ± 46.1 | <.001 | .10 | .56 | .03 |
| VLDL-C (mg/dL) | 36.4 ± 12.5 | 42.7 ± 14.2 | 6.3 ± 7.6 | <.001 | 33.8 ± 12.5 | 35.6 ± 12.9 | 1.8 ± 9.2 | <.001 | .10 | .56 | .03 |
| TC (mg/dL) | 207.8 ± 45.6 | 212.5 ± 44.2 | 4.7 ± 20.0 | .17 | 179.1 ± 31.7 | 182.8 ± 34.9 | 3.7 ± 24.2 | .12 | .002 | .19 | .84 |
| LDL-C (mg/dL) | 110.9 ± 31.3 | 111.9 ± 32.2 | 1.0 ± 16.1 | .73 | 84.9 ± 21.5 | 86.6 ± 24.9 | 1.7 ± 12.3 | .44 | <.001 | .29 | .81 |
| HDL-C (mg/dL) | 60.4 ± 14.3 | 57.9 ± 12.7 | −2.5 ± 7.3 | .05 | 60.5 ± 11.6 | 60.6 ± 11.2 | 0.1 ± 9.4 | .25 | .61 | .99 | .20 |
| T-/HDL-C ratio | 3.5 ± 0.8 | 3.8 ± 0.9 | 0.3 ± 0.6 | .02 | 3.0 ± 0.7 | 3.0 ± 0.5 | 0.02 ± 0.3 | .03 | .001 | .24 | .07 |
| hs-CRP (ng/mL) | 6498.2 ± 3837.9 | 7255.0 ± 3956.0 | 756.8 ± 2813.3 | .12 | 5894.3 ± 4307.3 | 5493.4 ± 3637.1 | −400.9 ± 3145.9 | .62 | .18 | 0.45 | .11 |
| NO (μmol/L) | 100.3 ± 36.7 | 98.8 ± 55.3 | −1.5 ± 42.5 | .84 | 111.2 ± 32.7 | 115.4 ± 33.0 | 4.2 ± 30.7 | .75 | .12 | .001 | .52 |
| TAC (mmol/L) | 727.8 ± 144.7 | 692.8 ± 105.9 | −35.0 ± 136.2 | .14 | 614.5 ± 109.4 | 696.3 ± 210.2 | 81.8 ± 188.8 | .24 | .07 | .007 | .005 |
| GSH (μmol/L) | 592.1 ± 288.5 | 550.8 ± 229.3 | −41.3 ± 145.7 | .10 | 390.7 ± 86.4 | 444.0 ± 107.4 | 53.3 ± 117.3 | .70 | .001 | .20 | .004 |
| MDA (μmol/L) | 3.4 ± 1.4 | 3.8 ± 1.9 | 0.4 ± 1.4 | .07 | 3.3 ± 0.8 | 3.2 ± 0.8 | −0.1 ± 0.8 | .25 | .20 | .07 | .04 |
All values are mean ± SD. TC, total cholesterol.
Obtained from paired-samples t tests.
P values represent the time × group interaction (computed by analysis of the two-way repeated measures ANOVA).
However, after adjustment for baseline values no significant changes in our findings occurred, except for serum insulin (P = .07), total-cholesterol to HDL-C ratio (P = .005), serum hs-CRP (P = .04), plasma TAC (P = .13), and GSH levels (P = .38). Additional adjustments for maternal age and baseline BMI did not affect our findings, except for total-cholesterol to HDL-C ratio (P = .01), plasma TAC (P = .13), and total GSH levels (P = .46) (Table 4).
Adjusted Changes in Metabolic Variables of Pregnant Women With GDM
| Control Group (n = 34) | Soy Protein Group (n = 34) | P Value | |
|---|---|---|---|
| FPG (mg/dL) | 0.1 ± 1.7 | −11.4 ± 1.7 | <.001 |
| Insulin (μIU/mL) | 4.6 ± 1.8 | −0.6 ± 1.8 | .04 |
| HOMA-IR | 1.0 ± 0.4 | −0.6 ± 0.4 | .008 |
| HOMA-B | 18.7 ± 7.6 | 6.6 ± 7.6 | .26 |
| QUICKI | −0.007 ± 0.005 | 0.01 ± 0.005 | .005 |
| Triglycerides (mg/dL) | 31.4 ± 7.3 | 8.8 ± 7.3 | .03 |
| VLDL-C (mg/dL) | 6.3 ± 1.5 | 1.8 ± 1.5 | .03 |
| TC (mg/dL) | 6.7 ± 3.9 | 1.7 ± 3.9 | .38 |
| LDL-C (mg/dL) | 1.8 ± 2.7 | 0.9 ± 2.7 | .83 |
| HDL-C (mg/dL) | −2.4 ± 1.3 | 0.07 ± 1.3 | .18 |
| T/HDL-C ratio | 0.3 ± 0.1 | −0.01 ± 0.1 | .01 |
| hs-CRP (ng/mL) | 765.9 ± 462.4 | −410.1 ± 462.4 | .08 |
| NO (μmol/L) | −4.4 ± 6.2 | 7.2 ± 6.2 | .20 |
| TAC (mmol/L) | −8.7 ± 28.1 | 55.5 ± 28.1 | .13 |
| GSH (μmol/L) | −5.3 ± 20.7 | 17.4 ± 20.7 | .46 |
| MDA (μmol/L) | 0.5 ± 0.2 | −0.2 ± 0.2 | .04 |
All values are mean ± SE. Values are adjusted for baseline values, maternal age and baseline BMI. P values were obtained from two-way repeated measures ANOVA (time × group interaction). TC, total cholesterol.
The control diet group had a higher incidence of newborn hyperbilirubinemia (32.4% vs 8.8%, P = .01) and newborn hospitalization (20.6% vs 2.9%, P = .02) compared with soy protein diet (Table 5). No significant differences in the cesarean section rates, need for an insulin therapy after the intervention, polyhydramnios, maternal hospitalization, preterm delivery, gestational age, newborn birth size, Apgar score, and newborn hypoglycemia were observed after soy protein consumption compared with the control group.
Associations Between Soy Protein Intake and Pregnancy Outcomes
| Control Group (n = 34) | Soy Protein Group (n = 34) | P Valuea | |
|---|---|---|---|
| Cesarean section, n (%) | 14 (41.2) | 14 (41.2) | 1.00b |
| Need to insulin therapy after intervention, n (%) | 2 (5.9) | 2 (5.9) | 1.00b |
| Preeclampsia, n (%) | 1 (2.9) | 2 (5.9) | .55b |
| Polyhydramnios, n (%) | 1 (2.9) | 0 (0.0) | .31b |
| Maternal hospitalization, n (%) | 4 (11.8) | 3 (8.8) | .69b |
| Preterm delivery, n (%) | 1 (2.9) | 2 (5.9) | .55b |
| Macrosomia >4000 g, n (%) | 5 (14.7) | 3 (8.8) | .45b |
| Gestational age (wk) | 38.8 ± 1.1 | 39.2 ± 1.5 | .17 |
| Newborns' weight (g) | 3395.3 ± 410.1 | 3252.7 ± 508.9 | .20 |
| Newborn length (cm) | 50.7 ± 1.6 | 50.6 ± 2.4 | .90 |
| Newborn head circumference (cm) | 35.6 ± 1.7 | 35.4 ± 1.7 | .51 |
| 1-min Apgar score | 8.9 ± 0.1 | 8.9 ± 0.2 | .56 |
| 5-min Apgar score | 9.9 ± 0.1 | 9.9 ± 0.2 | .56 |
| Newborn hyperbilirubinemia, n (%) | 11 (32.4) | 3 (8.8) | .01b |
| Newborn hospitalization, n (%) | 7 (20.6) | 1 (2.9) | .02b |
| Newborn hypoglycemia, n (%) | 1 (2.9) | 3 (8.8) | .30b |
Values are mean ± SD.
Obtained from independent t tests.
Obtained from Pearson χ2 tests.
Discussion
The results of the current study, performed among patients with GDM, showed that 6-week soy substitution in the diet has resulted in a significant decrease in FPG, serum insulin, HOMA-IR, a significant difference in serum triglycerides and VLDL-C as well as a significant rise in QUICKI, plasma TAC and GSH levels compared with the control group but did not affect other lipid profiles and inflammatory factors. To the best of our knowledge, this study is the first that investigate the effect of soy protein intake on metabolic profiles, inflammatory factors, and biomarkers of oxidative stress among women with GDM.
Patients with GDM are susceptible to several aberrations, including metabolic disorders, inflammation reactions, and oxidative stress (27). In agreement with our findings, a 2-month dietary fat reduction and soy food supplementation containing 50-mg isoflavones/d had resulted in a significant decrease in the insulin levels among postmenopausal women (28). Furthermore, a significant reduction in the fasting glucose was observed after 1 year of soy isoflavone supplementation among postmenopausal Chinese women (29). However, a 6-month randomized controlled trial of soy protein with or without isoflavone supplementations did not influence glycemic control and insulin sensitivity among Chinese postmenopausal women (30). The results of our study may support a direct pharmacologic effect of soy constituents on the markers of insulin metabolism. We assumed that PUFAs of soy protein might have beneficial effects on the glucose homeostasis parameters (31). In addition, soy protein may decrease insulin resistance through improved translocation of glucose transporter type 4 and the oxidative and nonoxidative pathways of glucose metabolism (32).
Favorable effects of soy consumption on the blood lipids were the most consistently reported findings. A metaanalysis by Anderson et al (33) showed a significant reduction in triglycerides levels (11%) with the daily consumption of 47 g of soy protein. Two recent metaanalyses have reported that the isoflavone content of soy may be responsible for its lipid-lowering effects (34, 35). Controversy still exists in the field regarding the relative contribution of the potential mechanisms of action of soy protein, isoflavones, and other trace components in soy, such as effect of plant sterols on the lipid profiles and lipoproteins.
In consistent with our results, soy milk consumption for 4 weeks had no significant effects on hs-CRP, TNF-α, and IL-6 levels among type 2 diabetic patients with nephropathy (36). In addition, a high-soy diet for 4 weeks had no effect on vascular NO production in ovariectomized rats (37). However, CRP levels were decreased after a therapeutic lifestyle changes diet, in which 0.5 cup of soy nuts (25 g of soy protein and 101 mg of aglycone isoflavones) replaced with daily intake of 25 g of nonsoy protein for 8 weeks among postmenopausal women (38). The absence of significant effect of soy protein intake on the inflammatory markers in the current study compared with other studies might be explained by different study designs, different values of soy used, and general characteristics of the study participants.
Supporting our results, Azadbakht et al (39) found that soya consumption for 8 weeks reduced plasma MDA and increased plasma TAC levels in the postmenopausal women with the metabolic syndrome (39). Furthermore, black soy peptide supplementation in subjects with prehypertension or stage I hypertension for 8 weeks has resulted in a significant decrease in MDA levels (40). In another study by Yang et al (41) was seen that rats fed peptic-digested soy protein had lower MDA levels in the heart and aorta, whereas no changes in circulating MDA were found. However, soy protein with or without isoflavones showed no significant effect on the antioxidant capacity levels (42). Increased oxidative stress is one of the causative factors of many diseases such as atherosclerosis (43). Previous studies have reported that soy protein intake may reduce oxidative stress through inhibiting oxidative modification of LDL in vitro (44). In addition, the antioxidative activity of soy protein can potentially be mediated by its amino acid composition or the effects of soy peptides. For instance, high L-arginine in soy protein is reported to have antioxidative activity (45).
To the best of our knowledge, no study has evaluated beneficial effects of soy protein on pregnancy outcomes; however, few studies have evaluated the association between maternal HOMA-IR, HOMA-B, and newborn hyperbilirubinemia. In a study by Zhang et al (46), newborn hyperbilirubinemia was closely associated with maternal glucose and insulin levels. Maternal hyperglycemia and insulin resistance would result in the subsequent induction of fetal hyperinsulinemia and reduced oxygenation, which in turn may lead to increased fetal oxygen uptake, fetal erythropoiesis, and subsequent hyperbilirubinemia (47). In the current study, the reduced incidence of newborn hyperbilirubinemia may be mediated by decreased maternal hyperglycemia and improved markers of insulin metabolism among women in the soy protein group compared with mothers in the control group.
Limitations of the present study include a relatively short duration of the intervention and the lack of testing for a dose-response relationship between soy protein intake and occurred changes in the metabolic profiles and biomarkers of oxidative. Despite these limitations, soy protein that we used had no side effects on women with GDM. Further studies are still required to clarify the mechanisms of how soy protein affects metabolic status of women with GDM. The results of those studies may be used to modify the dietary guidelines for preventing and treatment of women with GDM.
In conclusion, soy protein consumption in women with GDM significantly improved the glucose homeostasis parameters, triglycerides and biomarkers of oxidative stress, as well as reductions in the incidence of newborn hyperbilirubinemia and hospitalizations. In the current study, observed effects of soy protein intake on newborn hyperbilirubinemia and hospitalizations must be interpreted with caution. Future studies are required to confirm our findings.
Acknowledgments
We thank the staff of Naghavi Maternity Clinic (Kashan, Iran) for their assistance on this project. We also thank Dr Fariba Kolahdooz, who reviewed the manuscript and offered critical comments.
Author contributions: Z.A. contributed in conception, design, statistical analysis, and drafting of the manuscript; M.J. contributed in data collection and manuscript drafting; and Z.A. supervised the study. Both authors read and approved the final version of the article.
This work was supported by the Vice-Chancellor for Research, Kashan University of Medical Sciences, Kashan, Iran Grant 93159.
Disclosure Summary: The authors have nothing to disclose.
Abbreviations
- BMI
body mass index
- FPG
fasting plasma glucose
- GDM
gestational diabetes mellitus
- GSH
glutathione
- HDL-C
high-density lipoprotein-cholesterol
- HOMA-B
homeostasis model of assessment-estimated β-cell function
- HOMA-IR
homeostasis model of assessment-insulin resistance
- KUMS
Kashan University of Medical Sciences
- LDL
low-density lipoprotein
- hs-CRP
high-sensitivity C-reactive protein
- MDA
malondialdehyde
- NO
nitric oxide
- PUFA
polyunsaturated fatty acid
- QUICKI
quantitative insulin sensitivity check index
- TAC
total antioxidant capacity
- VLDL-C
very-LDL-cholesterol.
