


In most populations a greater proportion of men have hepatic steatosis than women. Sex-specific differences in hepatic dietary fatty acid (FA) metabolism have not been well characterized. We compared fasting and postprandial hepatic FA synthesis (de novo lipogenesis [DNL]) and oxidation in men and women.
Fasting and postprandial hepatic FA metabolism was studied in 22 healthy men (n = 11) and women with similar age, body mass index, and liver fat content using metabolic substrates labeled with stable-isotope tracers (2H2O and [U13C]palmitate). Dietary FA oxidation was assessed by appearance of 13C into plasma 3-hydroxybutyrate and breath CO2 as markers of liver and whole-body FA oxidation, respectively.
Despite similar liver fat content, fasting and postprandial plasma triacylglycerol (TG) concentrations were significantly (P < .05) higher in men compared with women. The appearance of 13C from dietary FA into plasma 3-hydroxybutyrate and breath CO2 was greater (P < .05) in women compared with men. Although the contribution of DNL into very low-density lipoprotein (VLDL)-TG was similar (∼10%) in the fasting state, there was a divergence in pattern over the course of the study, with men maintaining a higher contribution of DNL to VLDL-TG than women (P = .006 time x sex interaction).
The combination of lower dietary FA oxidation and a prolonged increase in DNL observed in men may represent partitioning of FA into esterification and storage pathways within the liver, leading to greater VLDL-TG production, and predispose to the sex difference in hepatic steatosis.
Nonalcoholic fatty liver disease (NAFLD) encompasses a disease spectrum in individuals who do not consume excess alcohol (1). Risk factors for NAFLD include obesity and male gender (1, 2). The Dallas Heart Study (3) and Family Heart Study (4) have reported that the prevalence of hepatic steatosis is higher in white men compared with white women. Hepatic steatosis is associated with an overproduction of very low-density lipoprotein (VLDL) triacylglycerol (TG) and raised plasma TG concentrations (5, 6). Men tend to have higher plasma total and VLDL-TG concentrations than women (7), which may, in part, be attributable to differences in liver fat content.
The reason why fat starts to accumulate within hepatocytes remains unclear but must involve an imbalance between input and disposal. Supply of fatty acids (FA) to the liver is a major determinant of VLDL-TG production and can be influenced by a number of hormonal and nutritional factors (8). We have previously reported no difference in the postprandial contribution of multiple FA sources to VLDL-TG between insulin-sensitive men and women (9). Excessive hepatic FA synthesis (de novo lipogenesis [DNL]) is suggested to be involved in the development of hepatic steatosis; individuals with NAFLD have increased hepatic DNL compared with those without (10).
Removal of FA from the liver occurs by secretion as VLDL-TG and by FA oxidation (11). Kinetic studies suggest women have an enhanced production and clearance of VLDL-TG compared with men (7). Few studies have investigated sex-specific differences in FA oxidation. After a prolonged overnight fast, we found young women partition FA toward 3-hydroxybutyrate (3OHB) production to a greater extent than young men (12). Postprandial blood 3OHB concentrations have been found to be higher in women compared with men, by some (13), but not all (9).
The reason for sexual dimorphism in prevalence and risk of NAFLD remains unclear but will depend, to some degree, on the balance between the availability and removal of FA in the liver; the transition from fasted to fed state is likely to fundamentally alter hepatic FA partitioning. Therefore, we aimed to study hepatic FA metabolism and partitioning in men and women representative of the UK adult population (14) before and after consumption of a mixed meal. Additionally, we measured markers of cholesterol and bile acid metabolism as alterations in these have been implicated in NAFLD development (15, 16).
Research Design and Methods
Subjects
We recruited healthy males and females who were of a similar age and body mass index (BMI) from the Oxford Biobank (17) and invited them for screening to ensure suitability for the study. Subjects were metabolically healthy, not taking medication known to affect lipid or glucose metabolism, were nonsmoking and consumed alcohol within the recommended limits (1). We screened a total of 28 subjects (13 women and 15 men) of whom four were excluded for not meeting the inclusion criteria; we studied a total of 11 females and 13 males to achieve 22 subjects (11 women and 11 men) of similar age, BMI, and liver fat content (which was not measured until entry into the study). The study was approved by the Portsmouth Clinical Research Ethics Committee; all subjects gave written informed consent.
Genotype data were generated on 5554 Oxford Biobank DNAs using the Illumina Infinium Human Exome-12 version 1.2 beadchip. The genetic variant 738409 in the gene encoding patatin-like phospholipase containing 3 (PNPLA3 I148M) was extracted from the full data set under the Illumina feature identification exm1615904 using the PLINK version 1.9 software for 10 men and 10 women (data were not available for one man and one woman).
Liver fat and body composition
Intrahepatic fat was measured after an overnight fast, and within 2 weeks of the metabolic study day, using proton magnetic resonance spectroscopy and whole-body composition and fat quantification and distribution were measured using dual-energy X-ray absorptiometry (18).
Metabolic study day
Prior to the study day, subjects were asked to avoid foods naturally enriched in 13C and refrain from strenuous exercise and alcohol. Participants arrived at the clinical research unit after an overnight fast and after consuming deuterated water (2H2O) (3 g/kg body water) the evening prior to the study day, and then consumed enriched water (2.5 g per 500 mL water) until the end of the study day, to achieve and maintain a plasma water enrichment of 0.3% for the measurement of fasting and postprandial hepatic DNL. A cannula was placed in an antecubital vein and baseline (time 0) blood and breath samples were taken. Participants were then fed a standard test meal consisting of 40 g Rice Krispies (Kellogg), 200 g skimmed milk, and a chocolate milkshake containing 40 g of olive oil (40 g fat, 40 g carbohydrate). Two hundred milligrams of [U13C]palmitic acid was added to the chocolate milkshake to trace the fate of the dietary FA. At 360 minutes, subjects were given a glucose drink (75 g glucose) to assess the second meal effect (19). Repeated blood and breath samples were taken over the course of the study period at 0, 30, 60, 120, 180, 240, 300, 360, 390, and 420 minutes after consumption of the meal. Indirect calorimetry was performed at 120, 240, and 360 minutes after the consumption of the meal using a Gem calorimeter to determine whole-body CO2 production and whole-body respiratory exchange ratio (RER) (GEMNutrition Ltd).
Biochemical analysis
Whole blood was collected into heparinized syringes (Sarstedt Ltd), and plasma was separated by centrifugation. Plasma metabolites and insulin were analyzed as previously described (9). Plasma was added to perchloric acid for analysis of acetoacetate and 3OHB as described (20). The plasma concentration of unesterified lathosterol was determined by isotope dilution mass spectrometry (MS) (21). Sitosterol and campesterol were extracted from plasma and analyzed by gas chromatography (GC)/MS (22). 7α-Hydroxy-4-cholesten-3-one (C4) was extracted from plasma and analyzed using liquid chromatography/MS/MS (23).
Separations of Svedberg flotation rate (Sf) greater than 400 (chylomicrons) and TG-rich lipoprotein (TRL) fraction (Sf 20–400) were made by sequential flotation using density gradient ultracentrifugation (9). The Sf 20–400 fraction was further separated by immunoaffinity chromatography to obtain a fraction completely devoid of apolipoprotein (apo) B48 and will hereafter be called VLDL (9). Plasma lipoproteins were also separated by size-exclusion chromatography followed by on-line determination of total and free cholesterol (24). Lipoprotein cholesteryl esters were calculated by subtracting values of free from total cholesterol.
Blood samples were taken at 0, 30, 60, 90, 120, 180, 240, 300, 360, 390, and 420 minutes after the consumption of the test meal for the measurement of plasma glucose, insulin, TG, nonesterified FAs (NEFAs), acetoacetate, 3OHB, chylomicron-TG, and TRL-TG and at 0, 180, 240, 300, 360, and 420 minutes for the analysis of VLDL-TG. Breath samples were collected at 0, 60, 90, 120, 180, 240, 300, 360, 390, and 420 minutes into EXETAINER tubes (Labco Ltd) for measurement of 13CO2 enrichment.
FA methyl esters were prepared from plasma NEFAs, TG, and lipoprotein fractions and FA composition determined by GC and palmitate concentrations calculated (9). [U13C]palmitate enrichment in plasma NEFA, TG, Sf greater than 400 (chylomicron-TG), Sf 20–400-TG (TRL), and VLDL-TG FA methyl esters derivatives, the 13C to 12C ratio in breath samples and the relative rate of whole-body meal-derived FA oxidation were calculated as previously described (9). To allow for sequestration of label into the bicarbonate pool a dietary acetate recovery factor of 51% was applied to both men and women as it has previously been reported that sexual-dimorphism does not exist (25). The data were corrected for lean mass (determined by dual energy X-ray absorptiometry) to account for sex-specific differences.
To assess ketone body production arising from the oxidation of dietary [U13C]palmitate, we measured the isotopic enrichment and concentration of [13C] in plasma 3OHB (12). Fasting and postprandial hepatic DNL was assessed based on the incorporation of deuterium from 2H2O in plasma water (Finnigan GasBench-II; ThermoFisher Scientific) into VLDL-TG palmitate using GC-MS with monitoring ions with mass to charge ratios of 270 (M+0) and 271 (M+1) (26). Absolute DNL was calculated by multiplying percentage DNL and the concentration of TG in VLDL (27). We assessed the synthesis of newly made palmitate into VLDL-TG, but for simplicity, we will refer to this as DNL.
Statistical methods
Data were analyzed using SPSS for Windows version 15 (SPSS UK). Statistical significance was set at P < .05. All data are presented as mean ± SD unless stated. Comparisons in anthropometric and fasting parameters between men and women were made using an independent t test or Mann-Whitney U tests for nonparametric data. Repeated-measures ANOVA, with time and sex as factors, were used to investigate the change between sexes over time. Areas under the curve (AUC) were calculated by the trapezoid method and divided by the relevant period to give a time-averaged value. Correlations were performed using Spearman rank correlation.
Results
Participant characteristics
Men and women were similar in age, BMI, and liver fat content (Table 1). Women had significantly (P < .001) more body fat than men, whereas men had significantly (P < .05) more visceral fat than women (Table 1). Liver fat content was only weakly associated with visceral fat content in men (rs = 0.53, P = .07) and women (rs = 0.59, P = .06). Analysis of the genetic variant PNPLA3 I148M revealed two homozygous (148MM) women but no men and two heterozygous (148IM) women and four men (Table 1).
Characteristics of Study Participants
| Women (n = 11) | Men (n = 11) | |
|---|---|---|
| Age, y | 46 ± 6 | 46 ± 7 |
| BMI, kg/m2 | 28 ± 3 | 27 ± 2 |
| Waist circumference, cm | 91 ± 7 | 95 ± 7 |
| Hip circumference, cm | 107 ± 5 | 100 ± 5a |
| Total fat mass, kg | 33 ± 8 | 24 ± 5a |
| Lean mass, kg | 43 ± 3 | 56 ± 4b |
| Android fatc | 0.08 ± 0.02 | 0.10 ± 0.02a |
| Gynoid fatc | 0.18 ± 0.02 | 0.14 ± 0.02b |
| Android to gynoid ratio | 0.45 ± 0.13 | 0.72 ± 0.19b |
| Visceral fat, kg | 0.80 ± 0.52 | 1.44 ± 0.70d |
| Liver fat, % | 4.1 ± 3.4 | 4.6 ± 2.8 |
| HOMA-IR | 2.6 ± 1.5 | 2.4 ± 0.8 |
| PNPLA3 I148M genotype‡ | ||
| II | 6 | 6 |
| IM | 2 | 4 |
| MM | 2 | |
Data are expressed as mean ± SD.
P < .01, independent t test, women vs men.
P < .001, independent t test, women vs men.
Corrected for total fat mass.
P < .05, independent t test, women vs men.
Data for n = 10 women and n = 10 men.
Plasma biochemical parameters
Although liver fat content was similar, men had significantly (P < .05) higher fasting plasma TG and VLDL-TG concentrations (Table 2). Despite plasma total cholesterol (TC) concentrations not significantly differing between sexes, women had lower plasma VLDL-TC (P < .05) and higher high-density lipoprotein (HDL)-TC (P < .01) concentrations compared with men (Table 2). There were no sex differences in the postprandial response of plasma glucose or insulin (Table 2). We found no difference in the whole-body RER in the mean postprandial state between men (0.82 ± 0.03) and women (0.83 ± 0.02).
Biochemical Parameters of Study Participants
| Women (n = 11) | Men (n = 11) | |
|---|---|---|
| Fasting plasma concentrations | ||
| TG, mmol/L | 1.0 ± 0.5 | 1.7 ± 0.9a |
| Glucose, mmol/L | 5.0 ± 0.2 | 5.0 ± 1.0 |
| Insulin, mU/L | 11.4 ± 6.2 | 10.8 ± 2.6 |
| NEFAs, μmol/L | 488 ± 121 | 451 ± 108 |
| 3OHB, μmol/L | 67 ± 36 | 54 ± 31 |
| Acetoacetate, μmol/L | 42 ± 23 | 38 ± 13 |
| VLDL-TG, μmol/L | 607 ± 410 | 997 ± 435a |
| TC, mmol/L | 5.2 ± 0.7 | 4.8 ± 0.6 |
| VLDL-TC, mmol/L | 0.2 ± 0.1 | 0.5 ± 0.4a |
| LDL-TC, mmol/L | 3.3 ± 0.6 | 3.1 ± 0.7 |
| HDL-TC, mmol/L | 1.7 ± 0.3 | 1.2 ± 0.3b |
| Time-averaged postprandial plasma concentrations | ||
| Glucose, mmol/L | 5.5 ± 0.4 | 5.6 ± 0.4 |
| Insulin, mU/L | 29.9 ± 15.7 | 27.9 ± 10.1 |
Abbreviation: LDL, low-density lipoprotein. Data are expressed as mean ± SD.
P < .05, independent t test, women vs men.
P < .01, independent t test, women vs men.
We further investigated sex differences in VLDL-TC and HDL-TC; women had significantly lower (P < .05) plasma free and esterified VLDL cholesterol and higher (P < .01) free and esterified HDL cholesterol concentrations compared with men (Table 3). The molar ratio of VLDL-TG to VLDL-ApoB was significantly (P < .05) higher in women compared with men (Table 3). Plasma biomarkers for whole-body cholesterol synthesis, intestinal cholesterol absorption, and bile acid synthesis did not differ between sexes (Table 3).
Fasting Plasma Lipoprotein Composition and Markers of Cholesterol Synthesis
| Women (n = 11) | Men (n = 11) | |
|---|---|---|
| Total FC, mmol/L | 1.09 ± 0.15 | 1.09 ± 0.15 |
| VLDL-FC, mmol/L | 0.09 ± 0.05 | 0.18 ± 0.08a |
| LDL-FC, mmol/L | 0.67 ± 0.12 | 0.66 ± 0.15 |
| HDL-FC, mmol/L | 0.33 ± 0.06 | 0.25 ± 0.05a |
| Total EC, mmol/L | 4.09 ± 0.57 | 3.69 ± 0.54 |
| VLDL-EC, mmol/L | 0.14 ± 0.09 | 0.36 ± 0.32b |
| LDL-EC, mmol/L | 2.58 ± 0.52 | 2.38 ± 0.53 |
| HDL-EC, mmol/L | 1.37 ± 0.26 | 0.95 ± 0.28a |
| VLDL-TG/VLDL-ApoBc | 20 409 ± 8834 | 12 751 ± 8070b |
| VLDL-EC/VLDL-ApoBc | 9326 ± 16 138 | 6490 ± 5047 |
| VLDL-FC/VLDL-ApoBc | 6689 ± 2936 | 4571 ± 3180 |
| Cholesterol synthesis: lathosterol/TCc | 0.97 ± 0.42 | 1.37 ± 0.88 |
| Intestinal cholesterol absorption: sitosterol/TCc | 1.61 ± 0.4 | 1.65 ± 0.60 |
| Intestinal cholesterol absorption: campesterol/TCc | 1.87 ± 0.64 | 2.14 ± 1.35 |
| Bile acid synthesis: C4/TCc | 7.81 ± 8.07 | 11.93 ± 14.49 |
Abbreviations: EC, esterified cholesterol; FC, free cholesterol; LDL, low-density lipoprotein. Data are expressed as mean ± SD.
P < 0.01, independent t test, women vs men.
P < 0.05, independent t test, women vs men.
Molar ratio.
Consumption of the test meal resulted in a significant (P < .001) increase in plasma TG over time in both sexes; this was greater in men (P < .05), even after accounting for the fasting plasma TG concentration (Figure 1A). The postprandial rise in chylomicron-TG was notably higher in men (P < .001 effect of time, P < .05 effect of sex, P < .01 time × sex interaction) (Figure 1B). Although there appeared to be a similar response in plasma NEFA between men and women over the postprandial period (P < .001 effect of time), subtle differences existed as we observed a time × sex interaction (P < .05) (Figure 1C). Men had significantly (P < .05) higher concentrations of VLDL-TG compared with women over the postprandial period (Figure 1D). Although there was no sex difference in fasting plasma acetoacetate and 3OHB concentrations, consumption of the test meal elicited notably different responses between the sexes for acetoacetate (P < .001 effect of time, P < .05 time × sex interaction) (Figure 1E) and 3OHB (P < .001 effect of time, P < .01 time × sex interaction) (Figure 1F).
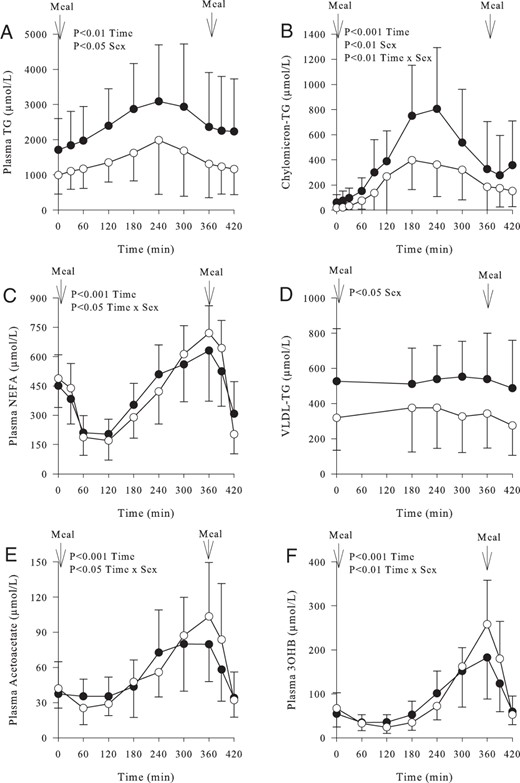
Fasting and postprandial concentrations of plasma metabolites in women (○) (n = 11) and men (●) (n = 11) over time.
A, Plasma TG concentrations (P < .001 effect of time, P < .05 effect of sex). B, Plasma chylomicron-TG concentrations (P < .001 effect of time, P < .05 effect of sex, P < .01 time × sex interaction). C, Plasma NEFA concentrations (P < .001 effect of time, P < .05 time × sex interaction). D, Plasma VLDL-TG concentrations (P < .05 effect of sex). E, Plasma acetoacetate concentrations (P < .001 effect of time, P < .05 time × sex interaction). F, Plasma 3OHB concentration (P < .001 effect of time, P < .01 time × sex interaction). Data are presented as mean ± SD.
Isotopic enrichment of plasma and breath
Inclusion of [U13C]palmitate into the test meal provided the opportunity to trace the fate of recently ingested dietary FA. The incorporation of [U13C]palmitate in chylomicron-TG was notably different between sexes (P < .001 effect of time, P < .05 effect of sex, P < .05 time × sex interaction) (Figure 2A). After consumption of the second meal (at 6 h), we did not see a notable divergence in the amount of [U13C]palmitate (from dietary fat in the first meal) incorporated into chylomicron-TG at 7 hours, suggesting no difference in the second meal effect. There was an increase (P < .001) in the appearance of [U13C]palmitate in the systemic plasma NEFA pool over time until between 360 and 420 minutes when women had a greater suppression in appearance of 13C in the NEFA pool than men (70% ± 17% vs 47% ± 23%, P < .05 women vs men, respectively) (Figure 2B). The appearance of U13C in VLDL-TG increased (P < .001) over time with no difference in [U13C]palmitate concentration between sexes (Figure 2C).
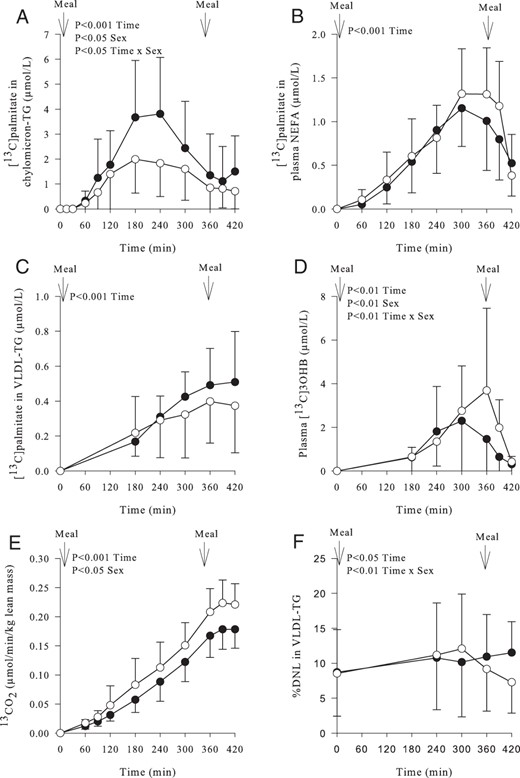
Postprandial enrichment in plasma metabolites and breath and hepatic de novo lipogenesis in women (○) (n = 11) and men (●) (n = 11) over time.
A, Concentration of [U13C]palmitate in plasma chylomicron-TG (P < .001 effect of time, P < .05 effect of sex, P < .05 time × sex interaction). B, Concentration of [U13C]palmitate in plasma NEFA (P < .001 effect of time). C, Concentration of [U13C] palmitate in plasma VLDL-TG (P < .001 effect of time). D, Appearance of [13C] in plasma 3OHB (P < .01 effect of time, P < .01 effect of sex, P < .01 time × sex interaction). E, Appearance of [13C] from dietary fatty acids in breath CO2 (per unit lean mass) (P < .001 effect of time, P < .05 effect of sex). F, The relative (percentage) contribution of newly synthesized palmitate from DNL to VLDL-TG (P < .05 effect of time, P < .01 time × sex interaction). Data are presented as mean ± SD.
We measured the incorporation of 13C into plasma 3OHB as a marker of hepatic FA oxidation. Women had greater plasma [13C]3OHB concentrations compared with men (P < .01 effect of time; P < .01 effect of sex; P < .01 time × sex interaction) (Figure 2D). Women produced significantly more 13CO2 than men (P < .001 effect of time, P < .05 effect of sex) (Figure 2E).
In the fasting state, there was no difference in the relative (percentage) contribution of DNL in VLDL-TG between sexes (Figure 2F). Consumption of the test meal increased DNL in both sexes after which there was a divergence with men maintaining a prolonged contribution of DNL compared to women (P < .01 effect of time, P < .01 time × sex interaction) (Figure 2F). There were no sex differences in the absolute (micromoles) contribution of DNL in VLDL-TG in the fasting or over postprandial period; however, by the end of the study the absolute contribution of DNL in VLDL-TG was significantly (P < .05) higher for men than women (data not shown).
Correlations between biochemical parameters and DNL
There was a strong positive correlation between DNL and plasma VLDL-TG concentrations (both as AUC) in men (rs = 0.75, P < .05) and women (rs = 0.79, P < .01) (Figure 3A). The ratio of plasma C4 to plasma TC is a biomarker of bile acid synthesis, which has been shown to increase DNL and hepatic TG content in rodents (28). We found a strong correlation between the ratio of plasma C4 to TC and fasting DNL in men (rs = 0.80, P < .01) but not in women (rs = 0.54, P = .09) (Figure 3B). Finally, we assessed the relationship between DNL and plasma [13C]3OHB concentrations (both as AUC) and found a striking inverse association in men (rs = −0.93, P < .001), with a less obvious association in women (rs = −0.49, P = .13) (Figure 3C). We did not find any associations between liver fat content and DNL or 3OHB in either sex.
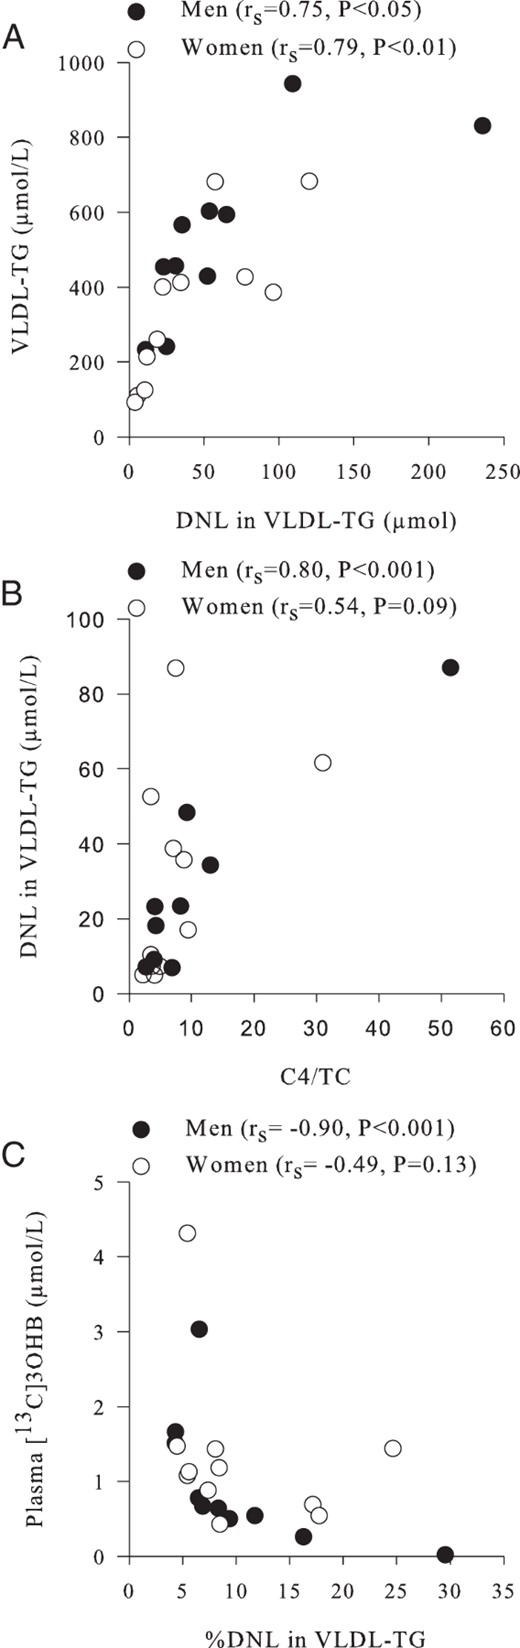
Associations between hepatic DNL and plasma metabolites in women (○) (n = 11) and men (●) (n = 11).
A, The relationship between the contribution (micromoles per liter) of newly synthesized palmitate (DNL) in plasma VLDL-TG (as an AUC) and plasma VLDL-TG concentrations (as an AUC). B, The ratio of plasma C4 to cholesterol (a marker of bile acid synthesis) and the fasting contribution (micromoles per liter) of DNL in plasma VLDL-TG. C, The association between the contribution of DNL in plasma VLDL-TG (as an AUC) and plasma [13C]3OHB concentrations (as an AUC).
Discussion
The prevalence of hepatic steatosis is higher in white men compared with white women (3, 4); the reasons for this remain unclear but will depend, to some degree, on the balance between the availability and removal of FA in the liver. By studying men and women of a similar age, BMI, and liver fat content, in the fasting and postprandial state using metabolic substrates labeled with stable-isotope tracers, we observed clear differences in hepatic FA partitioning despite no difference in liver fat content; women tended to favor oxidation pathways, whereas men tend to favor synthetic pathways. Our observations of differences in postprandial hepatic FA partitioning and synthesis may in part explain the divergence in prevalence of hepatic steatosis (3, 4) and plasma total and VLDL-TG concentrations (7) between white men and women. It could be expected that these differences would be augmented had we studied men with a higher liver fat content than women.
FA supply to the liver and synthesis within the liver is an important determinant of VLDL-TG production (and possibly liver fat accumulation) (11). We have previously reported no difference in the contribution of systemic plasma NEFA and dietary FA to VLDL-TG between insulin-sensitive men and women (9). In the present study, we did not find notable differences in fasting plasma NEFA concentrations. The appearance of [13C]palmitate in the plasma NEFA pool was consistent with spillover from chylomicron-TG hydrolysis (29); this did not differ between sexes until consumption of the second meal when women had greater suppression than men, which may lead to a lower FA flux to the liver in women compared with men.
In fasting, DNL has been reported to contribute to less than 10% of FA in VLDL-TG in healthy individuals (10, 30), and our data are in line with this for men and women; however, near the end of the postprandial period, there was a notable divergence in response. Women had a significantly lower contribution (relative and absolute) of DNL to VLDL-TG than men. Timlin and Parks (30) reported that feeding healthy men two test meals (5 h apart) resulted in greater DNL after consumption of the second meal, suggesting this was due to the time delay for the sensitization of the liver to up-regulate lipogenic enzymes. Although subjects in the present study consumed two test meals, it is likely peak DNL was not achieved due to the notably shorter study duration, and it is possible that the noted divergence in DNL between the sexes may have been augmented if measured over a longer time period. Animal work has suggested a role for estrogen in attenuating hepatic DNL, with hepatic acetyl-CoA carboxylase activity being reduced with estrogen treatment in female rats (31), whereas oophorectomy increased the expression of sterol regulatory element binding protein 1c (SREBP1c) and liver TG content (32) and estrogen treatment reversed hepatic steatosis in males rats with aromatase deficiency (33). These observations suggest estrogen may, in part, explain some of the divergence in response in hepatic DNL between men and women. Individuals with NAFLD have been reported to have higher hepatic DNL than those without NAFLD by some (10, 34) but not all (35). Mancina et al (35) recently reported significantly lower fasting hepatic DNL and expression of the lipogenic transcription factor SREBP1c in individuals with the genetic variant PNPLA3 148M, despite having greater liver fat than individuals without the PNPLA3 148M allele. These data demonstrate that increased hepatic DNL is not always a key feature of individuals with NAFLD (35).
We did not find an association between liver fat content and DNL at any time point. Liver fat content has been positively associated with fractional fasting DNL and VLDL-TG secretion from DNL in subjects (n = 24) with and without liver fat (10). We found DNL strongly associated with VLDL-TG concentrations in both sexes. We also noted a positive correlation between the ratio of plasma C4 to TC (a marker of bile acid synthesis [36]) and fasting DNL in men but not women. Rodent studies have demonstrated that increased bile acid synthesis increases hepatic TG content, DNL, and lipogenic gene expression, a response that appears to be farnesoid X receptor and liver X receptor-α-dependent and involve SREBP1c (28). The strong association noted in men between the plasma C4 to TC and fasting DNL suggest these processes are tightly linked and are under joint control but may be sex specific.
The disposal of FA via oxidation pathways may play an important role in preventing hepatic TG accumulation. In line with the findings of others (37), we found no clear sex differences in the markers of hepatic FA oxidation in the fasting state but observed distinct sexual dimorphism in the postprandial pattern of response. By measuring the incorporation of 13C from meal-derived FA into plasma 3OHB, we found that a proportion of recently ingested dietary-derived FA entering the liver were used for ketogenesis; this occurred to a greater extent in women than men. We observed a robust inverse association between postprandial DNL and plasma [13C]3OHB concentrations in men but not women. A plausible explanation for the sex-specific difference in plasma [13C]3OHB may be due to the differences in the pattern of postprandial DNL, with women decreasing DNL during the postprandial period, whereas men did not. Rodent work has demonstrated an intermediate in the DNL pathway; malonyl-CoA is a potent inhibitor of carnitine palmitoyltransferase 1, which transports fatty acyl-CoA into the mitochondrion (38). Therefore, it is plausible that decreasing DNL resulted in a decrease in intrahepatocellular malonyl-CoA concentrations, leading to greater transport of fatty acyl-CoA into the mitochondria in women compared with men. It is unclear whether there are sex-specific differences in habitual intrahepatocellular concentrations of malonyl-CoA.
We measured the incorporation of 13C into expired CO2, as a marker of whole-body FA oxidation and found 13CO2 production (per unit of lean mass) was significantly higher in women compared with men, suggesting greater oxidation of recently ingested dietary FA. This is in contrast to the finding of no difference in dietary FA oxidation between young, lean men and women after consumption of a high-fat meal (39). The authors suggested that because the liver is responsible for approximately one-third of FA oxidation in the fasting state, the lack of difference provided evidence that hepatic metabolism of ingested fat was similar between young, lean men and women (39). We found notable changes in markers of dietary FA oxidation but did not observe a difference between the sexes in the postprandial whole-body RER, suggesting whole-body FA oxidation did not differ. It is possible that the sex-specific divergence in FA oxidation markers we observed were not large enough to result in a change in whole-body RER. Roberts et al (40) previously reported notable differences in whole-body and tissue specific 13CO2 production, despite no difference in postprandial whole-body RER.
In line with previous work (41), we found women had a greater molar ratio of VLDL-TG to VLDL-ApoB compared with men, suggesting women secrete larger, TG-rich VLDL than men. Small, rather than large, VLDL has been implicated in atherosclerosis progression (42). We found women had lower fasting VLDL cholesterol (free and esterified) and higher HDL cholesterol concentrations compared with men. Emerging evidence has linked altered cholesterol metabolism with NAFLD development (15). Free cholesterol is esterified by acyl-coenzyme A-cholesterol acyltransferase 2 (Acat2), exclusively expressed in enterocytes and hepatocytes (43); mice lacking ACAT2 accumulate less hepatic cholesteryl esters and TG (44). Women have lower Acat2-activity compared with men (45), which may contribute to their lower prevalence of NAFLD compared with men.
Men have a higher prevalence and greater risk of NAFLD compared with women. Our data show that differences in intrahepatic FA partitioning and DNL may go some way to explaining this sexual dimorphism. Our data indicate sex-specific differences in the regulation of oxidation and hepatic DNL, with men failing to suppress DNL as fast as women; thus, cellular metabolism is moved away from FA oxidation toward esterification (Supplemental Figure 1, A and B). Along with an increased risk of NAFLD, men have a higher risk of cardiometabolic diseases, which may be attributed to higher plasma TG, higher free and esterified VLDL cholesterol concentrations, and production of smaller denser VLDL particles as observed in our study.
Acknowledgments
We thank Louise Dennis, Rachel Craven-Todd, Jane Cheeseman, and the clinical research unit staff for the excellent nursing provision; Marje Gilbert for her technical assistance; Sandy Humphreys for the helpful statistical advice and technical assistance; and Ross Milne for the antibodies. We also thank the volunteers from the Oxford Biobank, National Institute for Health Research Oxford Biomedical Research Centre, for their participation. The Oxford Biobank (www.oxfordbiobank.org.uk) is also part of the National Institute for Health Research National Bioresource, which supported the recalling process of the volunteers.
This work was supported by grants from the British Heart Foundation (Fellowship FS/11/18/28633 to L.H.), the Henning and Johan Throne-Holst Foundation (to C.P.), and the National Institute for Health Research Oxford Biomedical Research Centre (to F.K.).
Disclosure Summary: The authors have nothing to disclose.
Abbreviations
- Acat2
acyl-coenzyme A-cholesterol acyltransferase 2
- apo
apolipoprotein
- AUC
area under the curve
- BMI
body mass index
- C4
7α-hydroxy-4-cholesten-3-one
- CE
cholesteryl ester
- DNL
de novo lipogenesis
- FA
fatty acid
- GC
gas chromatography
- HDL
high-density lipoprotein
- MS
mass spectrometry
- NAFLD
nonalcoholic fatty liver disease
- NEFA
nonesterified FA
- 3OHB
3-hydroxybutyrate
- RER
respiratory exchange ratio
- Sf
Svedberg flotation rate
- SREBP1c
sterol regulatory element binding protein 1c
- TC
total cholesterol
- TG
triacylglycerol
- TRL
TG-rich lipoprotein
- VLDL
very low-density lipoprotein.
