


The diagnosis of metabolic syndrome (MetS) identifies individuals at risk for developing diabetes and cardiovascular disease. African Americans (AAs) have high rates of cardiovascular disease and subclinical vascular disease including arterial stiffness and microvascular dysfunction but have relatively low rates of MetS.
The objective of the study was to evaluate the relationship between MetS and vascular function in a biracial cohort with the hypothesis that the diagnosis of MetS underestimates subclinical vascular disease in AAs.
We measured components of MetS in a community-based cohort of 951 AAs and white subjects (aged 48.8 ± 11 y, 47% AA, 55% female).
Using digital pulse amplitude tonometry, we estimated the reactive hyperemia index (RHI), a measure of microvascular endothelial function. Using applanation tonometry (Sphygmocor), central augmentation index (CAIx) and pulse wave velocity (PWV) were measured as indices of wave reflections and arterial stiffness, respectively.
MetS was present in 24.0% of subjects and was associated with increased PWV (P < .001) and CAIx (P < .001) and a trend to lower RHI (P = .068) in both races. However, in subjects without MetS, AAs had lower RHI (P < .001) and higher PWV (P = .003) and CAIx (P = .002) compared with white subjects. Addition of an extra MetS criterion point for AAs with hypertension eliminated the racial differences in PWV and CAIx but not RHI.
Although MetS is associated with microvascular dysfunction and increased arterial stiffness in both racial groups, AAs without MetS have greater vascular dysfunction compared with whites. Additional weighting for hypertension in AAs attenuated the racial differences in subclinical disease associated with MetS.
The metabolic syndrome (MetS) represents a clustering of risk factors in individuals with increased visceral fat and its presence is associated with a 5-fold increased risk of type 2 diabetes mellitus and a 2-fold risk of cardiovascular disease (CVD) (1–3). In 2009 the International Diabetes Federation and the American Heart Association/National Heart, Lung, and Blood Institute proposed a harmonized definition for MetS. This criterion requires the presence of at least three of the following five components: abdominal obesity, hypertriglyceridemia, reduced high-density lipoprotein cholesterol (HDL-C), elevated blood pressure (BP), or elevated fasting glucose and includes population-specific cutoffs for waist circumference (Supplemental Tables 1 and 2) (4). However, no specific criterion changes were recommended for African American (AA) populations.
AAs suffer from a higher incidence and prevalence of CVD, mortality, stroke, congestive heart failure, type 2 diabetes mellitus, and end-stage renal disease but are less likely to be diagnosed with MetS than whites (5, 6). Available data suggest that AAs are more prone to sc (vs visceral) fat accumulation for a given body mass index (BMI) (7, 8). Whereas hypertriglyceridemia and reduced HDL-C are more common in whites, AAs are more likely to suffer from hypertension and impaired fasting glucose (9–12). It is also paradoxical that AA males, who have the highest prevalence of hypertension and CVD, also have the lowest prevalence of MetS (5, 13). In the Atherosclerosis Risk in Communities Study, the Framingham risk equation underestimated the risk in AAs, and additional weighting for hypertension accounted for the increased CVD risk in AAs (14).
Arterial stiffness and microvascular dysfunction are markers of subclinical CVD and are associated with long-term cardiovascular morbidity and mortality (15–17). We have shown greater subclinical vascular dysfunction in AAs compared with whites, even after adjustment for all cardiovascular risk factors (18). Although the impact of MetS on vascular function has been reported, the strength of this association has been variable, and observations have been limited to largely white populations (19, 20). It is unclear whether MetS accurately identifies vascular dysfunction in both whites and AAs. We evaluated racial differences in the prevalence of MetS in a biracial cohort from the metropolitan southeastern United States. We hypothesized that the association between MetS and vascular function would differ by race and that diagnostic criteria for MetS would underestimate the impact of individual risk factors on subclinical vascular disease in AA subgroups.
Materials and Methods
Study sample
Self-identified AA and white residents of metropolitan Atlanta, aged 20–90 years (n = 951) were recruited from March 2005 to October 2009 to come to either the Emory or Morehouse Schools of Medicine for evaluation. Detailed demographic and anthropometric data were collected during this visit. A BP measurement was taken with a sphygmomanometer after 5 minutes of rest and based on the average of two of three readings measured 5 minutes apart. Height and weight were measured and BMI calculated as weight in kilograms divided by height in meters. Waist circumference (centimeters) was measured using a tape around the abdomen. For those subjects without waist circumference measurements, BMI of 30 kg/m2 or greater served as a cutoff for central obesity. History of hypertension, diabetes, and dyslipidemia were defined by subject self-report or current use of antihypertensive, antidiabetic, or dyslipidemic medications. These data were used in the calculation of MetS. Smoking history was defined as current using standardized questionnaires. Pregnant women and those with acute illnesses were excluded. Informed consent was obtained from all participants, and the study was approved by the Emory University and Morehouse School of Medicine Institutional Review Boards.
Blood/urine specimens
Participants were asked to fast and refrain from smoking 12 hours prior to the study visit. Venous blood was collected in sodium heparin tubes. Serum levels of total cholesterol, HDL-C, triglycerides, and glucose were measured by spectrophotometry.
Pulse volume analysis
Digital pulse amplitude tonometry was used to measure pulse volume amplitude (PVA) in the tip of the index finger, with participants resting in the supine position in a quiet, temperature-controlled environment set at 22°C after an overnight fast (Endo-PAT; Itamar Medical) as previously described (18). PVA was measured at rest and during reactive hyperemia, which was elicited by the release of an upper arm BP cuff inflated to suprasystolic pressure for 5 minutes. The reactive hyperemia index (RHI) was calculated as the ratio of the post- to preocclusion PVA of the tested arm, divided by the post- to preocclusion ratio of the control arm [the average PVA over a 1 min interval starting 1 min after cuff deflations divided by the average PVA measured for 1 min before cuff inflation (baseline)] (21). Data on RHI were available for 766 participants. Compared with the total population, there was a higher percentage of men (55% vs 45%, P = .01) but no difference in the percentage of AAs in the 184 participants who were missing RHI measurements.
Arterial waveform analysis
Arterial stiffness and wave reflections were measured in the supine position (Sphygmocor; Atcor Medical) as previously described (18, 22). Briefly, high-fidelity sequential pressure waveforms were recorded using a handheld tonometer over the radial artery pressure and application of a generalized transfer function allowed calculation of the central (aortic) pressure, the degree of pressure augmentation resulting from reflected waves from the periphery, and computation of the central augmentation index (CAIx; augmented pressure/total central pulse pressure). Because CAIx varies with heart rate, a CAIx standardized to a heart rate of 75 bpm was calculated in 903 participants.
Arterial stiffness, estimated as carotid and femoral pulse wave velocity (PWV), was measured using pressure waveforms at carotid and femoral arterial sites using tonometry and electrocardiogram gating as previously described (22). Velocity (meters per second) was calculated by measuring the time interval between the R-waves at each site divided by the distance. PWV was available in 653 participants, and there was a higher percentage of AAs (58% vs 47%, P < .05) in the 298 participants missing PWV measurements. Reproducibility studies in our laboratory on consecutive days demonstrated a coefficient of variation of 20.8% and 3.8% for CAIx and PWV, respectively.
Statistical methods
Continuous variables are presented as mean ± SD when normally distributed, median (interquartile range) when skewed, or as proportions for categorical variables. RHI, PWV, and CAIx were assessed for normality using the Kolmogorov-Smirnov criterion. Groups were compared using the χ2 test for categorical variables and independent t tests or Wilcoxon rank sum tests for continuous variables. Multivariable linear regression models were created to examine the association of race, MetS, and indices of vascular function after adjusting for traditional CVD risk factors, age, and sex (and height for CAIx). Individual components of MetS included waist circumference or BMI, glucose, triglycerides, HDL-C, and/or hypertension. For all subgroup analyses, Tukey's adjustment for multiple comparisons was used. All tests of statistical significance were two tailed, and P < .05 was considered significant. Statistical analyses were performed using SPSS Inc (version 19.0).
Results
Subject characteristics
The mean age of the subjects was 48.8 years, 54.9% were female, and 46.9% were AA (Table 1). Compared with white subjects, AAs were younger and were more likely to have hypertension and diabetes and be current smokers. In addition, they had greater waist circumference, BMI, systolic and diastolic BP, and lower triglyceride levels.
Subject Characteristics by Racial Group
| Total Population (n = 951) | Whites (n = 505) | AAs (n = 446) | P value | |
|---|---|---|---|---|
| Age, y | 48.8 ± 10.8 | 49.6 ± 11.3 | 47.9 ± 10.1 | .016 |
| Female, % | 522 (54.9) | 272 (53.9) | 250 (56.1) | .514 |
| History of hypertension, % | 284 (29.9) | 113 (22.4) | 171 (38.3) | <.001 |
| History of diabetes, % | 84 (8.9) | 26 (5.1) | 58 (12.7) | <.001 |
| Current smoking, % | 196 (22.0) | 70 (14.9) | 126 (29.9) | <.001 |
| Waist circumference, cm | 96.7 [86.9, 108.0] | 94.1 [84.5, 105.8] | 98.6 [88.4, 111.1] | .006 |
| BMI, kg/m2 | 27.0 [23.4, 32.1] | 25.4 [22.7, 29.0] | 29.2 [24.9, 35.0] | <.001 |
| Systolic blood pressure, mm Hg | 118.0 [108, 129] | 115 [107.0, 137.0] | 121 [111.0, 132.0] | <.001 |
| Diastolic blood pressure, mm Hg | 76.0 [69.0, 83.0] | 74.0 [67.0, 80.0] | 78.0 [70.5, 86.0] | <.001 |
| Triglycerides, mg/dL | 91.0 [65.0, 126.0] | 95.0 [66.5, 133.0] | 87.0 [63.3, 115.0] | .032 |
| LDL-C, mg/dL | 111.0 [91.0, 134.0] | 111.0 [91.5, 130.0] | 111.5 [90.0, 138] | .979 |
| HDL-C, mg/dL | 58.0 [47.0,70.0] | 57.0 [46.8,71.0] | 58.0 [48.0,69.0] | .892 |
| Glucose, mg/dL | 87.0 [82.0, 94.0] | 88.0 [82.0, 94.0] | 87.0 [81.0, 95.0] | .307 |
| Risk scores | ||||
| Framingham risk score | 4.0 [2.0, 7.0] | 4.0 [2.0, 7.0] | 4.0 [2.0, 7.0] | .354 |
| MetS, % (n = 951) | 228 (24.0) | 108 (21.4) | 120 (26.9) | .048 |
| Vascular function testing | ||||
| PVA | 218.1 [102, 506] | 256.5 [116, 555] | 184.7 [91, 427] | <.001 |
| RHI, AU | 2.20 [1.8–2.6] | 2.30 [1.9–2.7] | 2.06 [1.7–2.5] | <.001 |
| CAIx, % | 21.0 [11.0–29.0] | 20 [9.0–27.0] | 23.0 [13.0–31.0] | <.001 |
| PWV, m/sec | 7 [6.1–8.1] | 6.8 [6.0–7.8] | 7.3 [6.3–8.4] | <.001 |
Abbreviation: LDL-C, low-density lipoprotein cholesterol. Values shown are mean ± SDs or number (percentage) for normally distributed variables or median [interquartile range] for nonnormally distributed variables. Bold values indicate statistically significant difference (P < .05).
Prevalence of MetS and MetS components
The prevalence of MetS was 24.0%, with a higher prevalence in AAs compared with whites (26.9% vs 21.4%, P = .048). The prevalence of MetS was 22.3% in white men and 25.0% in AA men (P = .6) and 20.6% in white women compared with 28.4% in AA women (P = .041). The prevalence of individual components of MetS is shown in Table 2. Abnormal waist circumference and hypertension were the two most frequent components present and had a greater prevalence in AA subjects (P < .001 for both). Compared with whites, AAs were more likely to have elevated blood glucose (P = .001) and less likely to have elevated triglyceride levels (P = .007).
Prevalence of Individual MetS Risk Factors by Race
| Risk Factor | Total Population, % | White, % | AA, % | P value |
|---|---|---|---|---|
| Elevated fasting blood glucose or treatment, ≥ 100 mg/dL | 160 (16.8) | 66 (13.1) | 94 (21.2) | .001 |
| Reduced HDL-C or treatment (women < 50 mg/dL, men < 40 mg/dL) | 220 (23.1) | 119 (23.8) | 101 (23.1) | .817 |
| Elevated triglycerides or treatment, ≥ 150 mg/dL | 192 (20.1) | 119 (23.8) | 73 (16.7) | .007 |
| Elevated BP or treatment, BP ≥ 130/85 mm Hg | 355 (37.3) | 148 (29.4) | 207 (46.5) | <.001 |
| Elevated waist circumference (women ≥ 80 cm, men ≥ 94 cm) or BMI (≥30 kg/m2) | 568 (59.9) | 268 (53.2) | 300 (67.4) | <.001 |
BMI was reported in patients with missing waist circumference values. Bold values indicate statistically significant difference (P < .05).
Determinants of RHI
AAs had lower baseline PVA and RHI compared with whites (P < .001, Table 1) and were more likely to have a RHI less than 1.67 (20.1% vs 13.5%, P = .03), a value that has been associated with coronary endothelial dysfunction (15). Univariate determinants of RHI were age, race, waist circumference, HDL-C, and diastolic BP (Table 3). Compared with subjects without MetS, those with MetS tended to have a lower RHI (2.18 ± 0.5 vs 2.27 ± 0.6, P = .068, Figure 1). Whereas there was no significant difference in the RHI between AAs and whites diagnosed with MetS (2.09 ± 0.5 vs 2.27 ± 0.6, P = .2), in those without MetS, RHI remained significantly lower in AAs compared with whites (2.15 ± 0.6 vs 2.37 ± 0.6, P < .001, Figure 2). In a multivariate analysis that included all univariate predictors of RHI, only race (β = −.15, P = .001) remained an independent predictor of RHI. A multivariate analysis that included MetS diagnoses in addition to the aforementioned variables demonstrated that MetS diagnosis was not an independent predictor of RHI.
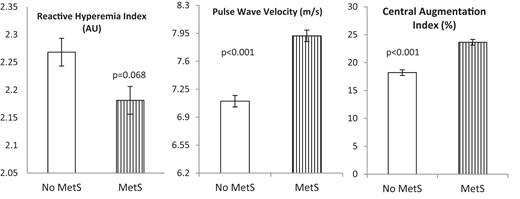
Differences in RHI, PWV, and CAIx by MetS diagnosis.
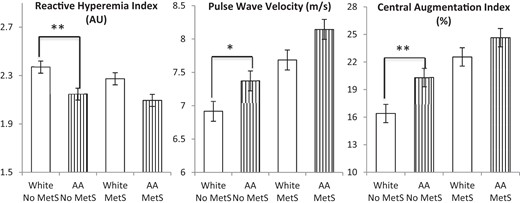
RHI, PWV, and CAIx by MetS diagnosis stratified by race.
AAs without MetS had lower RHI and higher PWV and CAIx values than whites without Mets. Racial differences in RHI, PWV, and CAIx were not significant in subjects with MetS. *, P < .05; **. P < .001.
Spearman Correlations Between Vascular Function and Demographic and Metabolic Variables
| RHI | PWV | CAIx | ||||
|---|---|---|---|---|---|---|
| r | P value | r | P value | r | P value | |
| Age | 0.11 | .002 | 0.30 | <.001 | 0.50 | <.001 |
| Sex | 0.06 | .10 | −0.17 | <.001 | 0.36 | <.001 |
| Race | −0.19 | <.001 | 0.15 | <.001 | 0.12 | <.001 |
| Smoking | −0.057 | .121 | 0.075 | .067 | 0.143 | <.001 |
| Waist circumference | −0.12 | .004 | 0.11 | .021 | −0.08 | .025 |
| Fasting glucose | 0.01 | 1.00 | 0.15 | <.001 | 0.07 | .033 |
| Triglycerides | −0.01 | .73 | 0.10 | .013 | 0.13 | <.001 |
| HDL-C | 0.08 | .036 | −0.04 | .371 | 0.12 | <.001 |
| SBP | −0.016 | .656 | 0.372 | <.001 | 0.332 | <.001 |
| DBP | −0.092 | .011 | 0.346 | <.001 | 0.306 | <.001 |
| MetS | −0.052 | .154 | 0.211 | <.001 | 0.166 | <.001 |
Abbreviations: DBP, diastolic BP; r, Spearman coefficient; SBP, systolic BP. Bold values indicate statistically significant difference (P < .05).
Determinants of PWV
PWV was higher in AAs compared with whites (P < .001, Table 1). Univariate determinants of PWV were age, sex, race, waist circumference, fasting blood glucose, triglycerides, systolic and diastolic BP, and MetS diagnosis (Table 3). As expected, subjects with MetS had significantly higher PWV than those without MetS (7.92 ± 1.8 vs 7.10 ± 1.6 m/sec, P < .001, Figure 1). Whereas both AA and white subjects with MetS had similar PWV (8.14 ± 2.0 vs 7.69 ± 1.6 m/sec, P = .4), in those without MetS, PWV remained significantly higher in AAs compared with whites (7.37 ± 1.8 vs 6.92 ± 1.5 m/sec, P = .007, Figure 2). Using the median PWV of 7 m/sec as the cutoff, more AAs had PWV greater than the median compared with whites (56.0% vs 40.5%, P < .001). In a multivariate analysis that included all univariate predictors of PWV, age (β = .15, P = .001), fasting blood glucose (β = .11, P = .020), and systolic BP (β = .30, P < .001) remained independent predictors of PWV. Multivariate analyses that included MetS diagnoses in addition to the aforementioned variables demonstrated that MetS diagnosis was not an independent predictor of PWV.
Determinants of CAIx
CAIx was higher in AAs compared with whites, even after adjustment for age and gender (P < .001, Table 1). Univariate determinants of CAIx were age, race, sex, smoking, waist circumference, fasting blood glucose, triglycerides, HDL-C, and systolic and diastolic BP (Table 3). As expected, subjects with MetS had significantly higher CAIx than those without MetS (23.6 ± 11.0 vs 18.2 ± 13.4, P < .001, Figure 1). Whereas there was no significant difference in CAIx between AAs and whites diagnosed with MetS (24.7 ± 11.5 vs 22.6 ± 10.3, P = .6), in those without MetS, CAIx remained significantly higher in AAs compared with whites (20.3 ± 12.5 vs 16.4 ± 14.8, P < .001). Using the median CAIx value of 21% as the cutoff, more AAs had CAIx greater than the median compared with whites (54.1% vs 46.2%, P = .018). In a multivariate analysis that included all univariate predictors of CAIx, age (β = .40, P < .001), race (β = .09, P = .007), sex (β = .30, P < .001), smoking (β = .11, P = .001), waist circumference (β = −.12, P = .001), systolic BP (β = .11, P = .029), and diastolic BP (β = .21, P < .001) remained independent predictors of CAIx. Multivariate analyses that included MetS diagnoses in addition to the aforementioned variables demonstrated that MetS diagnosis was not an independent predictor of CAIx.
Subgroup analysis in participants without MetS
We further investigated the reasons for the racial differences in vascular function in subjects without MetS. In participants without MetS, AAs were younger, more likely to be current smokers, hypertensive, and have higher waist circumference, BMI, and lower triglyceride levels (Table 4). Compared with whites, AAs were more likely to have one or two risk factors for MetS (59.2% vs 71.8%, P < .001) and less likely to have no risk factors (40.8% vs 28.2%, P < .001). Multivariate analysis including all the aforementioned covariates in the population without MetS demonstrated that only age (β = .13, P = .032) and race (β = −.20, P = .001) remained independent predictors of RHI. Age (β = .14, P = .022), sex (β = −.16, P = .014), and history of hypertension (β = .17, P = .006) were independent predictors of PWV. Finally, age (β = .46, P < .001), sex (β = .19, P = .001), race (β = .13, P = .003), smoking (β = .11, P = .005), height (β = −.23, P < .001), and history of hypertension (β = .20, P < .001) were independent predictors of CAIx.
Prevalence of Cardiovascular Disease Risk Factors by Race
| Number of Risk Factors | Whites | AAs | P Value |
|---|---|---|---|
| Age, y | 48.3 ± 11.8 | 46.2 ± 10.4 | .012 |
| Female, % | 54.4 | 54.9 | .940 |
| History of hypertension, % | 12.8 | 27.9 | <.001 |
| History of diabetes, % | 1.8 | 3.1 | .270 |
| Current smoking, % | 11.6 | 24.8 | <.001 |
| Waist circumference, cm | 88.4 [81.2, 98.9] | 95.7 [85.7, 107.2] | <.001 |
| BMI, kg/m2 | 24.2 [22.0, 27.5] | 27.7 [24.1, 33.4] | <.001 |
| Systolic BP, mm Hg | 114.0 [106.0, 122.8] | 117.0 [108.0, 128.0] | <.001 |
| Diastolic BP, mm Hg | 72.5 [66.0, 80.0] | 77.0 [70.0, 84.0] | <.001 |
| Triglycerides, mg/dL | 83.0 [61.0, 116.5] | 78.0 [61.0, 101.0] | .012 |
| HDL-C, mg/dL | 61.0 [51.8, 74.0] | 59.0 [52.0, 71.0] | .416 |
| Glucose, mg/dL | 86.0 [81.0, 92.0] | 85.0 [81.0, 90.0] | .100 |
Bold values indicate statistically significant difference (P < .05).
Reclassification of MetS in AAs
We examined whether weighting for the presence of hypertension in AAs as an added risk factor for MetS would improve the association between MetS and vascular dysfunction in AA subjects. When hypertension in AA subjects was given a score of two (instead of one) MetS components, 70 additional AA subjects without MetS were reclassified as having MetS. Using this reclassified MetS criteria, AA and white subjects with MetS (8.13 ± 2.1 vs 7.69 ± 1.6 m/sec, P = .3) and without MetS (7.15 ± 1.5 vs 6.92 ± 1.5 m/sec, P = .5) had similar PWV (Figure 3). Similarly, using the reclassified MetS criteria, AA and white subjects with MetS (26.2 ± 11.0 vs 22.6 ± 10.3, P = .1) and without MetS (18.0 ± 12.4 vs. 16.4 ± 14.1, P = .4) has similar CAIx (Figure 3). However, the difference in RHI between AAs and whites without MetS persisted despite reclassification (Figure 3).
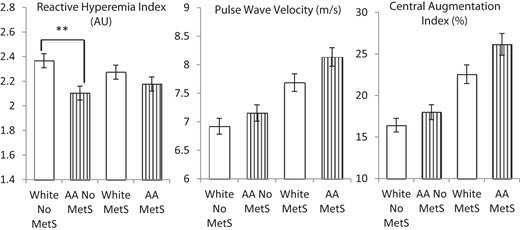
RHI, PWV, and CAIx by MetS diagnosis stratified by race after adjustment for hypertension in AAs as an additional MetS risk factor.
Significant racial differences in RHI persisted between AAs and whites. AAs had significantly lower RHI than whites without MetS (P < .001). AAs and whites with MetS had significantly higher PWV and CAIx values than AAs and whites without MetS. There was no significant racial difference in RHI, PWV, or CAIx in those with MetS. However, adjustment for hypertension in AAs eliminated racial differences in PWV and CAIx in those without MetS. **, P < .001.
Discussion
In this biracial, community-based sample, we found that the presence of MetS is associated with increased prevalence of subclinical vascular disease measured as arterial stiffness and abnormal wave reflections and with a trend toward abnormal microvascular function. In both races, the presence of MetS was associated with similar degrees of abnormalities in vascular function. However, in the absence of MetS, AAs continued to demonstrate greater vascular dysfunction than whites. This is likely due to the greater prevalence of one or two MetS risk factors in AAs, a greater duration of lifetime exposure to MetS risk factors, or to the presence of other nonmetabolic risk factors such as inflammation, oxidative stress, and psychosocial stress. After adjustment by weighting, the presence of hypertension in AA resulted in the elimination of the racial differences in PWV and CAIx.
The link between MetS and the development of diabetes and CVD can be attributed to the clustering of risk factors (hypercholesterolemia, hypertension, hyperglycemia, and insulin resistance), resulting in a proinflammatory and prothrombotic state (1, 2, 23). Compared with whites, AAs have a higher prevalence of diabetes and hypertension and a lower prevalence of dyslipidemia (10, 24, 25). Additionally, we and others have found that AAs have increased microvascular dysfunction and arterial stiffness compared with whites, even after adjustment for differences in traditional CVD risk factors and antihypertensive medications (18, 26). It is known that compared with whites, AAs develop hypertension earlier in life, often in the second decade of life (27). Thus, prolonged exposure to hypertension, and a greater incidence of uncontrolled hypertension, are likely to drive the risk of subclinical vascular disease in AAs. When we reclassified the presence of hypertension in AAs with two MetS components, it led to the elimination of racial differences in arterial stiffness indices. However, this increased weighting for hypertension in AAs did not eliminate the worse microvascular endothelial function observed between the races in subjects without MetS, suggesting that factors other than hypertension contribute to the increased microvascular dysfunction seen in AAs.
Mechanisms underlying the observed ethnic differences in vascular function may involve both nitric oxide (NO)-dependent and -independent pathways (28, 29). Exposure to MetS risk factors reduces both resting and stimulated bioavailability of NO from the endothelium in the peripheral and coronary circulations (30–34). Decreased NO bioavailability can lead to vascular remodeling in experimental models, affecting both large elastic arteries and smaller resistance vessels (35, 36). We and others have shown that NO contributes to the duration of reactive hyperemia and that AAs have decreased resting and stimulated NO bioactivity in their forearm microcirculation in addition to an impaired smooth-muscle vasodilator response to NO donors (32, 37–39). This increased susceptibility to arterial stiffness and microvascular dysfunction can explain the increased end-organ damage, CVD, and stroke observed in hypertensive AAs (40).
Arterial stiffness leads to an increase in systolic BP because hearts ejecting blood into a stiffer arterial bed must generate higher end-systolic pressure for the same net stroke volume. This leads to an increased decay of arterial pressure and volume during systole, causing a reduced arterial volume at the onset of diastole, which in turn causes an enhanced fall in diastolic BP (41). Clinically, the consequences of increased arterial stiffness are an increased risk of stroke, the development of left ventricular hypertrophy, decreased coronary perfusion, and heart failure. Increased arterial stiffness as measured by PWV and CAIx are associated with increased risk of CVD events (16, 17, 42). The association of MetS and its components with arterial stiffness have been previously noted but has primarily been studied in middle-aged white subjects (43, 44). Previous studies examining racial differences in arterial stiffness have been limited by small sample size, use of alternative techniques such as carotid artery β-stiffness index, and the inclusion of younger, healthy populations (26, 45). In contrast, our population was larger, included older subjects with cardiovascular risk factors, and used carotid-femoral PWV and CAIx measurements to evaluate arterial stiffness.
Strengths of our study include generalizability of our findings because of the large sample size of a community-based population with good representation of young, female, and AA subjects. In addition, we measured the function of both the microvasculature and large arteries. To our knowledge, this is the first study to evaluate the relationship between MetS and microvascular function. Limitations include its cross-sectional design that precludes the establishment of causality between the observations described. Although we accounted for antihypertensive and statin medication use (<12% of our study population reported use of these medications), it is uncertain whether treatment duration, intensity, and control influenced the vascular parameters. In addition, compared with RHI and CAIx, fewer subjects had PWV measurements available.
In conclusion, we found that AAs have lower digital reactive hyperemia and increased arterial wave reflections/stiffness compared with whites in a metropolitan population residing in the southeastern United States. Although the diagnosis of MetS was associated with greater vascular dysfunction in both races, in subjects without MetS, AAs had worse vascular function compared with whites. Thus, the consensus definition of MetS fails to capture the increased risk of underlying subclinical vascular disease in AAs. Adjustment for the presence of hypertension in AAs by increased weighting eliminated the racial differences in arterial stiffness and improved the utility of MetS diagnosis in identifying subjects with increased subclinical vascular disease. Whether similar weighting will lead to better identification of AAs at risk of clinical CVD and its adverse events remains to be studied.
Acknowledgments
We thank the participants of the Morehouse and Emory Team Up to Eliminate Health Disparities (META-Health) Study and the Emory Predictive Health Initiative. We also thank the Emory and Morehouse Clinical Research Center staff for their assistance and participation.
This work was supported by funding from National Institutes of Health/National Heart, Lung, and Blood Institute Grant 1 U01 HL079156–01 (to A.A.Q.) and Grant 1 U01 HL79214–01 (to G.H.G.); in part by National Institutes of Health Grant UL1 RR025008 from the Clinical and Translational Science Award program for the Emory Clinical Interaction Unit; National Institutes of Health/National Center for Research Resources Grant 5P20RR11104 (to the Morehouse Clinical Research Center); and the Woodruff Fund (to the Emory Predictive Health Initiative).
Disclosure Summary: The authors have nothing to disclose.
J.S. and J.C.P. contributed equally to this work.
Abbreviations
- AA
African American
- BMI
body mass index
- BP
blood pressure
- CAIx
central augmentation index corrected for heart rate
- CVD
cardiovascular disease
- HDL-C
high-density lipoprotein cholesterol
- MetS
metabolic syndrome
- NO
nitric oxide
- PVA
pulse volume amplitude
- PWV
pulse wave velocity
- RHI
reactive hyperemia index
