


Abstract
Tuberculosis (TB), caused by Mycobacterium tuberculosis (MTB), remains a major global health threat, compounded by the rise of extensively drug-resistant (XDR) and multidrug-resistant (MDR) strains. This review critically examines the current landscape of laboratory diagnostic methods for MTB, encompassing both established techniques and recent advancements. We explore the growth and genetic characteristics of MTB that underpin drug resistance development and detection. We then provide a comparative analysis of smear microscopy, culture-based methods, antigen detection, molecular diagnostics (including nucleic acid amplification tests and whole-genome sequencing), spectroscopic techniques (such as Raman spectroscopy), and mass spectrometry-based approaches. Notably, this review focuses on pathogen-based diagnostic methods, excluding host immune response assays. The strengths and limitations of each method are evaluated in terms of sensitivity, specificity, turnaround time, cost-effectiveness, and suitability for resource-limited settings. Finally, we discuss the future of TB diagnostics, emphasizing the need for integrated, multi-modal platforms, the incorporation of artificial intelligence (AI) for enhanced data analysis, and the development of affordable, point-of-care testing to improve accessibility and impact in high-burden regions. Overcoming current diagnostic challenges is essential for improving patient outcomes and achieving global TB elimination goals.
Rapid and accurate tuberculosis (TB) diagnosis is essential, yet current methods remain limited by speed, sensitivity, and accessibility. This review systematically evaluates pathogen-based diagnostic techniques, including microscopy, culture, molecular assays, Raman spectroscopy, and mass spectrometry. By addressing key challenges and leveraging emerging technologies, it highlights strategies to improve MTB detection and drug resistance testing, ultimately supporting global TB control efforts.
Introduction
Tuberculosis (TB), caused by Mycobacterium tuberculosis (MTB), remains a major global health concern. Currently, it is the leading cause of death from a single infectious pathogen worldwide. According to the 2024 World Health Organization (WHO) Global Tuberculosis Report, an estimated 10.8 million incident TB cases (95% UI: 10.1–11.7 million) were reported in 2023, resulting in 1.25 million TB-attributable deaths (95% UI: 1.13–1.37 million) (WHO 2024a). This alarming mortality rate surpasses that of COVID-19 and nearly doubles the mortality associated with HIV/AIDS, underscoring the urgent need for effective TB control measures (WHO 2024a). A critical component of these control efforts is the rapid and accurate diagnosis, both of TB itself and of drug-resistant strains. Given this need, this review focuses exclusively on pathogen-based diagnostic methods that directly detect MTB or its drug resistance. Immune-based assays, such as interferon-gamma release assays and the tuberculin skin test, which detect host immune responses rather than the pathogen itself, are not covered in this review.
However, several biological characteristics of MTB hinder laboratory detection efforts. Its complex cell wall, rich in lipids like mycolic acids, confers acid-fastness and contributes to its survival in the environment (Cook et al. 2009). In addition, MTB grows slowly, with a doubling time of more than 16 h, and exhibits considerable genetic variability, driven by mechanisms such as single nucleotide polymorphisms, insertion sequences, and deletions. These characteristics increase the difficulty of culturing MTB in vitro and lead to the emergence of drug-resistant strains.
TB is an airborne disease, transmitted primarily through the inhalation of infectious droplet nuclei expelled by individuals with active pulmonary TB (Rahlwes et al. 2023). Effective treatment requires prolonged, multi-drug chemotherapy, and strict patient adherence is crucial for success. However, delayed or inaccurate diagnosis, combined with suboptimal treatment practices, has fueled the emergence of drug-resistant TB, posing a major threat to global TB control. The rise of extensively drug-resistant (XDR) and multidrug-resistant (MDR) strains further complicates the situation (Rahlwes et al. 2023). MDR-TB is defined by resistance to both isoniazid (INH) and rifampicin (RIF), the cornerstone first-line anti-TB drugs. XDR-TB is resistant to RIF, any fluoroquinolone (FQ), and at least one additional Group A drug [linezolid (LZD) or bedaquiline] (WHO 2021). Early and accurate diagnosis, including rapid drug susceptibility testing (DST), is therefore essential for initiating appropriate treatment, preventing further development of resistance, improving patient outcomes, and limiting the spread of both drug-susceptible and drug-resistant TB.
Traditional diagnostic methods for MTB, such as smear microscopy and bacterial culture, remain widely used. Culture is considered the gold standard for TB diagnosis and DST. However, these methods are often limited by low sensitivity (particularly smear microscopy) and long turnaround times (Dufault et al. 2024). To overcome these limitations, a range of alternative diagnostic approaches have been developed, including antigen-based assays, molecular diagnostic kits and rapid phenotypic methods. Molecular methods in particular provide rapid and highly sensitive detection, even with low bacterial loads. Clustered regularly interspaced short palindromic repeats (CRISPR)-based assays, e.g. leverage sequence-specific cleavage to detect MTB DNA with high precision. However, their widespread use is often restricted by high costs and an inability to detect all resistance-conferring mutations (MacLean et al. 2020). Advancements in Raman spectroscopy and mass spectrometry also hold promise for improving diagnostic capabilities (Joshi et al. 2022, Bacanelli et al. 2023, Ogunlade et al. 2024). Additionally, emerging technologies such as artificial intelligence (AI)-driven image analysis are being explored for their potential to enhance MTB detection and drug resistance profiling. These innovations are still in early-stage research and require further validation before clinical adoption.
Despite these advancements, significant challenges persist. High costs, limitations in detecting all forms of resistance, and the difficulty of achieving rapid and accurate results in diverse clinical settings, particularly in resource-limited areas, remain major obstacles. Continued innovations are essential to develop diagnostic tools that combine high accuracy, low sample requirements, and rapid turnaround, while remaining practical for routine clinical use.
This review provides a comprehensive and critical analysis of current diagnostic methods for MTB and drug resistance detection. The advantages, limitations, and clinical applications of each method are discussed (summarized in Table 1). The review highlights how these methods aim to streamline diagnostic workflows, improve treatment decision-making, and support global TB control efforts. Furthermore, it emphasizes the potential of emerging techniques, such as molecular diagnostics and Raman spectroscopy, to significantly enhance diagnostic capabilities, while also underscoring the critical need for more accessible, cost-effective, and user-friendly tools to address existing challenges and improve TB control globally. This review exclusively focuses on pathogen-based approaches.
Diagnostic methods for MTB identification and DST.
| Diagnostic method | Culture-free | Sample pretreatment complexity | Sensitivity/specificity | Detection limit (CFU ml−1) | MTB/NTM & resistance profiling | Polymicrobial infection detection | Time to diagnosis | Advantages/limitations | References |
|---|---|---|---|---|---|---|---|---|---|
| Smear microscopy | Yes | Low | Sensitivity: 20%–80% Specificity: >90% | 10³–104 | MTB/NTM: No Resistance: No | No | 1–2 h | Rapid, inexpensive; low sensitivity | (Lipsky et al. 1984) |
| Culture-based methods | No | High | Sensitivity: >95% Specificity: >99% | Single CFU in culture | MTB/NTM: No Resistance: Yes (pDST) | Limited | 2–8 weeks | Gold standard, high accuracy; slow, requires biosafety facilities | (Tortoli et al. 1999) |
| Antigen detection methods | Yes | Low | Sensitivity: 60%–90% Specificity: 85%–95% | 100–1000 | MTB/NTM: No Resistance: No | Limited | 0.5–2 h | Rapid, non-invasive; limited sensitivity | (Flores et al. 2021) |
| Molecular diagnostic methods | Yes | Medium | Sensitivity: >90% Specificity: >95% | 10–1000 | MTB/NTM: Partially (via targets) Resistance: Yes | No | 1–12 h | High sensitivity, rapid; expensive, requires specialized equipment | (Mahato and Kumar 2024) |
| Raman spectroscopy | Yes | Medium | Sensitivity: >90% Specificity: >95% | Single-cell | MTB/NTM: Yes (Raman fingerprint) Resistance: Yes (D₂O labeling) | Yes | 0.5–2 h | No labels, live detection; expensive equipment | (Ogunlade et al. 2024) |
| Mass spectrometry (MALDI-TOF MS) | No | Medium–High | Sensitivity: 80%–98% Specificity: >98% | 104–10⁵ | MTB/NTM: Yes Resistance: No | Yes | 1–6 h (after culture) | Rapid strain identification; culture-dependent, costly instrumentation | (Pignone et al. 2006, Mather et al. 2014) |
Microscopy-based diagnostic methods
Microscopy of acid-fast stained sputum smears remains a cornerstone of TB diagnosis, particularly in low- and middle-income countries, owing to its simplicity, rapidity, and cost-effectiveness (Lipsky et al. 1984). Unlike most bacterial species that can be classified as Gram-positive or Gram-negative using Gram staining, MTB presents a unique challenge. The high lipid content of the MTB cell wall, primarily composed of mycolic acids, prevents the penetration of Gram stain dyes. Consequently, a lipid-soluble dye is required to effectively visualize MTB (Morello et al. 2018). The most widely used technique is Ziehl–Neelsen (ZN) staining, commonly performed with direct smear microscopy (see Fig. 1).
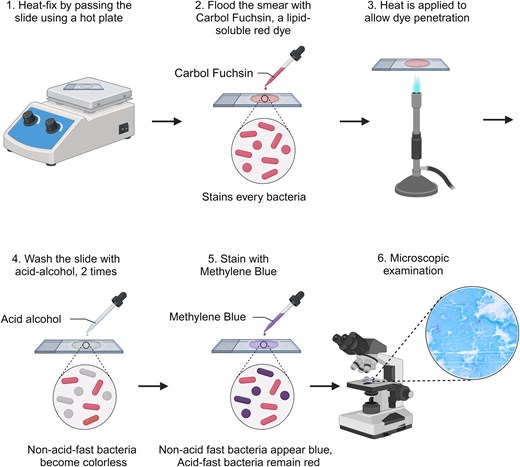
Schematic diagram of the acid-fast staining process and representative results of sputum smears. The procedure involves primary staining with carbol fuchsin, followed by decolorization with acid-alcohol and counterstaining with methylene blue. Acid-fast bacilli (AFB), including MTB, retain the primary stain, while non-acid-fast organisms and background material take up the counterstain. Created with BioRender.com.
Although ZN staining is a valuable tool, conventional smear microscopy has a major limitation—it requires a high bacterial load (approximately 104 MTB ml−1) for reliable detection (Naidoo et al. 2024). This limited sensitivity can lead to false-negative results, particularly in patients with paucibacillary disease, such as those with HIV co-infection or in early stages of TB. To address this limitation, significant efforts have focused on improving smear preparation and staining techniques. These advancements include centrifugation to concentrate bacteria within the sample, the addition of bleach to reduce background material, and, importantly, the adoption of fluorescence microscopy (Ryan et al. 2014). Light-emitting diode fluorescence microscopy (LED-FM), using fluorochromes such as auramine O and rhodamine, has been shown to increase sensitivity by 6% compared to ZN staining. The WHO has endorsed LED-FM as a replacement for conventional ZN microscopy, recognizing its potential to accelerate TB diagnosis (WHO 2011, Coulibaly et al. 2023). Furthermore, to mitigate the variability inherent in manual microscopy, which is highly dependent on the skill of the laboratory technician, automated staining and microscopy systems have been developed (Zingue et al. 2018). These systems offer the potential for higher throughput, standardized results and reduced reliance on individual expertise.
Despite these advancements, it is crucial to acknowledge the inherent limitations of smear microscopy. It cannot differentiate between viable and non-viable organisms, nor can it distinguish MTB from non-tuberculous mycobacteria (NTM). Furthermore, it provides no information on drug susceptibility. Therefore, while smear microscopy remains a rapid and widely accessible initial diagnostic tool, particularly in resource-constrained settings, it is insufficient as a standalone method for definitive TB diagnosis and management. It serves as a valuable first-line screening tool, but positive results typically require confirmation and further characterization through culture-based or molecular methods.
Culture-based diagnostic methods
Culture-based methods are considered the gold standard for MTB identification and DST. These methods rely on specialized culture media to isolate and grow MTB, which is essential for both diagnosis and assessing drug resistance. However, significant limitations exist, making it crucial to understand both their strengths and weaknesses.
MTB culture: the gold standard and its challenges
MTB is a slow-growing pathogen with a doubling time exceeding 16 h, leading to culture cycles that can extend for weeks. This slow growth, illustrated in Fig. 2a (colony morphology) and Fig. 2b (growth curves), presents a major challenge for timely diagnosis. Furthermore, MTB cultivation requires biosafety level 2 (or higher) laboratory conditions, making the process time-consuming, resource-intensive, and potentially hazardous (WHO 2018). These constraints not only delay clinical diagnosis and treatment but can also contribute to the development of drug resistance.
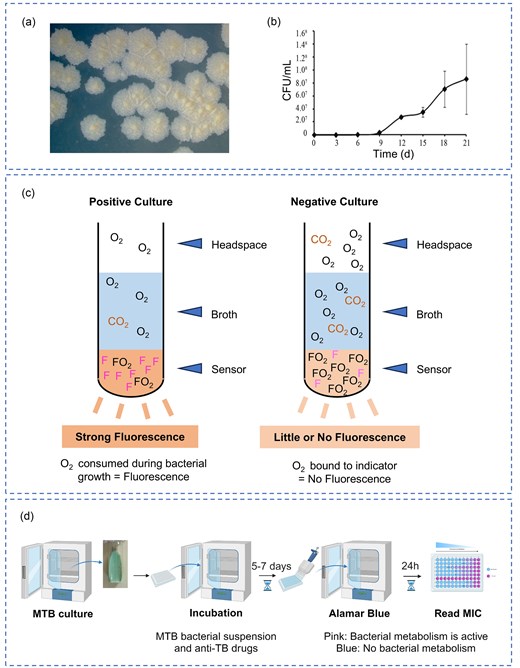
Culture-based methods for MTB detection and DST. (a) Colony morphology of MTB grown on Löwenstein–Jensen (L–J) medium. (b) Growth curves of MTB over 21 days using CFU ml−1 counting. Each point represents the average of three determinations ± standard deviation. Reprinted (adapted) with permission from Peñuelas-Urquides et al. (2013). Copyright (2013), Brazilian Journal of Microbiology. (c) Schematic representation of negative and positive results for the MGIT 960 system. (d) The detection workflow of MABA. Created with BioRender.com.
Several culture methods exist, each with trade-offs between speed, cost, and sensitivity. The traditional solid medium L–J Medium is cost-effective and less prone to contamination. However, it requires 4–6 weeks to yield results, hindering early diagnosis and treatment initiation. The automated BACTEC Mycobacteria Growth Indicator Tube (MGIT) 960 System (Fig. 2c) utilizes nutrient-rich liquid media, providing faster results and higher detection rates compared to L–J medium (Tortoli et al. 1999). The MGIT system is recognized by the WHO for its high sensitivity and specificity. Although it enables rapid detection of mycobacterial growth, it cannot distinguish between MTB and NTM, requiring additional confirmatory testing. Its high cost and requirement for specialized equipment further limit its widespread clinical use (Wang et al. 2016). It is important to note that clinical samples require decontamination using reagents like sodium hydroxide and N-acetyl-L-cysteine. While these reagents effectively eliminate rapidly growing bacteria and fungi, they have a limited effect on MTB growth, a crucial factor for successful culture (Hassan et al. 2020).
The limitations of culture-based methods, particularly the long turnaround time, highlight the need for a balance between diagnostic accuracy and practicality in clinical settings.
Phenotypic drug susceptibility testing
Phenotypic drug susceptibility testing (pDST) methods are culture-dependent, requiring the pre-isolation of MTB from positive cultures (Canetti et al. 1963). These methods determine the susceptibility of MTB isolates to anti-TB drugs.
L–J proportion method, which is considered the reference standard for DST of MTB, involves inoculating clinical samples onto L–J medium containing various anti-TB drugs (Amuda et al. 2020). Resistance is determined by the proportion of growth observed in the presence of the drugs. While capable of detecting resistance to multiple drugs, it requires several weeks for results. The absolute concentration method, in contrast, is a simpler and more cost-effective method assesses resistance by counting colonies that grow on drug-containing media. While widely used for first-line drug efficacy testing, it provides less detailed information than the proportion method and does not determine the minimum inhibitory concentration (MIC) (Huang et al. 2022). Among liquid culture-based DST methods, MGIT 960 System, a modified proportion technique, offers automated and high-throughput DST. It can assess resistance to up to 11 drugs, including second-line anti-TB medications (Harries and Kumar 2018). However, its reliance on specialized equipment and reagents increases costs, limiting its broader adoption. Microplate Alamar Blue Assay (MABA) is a colorimetric assay that uses the oxidation-reduction indicator Alamar Blue (resazurin) to assess MTB viability. Metabolically active MTB cells reduce the blue Alamar Blue to pink, with the color change correlating to bacterial viability (Palomino et al. 2002). The detection workflow is illustrated in Fig. 2d. MABA is cost-effective, scalable, and provides rapid results, making it valuable in low-resource settings. However, the addition of indicators during incubation may introduce contamination risks. Both the MGIT 960 system and MABA can determine the MIC, providing quantitative assessments of bacterial growth inhibition at varying drug concentrations.
While culture-based methods remain the gold standard for MTB diagnosis and DST, they present significant limitations. High contamination rates, prolonged processing times, and the need for specialized laboratories and skilled personnel hinder timely treatment initiation (Pooran et al. 2013). These challenges underscore the urgent need for more rapid, accessible, and cost-effective diagnostic alternatives.
Antigen detection methods
Rapid diagnosis of bacterial infections, without the need for culture, can be achieved by detecting bacteria-specific antigens in clinical samples. For MTB, this is commonly accomplished using enzyme-linked immunosorbent assays (ELISAs), which directly detect MTB antigens—primarily cell wall components or unique secreted proteins—in samples such as sputum, serum, and urine (Huang et al. 2022). Antigen detection offers a faster alternative to culture-based methods, but it’s crucial to understand its limitations, particularly regarding sensitivity, specificity, and the inability to provide drug susceptibility information.
A key target for MTB antigen detection is lipoarabinomannan (LAM), a major glycolipid component of the MTB cell wall. LAM is shed by metabolically active MTB and can be detected in urine, making it a valuable biomarker, especially in certain patient populations (Brennan 2003). LAM-based assays are particularly useful for diagnosing TB in immunocompromised individuals, such as those with HIV, especially patients with low CD4 (cluster of differentiation 4) cell counts. The ability to detect LAM in urine provides a non-invasive and relatively simple diagnostic approach. The WHO recommends the Alere Determine TB LAM antigen assay (Alere LAM), a lateral flow assay, for detecting LAM in urine samples from specific patient groups. However, its clinical application is limited by its relatively low sensitivity and specificity (Kerkhoff and Lawn 2016). This limitation necessitates careful interpretation of results and often requires confirmation with other diagnostic methods.
Current research focuses on overcoming the limitations of existing antigen detection methods, particularly the sensitivity and specificity of LAM assays. Several strategies are being pursued, including concentrating samples before analysis to increase the amount of target antigen, and improving the affinity and specificity of antibodies used in the assays, which is crucial for enhancing sensitivity and reducing false-positive/negative results (Murugan et al. 2020, Flores et al. 2021). Researchers are also exploring alternatives to ELISA, such as chemiluminescent immunoassays (CLIAs). For example, Li et al. (2024) developed the CLIA-LAM assay, which combines high-affinity antibodies, CLIA, and magnetic bead concentration to improve sensitivity and specificity. Furthermore, combining multiple antigens can significantly enhance diagnostic accuracy. Microarray technology is being used to identify MTB antigens that can differentiate active TB from latent TB infection, offering a promising avenue for improved antigen-based TB diagnostics (Zhuang et al. 2024). This approach can potentially overcome the limitations of relying on a single antigen.
While antigen detection methods offer a rapid approach to MTB identification, they have a significant limitation: they do not provide information on drug susceptibility. This means that culture-based methods or molecular tests are still required to determine appropriate treatment regimens. Future research should focus on developing point-of-care testing (POCT) antigen detection tests with improved sensitivity and specificity, potentially incorporating multiple antigen targets and novel detection technologies. The ultimate goal is to create rapid, accurate, and accessible diagnostic tools that can be used in diverse clinical settings, including resource-limited environments.
Molecular diagnostic methods
Compared to antigen-based techniques, molecular diagnostic techniques offer significant advantages, including short turnaround times and high sensitivity, and, crucially, the ability to identify resistance mutations at the genetic level. These methods have emerged as critical tools for the rapid and accurate detection of MTB and its drug resistance, revolutionizing TB diagnostics and patient management. Table 2 provides a comprehensive summary of the detection capabilities, turnaround times, and molecular targets of various polymerase chain reaction (PCR)-based diagnostic products, highlighting their clinical applicability and diagnostic performance.
Molecular diagnostic methods for MTB detection and DST.
| Method | Detection capability | Turnaround time | Molecular target | Validation stage | References |
|---|---|---|---|---|---|
| qPCR (e.g. Xpert MTB/RIF) | MTB detection, RIF resistance | <2 h | rpoB | WHO-endorsed, routine clinical use | (Cao et al. 2021, WHO 2024b) |
| Melting curve analysis | Drug resistance mutation detection | 2–4 h | rpoB, katG, ahpC,inhA | Limited clinical use | (Xie et al. 2024) |
| RDBH | MTB detection, drug resistance profiling | 4–7 h | rpoB, katG, embB, inhA, gyrA | Limited clinical use | (Wan et al. 2020) |
| ddPCR | Quantification of MTB, low-abundance mutation detection | 3–6 h | rpoB, katG, inhA, gyrA | Experimental | (Fan et al. 2022) |
| LAMP (e.g. TB-LAMP) | MTB detection | <1 h | gyrB, IS6110 | WHO-endorsed, limited clinical use | (Yadav et al. 2022) |
| RPA | MTB detection, drug resistance screening | <20 min | IS6110, rpoB | Experimental | (Jirakittiwut et al. 2025) |
| DNA microarrays | MTB detection, resistance mutation screening | 6–12 h | rpoB, katG, embB, inhA, gyrA, pncA, eis | Experimental | (Feng et al. 2021) |
| Gene sequencing (NGS, WGS) | Comprehensive resistance profiling | 24–72 h | Whole MTB genome | WHO-endorsed (tNGS only) | (Chen et al. 2024) |
| CRISPR | MTB detection, resistance mutation screening | <2 h | rpoB, katG, inhA, gyrA | Experimental | (Tram et al. 2023, Wang et al. 2024) |
qPCR, quantitative real-time PCR; RDBH, reverse dot blot hybridization; ddPCR, droplet digital PCR; LAMP, loop-mediated isothermal amplification; and RPA, recombinase polymerase amplification.
PCR-based methods
PCR is a fundamental molecular technique widely used for the rapid detection of MTB-specific DNA sequences. PCR serves as the foundation for a range of advanced diagnostic approaches, including melting curve analysis for mutation detection, RDBH for multiplex analysis, and digital PCR (dPCR) for quantifying low-abundance targets (Luo et al. 2011, Wan et al. 2020, Xu et al. 2024). qPCR, a highly sensitive and specific method, amplifies target DNA sequences in real-time while simultaneously quantifying DNA levels per cycle. Compared to traditional culture-based methods, qPCR offers significant advantages in sensitivity, specificity, and turnaround time. For instance, Peng et al. (2016) developed a multi-fluorescence real-time PCR (MF-qRT-PCR) assay to detect mutations conferring resistance to RIF and INH, while also distinguishing MTB from other Mycobacterium species like NTM. However, a notable limitation of qPCR is its inability to reliably detect mixed infections, potentially leading to false negatives. Automated qPCR-based diagnostic systems, such as the Xpert MTB/RIF assay (Cepheid), have revolutionized the detection of MTB and RIF resistance by targeting mutations in the rpoB gene (Boehme et al. 2010). The updated version, Xpert MTB/RIF Ultra, enhances sensitivity by incorporating multicopy targets (IS6110 and IS1081), enabling more effective detection of paucibacillary TB and HIV-associated TB (Dorman et al. 2018). The WHO strongly recommends this fully automated system for initial TB diagnosis and RIF resistance screening, and it has been widely adopted in clinical practice worldwide. However, a limitation is its potential to misclassify synonymous mutations as resistance-conferring, which could reduce its diagnostic specificity.
Beyond qPCR, fluorescent PCR probe melt curve analysis has been developed for genotypic MTB drug resistance detection. Xie et al. (2024) applied this method using molecular beacons and melt curve analysis to detect mutations in key resistance-related genes (rpoB, katG, ahpC, and inhA) in sputum specimens. This assay enables rapid and cost-effective detection of RIF and INH resistance, demonstrating high sensitivity and specificity compared to phenotypic DST. However, reliance on melt curve analysis can lead to false-positive identifications of synonymous mutations, as these mutations alter the DNA sequence without affecting protein function, potentially shifting the melting temperature and leading to misclassification. The RDBH assay enables detection of nucleic acids in a sample by hybridizing them to probes fixed on a solid surface, thereby identifying genetic mutations associated with pathogen identification or drug resistance. Wan et al. (2020) demonstrated the application of this assay in simultaneously detecting resistance to RIF, INH, streptomycin (SM), and ethambutol (EMB). The assay achieves high throughput, processing 42 samples within 7 h, with over 90% concordance with DST and sequencing results. However, its performance is sensitive to specific genetic mutations, necessitating further refinement of experimental conditions and probe design. Line Probe Assay, another PCR- and hybridization-based method, is designed for detecting mixed infections caused by multiple MTB strains. While superior in identifying antibiotic resistance in such cases, its implementation is constrained by the need for advanced laboratory infrastructure (Hussain et al. 2024, Komakech et al. 2024). ddPCR, unlike real-time PCR, enables absolute quantification of MTB DNA by partitioning samples into nanoliter-sized droplets. This is particularly effective in detecting low-abundance mutations, making it valuable for early drug resistance surveillance (Li et al. 2020, Zhang et al. 2023, Xu et al. 2024). However, its dependence on high-quality DNA templates underscores the need for optimized workflows. These techniques have shown promising results but are currently limited to research or restricted clinical applications, and have not yet been endorsed for routine clinical use.
Isothermal amplification methods
Isothermal amplification methods have emerged as rapid, cost-effective alternatives to PCR for MTB detection, circumventing the need for thermal cycling. Widely used techniques include LAMP, RPA, and other emerging methods. LAMP enables specific and efficient DNA amplification under isothermal conditions and has been endorsed by WHO as a potential alternative to smear microscopy for TB diagnosis (Notomi et al. 2000). LAMP, utilizing a greater number of primers than PCR, enhances specificity and efficiency. It has been successfully applied to detect various pathogens and their drug resistance genes (Seki et al. 2005, Lee et al. 2016), including MTB (Iwamoto et al. 2003). TB-LAMP targets Mycobacterium tuberculosis complex (MTBC) genomic regions like gyrB and IS6110, demonstrating high sensitivity and specificity (Iwamoto et al. 2003, Yadav et al. 2022). Endorsed by the WHO as an alternative to smear microscopy, TB-LAMP has been adopted in several resource-limited settings. Its simplicity and speed make it suitable for screening, though its reliance on highly specific primers limits its ability to detect a wide range of resistance mutations (Aulia et al. 2023). RPA, an ultra-fast isothermal amplification technique, operates at 37°C–42°C and produces results within 20 min (Lobato and O’Sullivan 2018). It has been applied to MTB detection and drug resistance screening, targeting IS6110 and rpoB mutations (Singpanomchai et al. 2019, Jirakittiwut et al. 2025). RPA offers advantages like low-temperature operation, minimal equipment, and a short turnaround time, making it ideal for POCT in resource-limited settings. Hu et al. (2024) integrated RPA with catalytic hairpin assembly and CdTe quantum dots to create a low-cost POCT platform with high sensitivity and specificity. However, challenges like non-specific primer binding and reliance on a stable power supply limit its application. Figure 3a illustrates the workflow of LAMP and RPA for MTB detection (Mahato and Kumar 2024). Other isothermal techniques, such as strand displacement amplification, nucleic acid sequence-based amplification, rolling circle amplification, transcription-mediated amplification, and helicase-dependent amplification, also show potential for rapid MTB detection (Mahato and Kumar 2024). However, their clinical adoption is constrained by limitations in specificity, reliance on a stable power supply, and the need for automated systems.
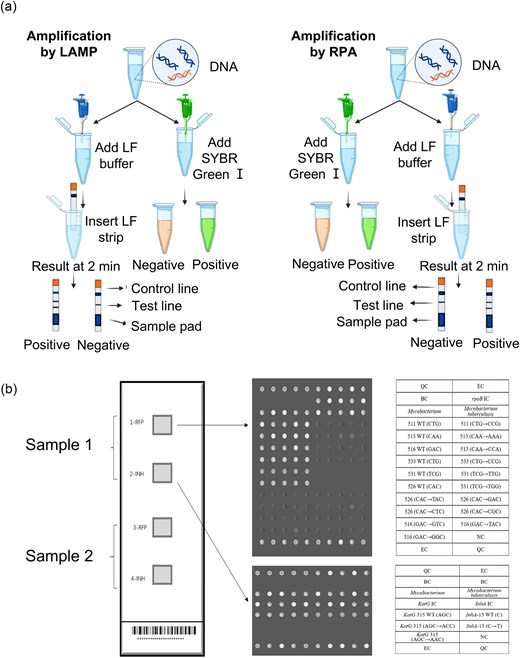
Molecular diagnostic methods for MTB detection and DST. (a) Standard workflow of LF-LAMP and LAMP-S (left) and LF-RPA and RPA-S (right) for the detection of MTB. Reprinted (adapted) with permission from Mahato and Kumar (2024). Copyright (2024), Journal of Microbiological Methods. (b) The layout of the DNA microarray method module; each detection panel includes 4 detection modules, which can detect two specimens at the same time. Reprinted (adapted) with permission from Feng et al. (2021). Copyright (2021), Scientific Reports.
DNA microarrays
DNA microarrays, unlike nucleic acid amplification-based methods, involve immobilizing DNA probes on a substrate for hybridization with the sample (Schena et al. 1995). Figure 3b illustrates the workflow of the DNA microarray method for detecting specific drug resistance genes in MTB (Feng et al. 2021). A key advantage is the ability to immobilize multiple probes, enabling simultaneous detection of multiple resistance genes. DNA microarray technology has been applied to detect a wide range of gene mutations associated with drug-resistant MTB, allowing for the diagnosis of resistance to INH, RIF, EMB, SM, and other drugs (Linger et al. 2014, Jain and Kulkarni 2024). DNA microarrays are particularly effective in detecting smear-positive AFB samples. However, a significant limitation is sensitivity for low-bacterial-load samples, often leading to false negatives in smear-negative cases (Feng et al. 2021, Xie et al. 2022). DNA microarrays may also have difficulty detecting novel or rare mutations outside the probe region, and synonymous mutations could result in false positives.
Gene sequencing
Gene sequencing is a powerful tool for identifying MTB strains and detecting drug resistance through genetic sequence determination and alignment. Sanger sequencing, the classical first-generation sequencing method, is commonly used for obtaining MTB nucleic acid sequences. However, despite its reliability, Sanger sequencing is limited by low throughput, making it less suitable for large-scale analyses (Chen et al. 2017). It demonstrated detection rates of 84.31% for MDR-TB and 83.33% for XDR-TB when compared to DST. Next-generation sequencing (NGS) has revolutionized genetic analysis by enabling simultaneous high-throughput sequencing of billions of DNA fragments (Shendure and Ji 2008). However, the high cost of NGS is a significant barrier to widespread clinical adoption. Whole-genome sequencing (WGS), based on the NGS platform, provides a comprehensive genetic map of MTB, enabling the detection of both known and novel resistance mutations, including “off-target” mutations (Cloutier Charette et al. 2024). However, the adoption of WGS in high-burden, resource-limited settings remains low due to high costs, the need for specialized bioinformatics expertise, and infrastructure requirements (Satta et al. 2018, Ng et al. 2024). Metagenomic NGS facilitates unbiased pathogen detection directly from clinical samples without prior culture, making it invaluable for rapid diagnosis and resistance profiling (Shi et al. 2020, Chen et al. 2024). Targeted NGS (tNGS) selectively focuses on multiple gene regions related to drug resistance, enabling rapid and simultaneous detection of resistance mutations with high sensitivity and specificity, particularly for first-line drugs and FQs (Mansoor et al. 2023, Schwab et al. 2024). Recognizing its utility, WHO approved tNGS in 2024 as a genotypic DST method for drug-resistant TB (Zhang et al. 2024, WHO 2024b). Nanopore-targeted sequencing (NTS) is an emerging technology combining culture-free sequencing, high throughput, and precise detection. Compared with WGS, NTS offers a faster turnaround time, and greater sequencing depth with reduced cost and data burden (Tang et al. 2024, Yang et al. 2024).
NGS-based technologies offer robust insights into MTB drug resistance but are constrained by limitations, such as reliance on high-quality DNA templates, compromised accuracy with degraded samples, and inability to detect non-mutational resistance mechanisms. Technical complexity, high costs, and bioinformatics requirements also hinder their application in resource-limited settings. Despite these challenges, molecular diagnostic methods, encompassing PCR-based techniques, isothermal amplification, DNA microarrays, and gene sequencing, represent a significant advancement in TB diagnostics, offering faster and more comprehensive detection of MTB and drug resistance compared to traditional methods. Continued innovation and optimization are crucial to overcome existing limitations and expand access to these powerful tools globally.
Raman spectroscopy methods
Raman spectroscopy, often described as a molecular “fingerprint” technique, is a powerful scattering method that enables in situ, non-invasive, and label-free detection of molecular structures (Huang et al. 2010). This method has proven invaluable for the analysis of MTB and other pathogens, offering a unique approach to characterizing biomolecular composition. When combined with machine learning algorithms, Raman spectroscopy can be used for both pathogen identification and drug resistance detection, demonstrating its potential for rapid and accurate diagnostics (Wang et al. 2023). For example, Ogunlade et al. (2024) developed a Raman spectroscopy system coupled with machine learning for detecting TB drug resistance (Fig. 4a–c). Their approach, employing neural networks, achieved an impressive classification accuracy of over 98% for resistant vs. susceptible Bacillus Calmette–Guérin (BCG) strains in dried samples and 79% in sputum samples. They further enhanced the system’s sensitivity and specificity by developing a low-cost, portable, fully automated Raman microscope and incorporating gold nanoparticles for surface-enhanced Raman spectroscopy (SERS). Among the various Raman techniques, SERS and single-cell Raman spectroscopy (SCRS) stand out for their high sensitivity and specificity, making them particularly promising for pathogen diagnostics. SERS provides significantly enhanced sensitivity compared to traditional Raman spectroscopy, while SCRS enables simultaneous pathogen identification and DST, offering a comprehensive analytical platform.
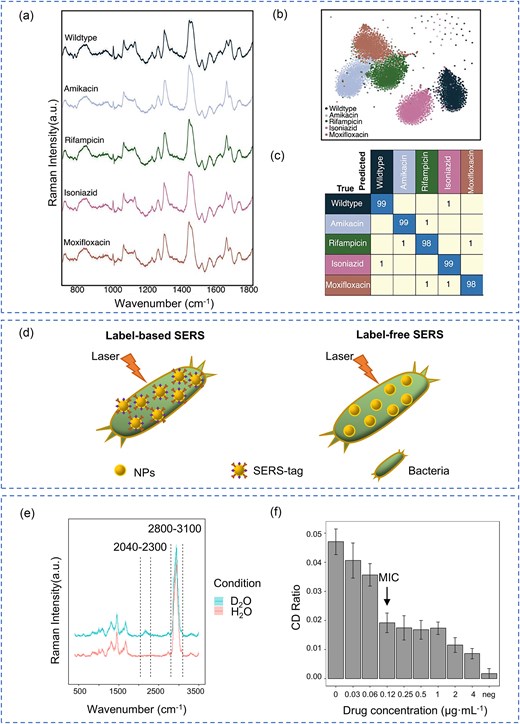
Raman Spectroscopy methods for MTB detection and DST. (a) Average Raman spectra with standard deviation for five BCG strains. (b) t-distributed stochastic neighbor embedding projection of Raman spectra from BCG strains resistant and susceptible to four antibiotics, grouped by antibiotic class. (c) Confusion matrix generated by convolutional neural network for classifying BCG strains based on Raman spectra. (a–c) Reprinted (adapted) with permission from Ogunlade et al. (2024). Copyright (2024), Proceedings of the National Academy of Sciences of the United States of America. (d) Schematic representation of label-based and label-free SERS for bacterial detection. (e) Representative Raman spectra of MTB labeled with D2O for 24 h. (f) Carbon–deuterium (C–D) ratio of MTB (H37Rv strain) following RIF treatment at various concentrations, showing dose-dependent metabolic suppression and enabling MIC determination.
Surface-enhanced Raman spectroscopy
SERS is a powerful signal enhancement technique that amplifies the detection of pathogens or biomolecules at extremely low concentrations. This amplification is achieved by leveraging the interaction between the analyte and the surface plasmon resonance effect of a metal-coated substrate (Qiao et al. 2024). As illustrated in Fig. 4d, SERS-based bacterial detection can be broadly categorized into label-free and label-based methods. Label-free SERS directly detects intrinsic molecular “fingerprints” through substrate interaction, offering a simple, rapid, and cost-effective approach. In contrast, label-based SERS employs antibody- or aptamer-coated tags to bind bacterial targets, enhancing sensitivity and reproducibility, making it particularly effective for specific MTB identification (Wang et al. 2019). The combination of ultra-high sensitivity and adaptability makes SERS an ideal candidate for POCT applications and a valuable diagnostic tool in clinical microbiology.
Wang et al. (2022) demonstrated the power of SERS by combining it with machine learning algorithms to achieve rapid and accurate identification of MTB strains. Their approach effectively distinguished between smear-positive and smear-negative sputum samples, pulmonary and extrapulmonary MTB strains, and drug-sensitive and drug-resistant MTB strains (RIF and INH). This study highlights the promising potential of SERS technology, especially when integrated with deep learning algorithms, for accurate and efficient MTB diagnosis in clinical settings. Furthermore, Qiao et al. (2024) developed a CRISPR-SERS sensor for ultrasensitive MTB DNA detection, combining the transmembrane cleavage ability of CRISPR-Cas12a with SERS. This method achieved a remarkably low detection limit of 4.42 pM for genomic DNA and could detect MTB-specific plasmids at just 5 copies–μl−1. The assay demonstrated 100% accuracy in detecting DNA from sputum samples, with a rapid processing time of 50 minutes and high specificity. Although promising for portable, field-based TB testing, it remains at the proof-of-concept stage and requires further clinical validation.
Single-cell Raman spectroscopy
Different bacterial phenotypes exhibit unique biomolecular compositions, resulting in subtle but detectable differences in their corresponding Raman spectra profiles (Ogunlade et al. 2024). Puppels et al. (1990) pioneered the application of Raman spectroscopy to single-cell studies, demonstrating its significant potential in cell biology, diagnostics, and pharmacology. This technique is particularly effective for understanding metabolic activity, phenotypic identification, and microbial heterogeneity, facilitating culture-free bacterial identification and rapid antimicrobial susceptibility testing (AST) (Yi et al. 2021).
The combination of SCRS with stable isotope labeling techniques, particularly through the incorporation of heavy isotopes like 13C, 15 N, or 2H (D), induces characteristic Raman spectral shifts. These shifts occur because the heavier isotopes replace lighter atoms in biomolecules, altering their vibrational frequencies. Song et al. (2017) developed a heavy-water-labeled Raman drug susceptibility assay, quantifying antibiotic-induced inhibition of cellular metabolic activity at the single-cell level. This innovative approach has been successfully applied to identify drug-resistant bacteria in environmental samples and to profile resistance in diverse pathogens (Yi et al. 2021). These advances highlight the potential of using cellular metabolism as a more reliable indicator for determining the minimal drug concentration that effectively inhibits both fast-growing and non-growing bacteria.
Moreover, Ren et al. (2023) employed D2O-probed Raman microspectroscopy to assess metabolic activity in Mycobacterium abscessus (MAB) and uncover drug resistance mechanisms. This approach enabled rapid and reliable AST for clarithromycin and LZD, achieving categorical agreements of 90% and 83%, respectively, compared to conventional AST results. Using a similar approach, our team applied D₂O-probed SCRS to slower-growing MTB (Wang et al. 2021, Yi et al. 2021). After anti-TB drug exposure, cultures were labeled with D₂O for 24 h, followed by single-cell Raman spectral acquisition (Fig. 4e). In the case of RIF, the C–D ratio in the H37Rv strain showed a clear, concentration-dependent decline, allowing MIC determination based on metabolic suppression thresholds (Fig. 4f). These findings support the potential of D₂O-probed SCRS as a rapid, label-free method for pDST in MTB. Further studies with additional first-line drugs and clinical isolates are underway to validate this methodology and broaden its diagnostic applicability. This represents a significant step toward developing faster and more efficient methods for guiding TB treatment.
Mass spectrometry methods
Matrix-assisted laser desorption/ionization time-of-flight mass spectrometry (MALDI-TOF MS) is a powerful and efficient analytical technique used for the rapid identification and characterization of microorganisms, including MTB. This method employs a matrix-assisted laser to gently ionize sample molecules, primarily proteins. The ionized molecules are then separated based on their mass-to-charge ratio using a time-of-flight mass analyzer, which measures the time it takes for ions to travel a fixed distance. This process generates a unique mass spectrum profile, essentially a “fingerprint” composed of proteins with different masses, allowing for the differentiation of a wide range of bacterial species, including both environmental and pathogenic mycobacteria (Croxatto et al. 2012, Pastrone et al. 2023).
Since the early 2000s, MALDI-TOF MS has been increasingly utilized for MTB identification. By comparing the acquired mass spectra with comprehensive reference databases, accurate identification and classification of bacterial strains can be achieved (Pignone et al. 2006, Balada-Llasat et al. 2013). This capability has significantly streamlined the diagnostic process in clinical microbiology.
MALDI-TOF MS is approved for routine microbial identification in many regions because of its speed, cost-effectiveness, and easy integration into laboratory workflows. However, its use in MTB diagnosis is limited by the requirement for prior culture, which can take several weeks for slow-growing mycobacteria (Caulfield and Wengenack 2016). Although it has been applied in some TB laboratories, it is not currently endorsed by the WHO for MTB diagnosis. Future developments aim to adapt this method for direct testing of clinical samples, which could significantly reduce diagnostic delays and broaden its clinical application.
Challenges and perspectives
Despite significant advancements in diagnostic methods and drug resistance detection for MTB, substantial challenges remain in achieving the ideal combination of speed, accuracy, cost-effectiveness, and accessibility, particularly in high-burden, resource-limited settings. Traditional methods, such as smear microscopy and culture-based techniques, suffer from limitations in either sensitivity (smear microscopy) or the time required for results (culture), hindering timely diagnosis and treatment initiation. While molecular diagnostics offer high precision and the ability to detect drug resistance mutations, their high cost, infrastructure requirements, and need for specialized expertise limit their widespread implementation in many regions where TB is most prevalent (Yusoof et al. 2022). Furthermore, a key limitation of current genotypic assays is their inability to detect non-mutational mechanisms of drug resistance, potentially leading to underestimation of resistance prevalence and treatment failure.
To overcome these limitations, innovative diagnostic approaches are essential for improving detection speed, accuracy, and resistance profiling. Emerging technologies offer promising avenues for addressing these persistent challenges. Given the critical role of metabolic adaptations in drug resistance, technologies that capture metabolic fingerprints can enhance diagnostic precision. MTB counters antibiotic pressure by altering energy metabolism, lipid synthesis, and efflux pump activity. Raman spectroscopy, particularly SERS and SCRS, enables rapid pathogen identification, drug resistance profiling, and metabolic characterization. Machine learning integration further enhances these capabilities, enabling automated analysis and improving diagnostic accuracy (Ren et al. 2023, Ogunlade et al. 2024). Mass spectrometry methods, such as MALDI-TOF MS, also provide a cost-effective and rapid means of identifying cultured isolates. However, their dependence on prior culture, which can take weeks for slow-growing mycobacteria, remains a major bottleneck for early diagnosis (Mather et al. 2014). Biosensor-based platforms represent another promising direction for POCT due to their portability, adaptability, and potential for rapid results. However, advancements in biosensor sensitivity, often through nanotechnology, are still in relatively early stages of development and require rigorous validation before widespread clinical application (Joshi et al. 2022).
To achieve transformative progress in TB diagnostics, future research should prioritize the development of integrated diagnostic platforms. These platforms should ideally combine the strengths of molecular methods (for sensitivity and resistance detection), spectroscopic techniques (for rapid, label-free analysis), and biosensor-based approaches (for POCT and ease of use). The incorporation of AI and machine learning into diagnostic data analysis holds immense potential for optimizing clinical decision-making, automating workflows, and improving diagnostic accuracy. Crucially, a concerted effort is needed to develop and deploy affordable, intuitive, and user-friendly diagnostic tools specifically tailored for high-burden, resource-limited settings. This will require not only technological innovation but also a focus on implementation science, ensuring that new diagnostics are effectively integrated into existing healthcare systems and reach the populations that need them most. Ultimately, overcoming the challenges in TB diagnostics is essential for achieving global TB control and elimination goals.
Conclusion
The diagnostic landscape for MTB and drug resistance has significantly advanced. However, no single method currently meets the combined clinical requirements of speed, sensitivity, affordability, and accessibility. This review provides a focused analysis of pathogen-based diagnostic methods for MTB, covering both classical and emerging technologies. It uniquely incorporates an updated evaluation of clinical validation status, highlighting WHO-endorsed methods and those still in development. In particular, we introduced our recent work using D₂O-labeled SCRS for rapid, label-free pDST, demonstrating its potential as a culture-free strategy for MTB resistance profiling.
Addressing persistent diagnostic challenges will require a multi-pronged strategy, which includes integrating complementary diagnostic modalities, incorporating AI for data analysis, and, crucially, developing affordable, user-friendly, and resource-efficient solutions tailored for high-burden areas. This necessitates both technological innovation and a focus on implementation science. Continued innovation, cross-disciplinary collaboration, and a commitment to equitable access are vital for advancing global TB diagnostics. Overcoming these barriers will improve patient outcomes, reduce TB transmission, and contribute significantly to global TB control and elimination goals.
Author contributions
Xin Mao (Conceptualization, Writing – original draft, Writing – review & editing), Jingkai Wang (Funding acquisition, Writing – original draft), Junchi Xu (Writing – review & editing), Ping Xu (Writing – review & editing), Huijie Hu (Funding acquisition, Writing – original draft), Li Li (Writing – review & editing), Zhiqiang Zhang (Supervision, Writing – review & editing), and Yizhi Song (Conceptualization, Funding acquisition, Supervision, Writing – review & editing)
Conflict of interest
None declared.
Funding
This work was funded by the National Key R&D Program of China (2022YFC2403300), the National Natural Science Foundation of China (32170173), the Pilot Project of Basic Research in Suzhou Science and Technology Plan (SSD2024015), the Gusu Innovation and Entrepreneurship Leading Talents of Suzhou City (ZXL2021422), and the Natural Science Foundation of Jiangsu Province (BK20230224).
Data availability
No new data were generated or analyzed in support of this research.
