


Abstract
The objective of this study was to determine the population structure of Escherichia coli ST73 isolated from human bacteraemia and urinary tract infections.
The genomes of 22 E. coli ST73 isolates were sequenced using the Illumina HiSeq platform. High-resolution SNP typing was used to create a phylogenetic tree. Comparative genomics were also performed using a pangenome approach. In silico and S1-PFGE plasmid profiling was conducted, and isolates were checked for their ability to survive exposure to human serum.
E. coli ST73 isolates circulating in clinically unrelated episodes show a high degree of diversity at a whole-genome level, but exhibit conservation in gene content, particularly in virulence-associated gene carriage. The isolates also contain a highly diverse plasmid pool that confers MDR via carriage of CTX-M genes.
Our data show that a rise in incidence of MDR E. coli ST73 clinical isolates is not due to a circulating outbreak strain as in E. coli ST131. Rather the ST73 circulating strains are distantly related and carry a diverse set of resistance plasmids. This suggests that the evolutionary events behind emergence of drug-resistant E. coli differ between lineages.
Introduction
Extra-intestinal pathogenic Escherichia coli (ExPEC) is the term used to describe strains of E. coli that can asymptomatically colonize the intestinal tract of humans and animals, but cause disease in non-intestinal sites.1 In humans ExPEC most commonly cause urinary tract infections (UTIs), which is thought to affect as many as 70% of the global female population.1 ExPEC are also capable of causing bacteraemia, where large numbers of bacterial cells gain entry to the bloodstream, causing a potentially life-threatening infection. The incidence of bacteraemia caused by ExPEC has been increasing rapidly in the past 10 years, with ExPEC now the most common cause of bacteraemia in Europe, overtaking MRSA and Clostridium difficile bloodstream infections.2
The rise in cases of ExPEC bacteraemia is mirrored by a marked increase in the carriage of MDR plasmids in ExPEC. In particular, ExPEC are associated with the sustained carriage and dissemination of genes encoding ESBL, especially the CTX-M variant. In some countries as many as 50% of bacteraemia ExPEC isolates are ESBL-positive isolates.2 Numerous epidemiological studies have shown the E. coli ST131 clone to be the most commonly isolated MDR ExPEC strain type from human clinical cases.3,4 ST73 is another phylogroup B2 strain type that is also frequently isolated from human clinical cases.4 Unlike ST131, which has been extensively studied and characterized at population and genomic levels,5–7 very little is known about ST73 beyond the reference ExPEC strain CFT073.8
We recently conducted a molecular epidemiological survey of bacteraemia ExPEC isolates from the East Midlands area of the UK.9 Our study found that MDR ExPEC were significantly more abundant in bacteraemia samples than clinical urine samples over a concomitant time frame. Perhaps more surprisingly, our study also showed that ST73 had risen in prevalence to become the most commonly isolated MDR ExPEC strain type from bacteraemia samples, and not ST131 as observed in a previous study in the same region.4 Given that the rapid increase in clinical cases of MDR E. coli ST131 is attributable to rapid global dissemination of a successful clone,6,7 we sought to determine whether the high incidence of MDR ST73 clinical isolates from our bacteraemia study was also due to the emergence of a successful dominant clone.
Methods
Bacterial isolates
An epidemiological investigation of bacteraemia and UTI E. coli isolates conducted by our group in 2013 identified an increase in the number of E. coli ST73 clinical isolates containing the CTX-M gene conferring MDR.9 Twenty-two isolates were selected for sequencing, incorporating 10 ESBL-positive blood isolates, 2 ESBL-negative blood isolates, 3 ESBL-positive UTI isolates and 7 ESBL-negative UTI isolates (Table 1). These were selected to represent the diversity in ESBL phenotype in the sample population.
List of isolates and genome assembly statistics used in this study
| Isolate | PCR ESBL type | Genome size (bp) | Number of contigs | N50 contig size | Percentage mapped reads | S1-PFGE plasmid profile | In silico Inc typing |
|---|---|---|---|---|---|---|---|
| B10 | CTX-M-15 | 5 173 276 | 106 | 108 731 | 94.5 | 112 kbp | FIB(AP001918), FII, Col156 |
| B14 | negative | 5 099 552 | 158 | 113 745 | 90.21 | negative | |
| B18 | CTX-M-15 | 5 120 683 | 125 | 122 417 | 91.93 | 33.5 kbp, 48.5 kbp | non-typeable |
| B29 | CTX-M-15 | 5 261 474 | 168 | 101 820 | 93.7 | 112 kbp | FIB(AP001918), FII, Col156 |
| B36 | CTX-M-15 | 5 191 523 | 152 | 125 321 | 92.26 | 145 kbp | FIB(pB171), FII, Col156 |
| B40 | CTX-M-15 | 5 257 611 | 165 | 103 459 | 91.43 | 140 kbp | FIA, FIB(AP001918) |
| B72 | CTX-M-15 | 5 158 804 | 110 | 134 654 | 84.53 | 33.5 kbp, 82 kbp | FII(pRSB107) |
| B73 | CTX-M-15 | 5 150 717 | 156 | 121 329 | 94.38 | 112 kbp | FIB(AP001918), FII, Col156 |
| B84 | CTX-M-15 | 5 182 704 | 137 | 134 972 | 93.42 | 112 kbp | FIB(AP001918), FII, Col156 |
| B91 | CTX-M-15 | 5 155 911 | 197 | 79 515 | 90.23 | 120 kbp | FIB(S), FII, Col156 |
| B102 | negative | 5 075 956 | 160 | 87 164 | 93.51 | negative | |
| B134 | OXA-1, CTX-M-15 | 5 230 535 | 154 | 116 039 | 93.61 | 82 kbp | FIB(AP001918), FII, FIA |
| U1 | negative | 5 243 352 | 151 | 123 112 | 86.52 | negative | |
| U7 | negative | 5 176 031 | 145 | 126 228 | 93.16 | negative | |
| U21 | negative | 5 145 668 | 162 | 113 459 | 91.81 | negative | |
| U24 | negative | 5 120 446 | 147 | 110 560 | 89.83 | negative | |
| U30 | negative | 5 287 542 | 160 | 139 416 | 87.12 | negative | |
| U36 | negative | 5 162 072 | 138 | 114 804 | 91.04 | negative | |
| U42 | CTX-M-15 | 5 188 710 | 155 | 106 920 | 93.92 | 112 kbp | FIB(AP001918), Col156, Col8282, Col(MG828) |
| U48 | negative | 5 080 928 | 112 | 113 440 | 87.44 | negative | |
| U50 | CTX-M-15 | 5 256 879 | 145 | 117 621 | 94.03 | 48.5 kbp | FII |
| U76 | CTX-M-15 | 5 179 037 | 140 | 133 761 | 94.11 | 112 kbp | FIB(AP001918), FII, Col156 |
Isolates with the prefix B were isolated from bacteraemia cases and isolates with the prefix U were isolated from UTI.
Percentage mapped reads equates to reads mapped against the CFT073 genome.
N50 is a weighted median statistic such that 50% of the entire assembly is contained in contigs or scaffolds equal to or larger than this value.
Genome sequencing and analysis
Isolates were sequenced on the Illumina HiSeq2500 platform using 2 × 250 bp paired-end sequencing (Table 1). Genome assemblies were performed using Velvet and PAGIT,10 which reordered contigs based on the CFT073 reference genome.8 Assembled genomes were annotated using Prokka.11 ProgressiveMauve was used to create a whole-genome alignment of the assembled genomes.12 High-resolution SNP typing was performed by mapping fastQ files against the reference ST73 genome CFT073 using SMALT (https://www.sanger.ac.uk/resources/software/smalt/#t_2) and Samtools. Resulting VCF files were filtered using vcftools13 to retain only SNPs with a MinQ 30, MinDP 10 and MinAF 0.8. The filtered VCF files were used to produce a consensus sequence for each strain relative to CFT073. The sequences were aligned using Mugsy,14 from which a maximum likelihood phylogeny was created using RaxML implementing the GTR-Gamma model.15 All raw sequence data have been deposited in the European Nucleotide Archive under project accession number PRJEB9931.
Pangenome analysis
A pangenome of the 22 sequenced strains and CFT073 was made using Gegenees.16 To determine whether there were loci associated with bacteraemia in ST73, the genetic content of bacteraemia isolates was compared against UTI isolates using a cut-off of 80% identity across 80% of bacteraemia strains and 80% identity across 20% of UTI strains. An identical analysis was conducted for ESBL positive against ESBL negative to attempt to identify loci associated with ESBL carriage. Presence of virulence-associated genes17 was determined by BlastN analysis of gene sequences against the de novo-assembled genome of each strain.
Plasmid typing
In silico plasmid typing was performed using a locally installed version of the PlasmidFinder database.18 Assembled genomes were compared with the database using BlastN to identify plasmid types present in each genome. Plasmid profiling was also performed using the S1-PFGE method.19
Results
The observed increase in MDR E. coli ST73 clinical isolates is due to a highly diverse group of strains
Sequence data for all 22 isolates were mapped against the CFT073 reference genome and a high-resolution SNP phylogenetic tree was constructed (Figure 1). The phylogenetic tree shows that bacteraemia and UTI isolates are intermixed throughout the phylogeny, as are ESBL-positive and -negative isolates. Pairwise SNP distance calculations between isolates showed that the minimum SNP distance between any two isolates was 416 SNPs, and the maximum distance was 6026 SNPs (Figure S1A, available as Supplementary data at JAC Online).
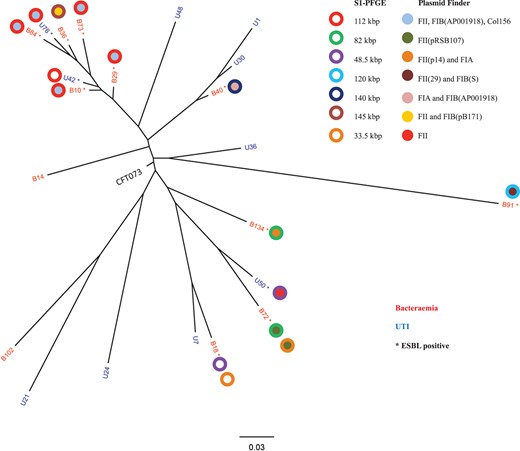
Maximum likelihood phylogenetic tree of clinical ST73 isolates, with S1-PFGE and in silico plasmid profiling superimposed. Plasmid sizes, as determined by S1-PFGE, and Inc types, as determined by in silico analysis, are indicated in the legend to the right. This figure appears in colour in the online version of JAC and in black and white in the print version of JAC.
Comparative genomic analysis indicates diversity between ST73 genomes occurs at single base pair mutation level and in plasmid repertoire
An alignment of all the ST73 genomes using progressiveMauve indicated genetic variation predominantly occurring in small contigs of the assemblies (Supplementary Data), suggesting that most gene-content variation occurs in plasmids and other mobile genetic elements. We created a pangenome of the ST73 genomes using Gegenees (Supplementary Data) showing a core genome of 3.81 Mbp, and 1201 conserved CDS from a total of 10 696 CDS, consistent with analyses performed on the E. coli species and on E. coli ST131.20,21 We performed in silico analysis to determine the presence of the major ExPEC virulence-associated genes in our dataset (Supplementary Data). This shows some differences in carriage of virulence genes but a relatively fixed virulence gene profile. The comparison of UTI and bacteraemia isolates for virulence gene carriage also showed identical profiles between the two groups. We sought to identify the presence of any loci over-represented in the UTI or bacteraemia group of strains, or in the ESBL-positive and ESBL-negative group of strains using Gegenees. This analysis failed to identify any loci associated with a propensity towards bacteraemia or ESBL carriage.
Highly diverse plasmid repertoire in circulating clinical E. coli ST73 isolates
Given the observations of our pangenome analysis, we sought to determine the extent of mobile genetic element diversity in our ST73 isolates, focusing primarily on plasmids. Using the PlasmidFinder database we performed in silico plasmid typing on our 22 isolates (Table 1). Our analysis showed that FII, FIA and FIB plasmid types were predominant. To further investigate this we performed S1-PFGE plasmid profiling of every isolate. No plasmids were detected in the CTX-M-negative isolates, but a large number of plasmid molecules were detected in the remaining isolates (Table 1). A 112 kbp plasmid was found in the six isolates that showed the most similar accessory gene content in the pangenome analysis. Superimposing the plasmid typing data on the phylogenetic tree showed that the 112 kbp plasmid is present in the six isolates that showed the lowest amount of core genome diversity (Figure 1). We compared the similarity of genomes at gene-content level using the fragmented all-against-all comparison in Gegenees to show that the six strains sharing the 112 kbp plasmid also showed gene content similarity >95% (Supplementary Data), suggesting that the plasmid pool in these six strains is highly similar if not identical.
Discussion
Epidemiological studies in the East Midlands area of the UK have highlighted an increase in incidence of E. coli ST73 MDR isolates over the past 5 years.4,9 In this study, we present the genomic analysis of 22 ST73 isolates from human clinical bloodstream and UTI cases, all isolated within a 3 month period from the same region of the UK. Our analysis shows levels of diversity in the hundreds or thousands of SNPs between isolates. This is in stark contrast to ST131, where isolates from the identical UK region over a 6 month period showed diversity of <10 SNPs between strains isolated from unrelated clinical episodes, and a maximum diversity of dozens of SNPs.5
Analysis of our ST73 genomic dataset identified the presence of a limited number of plasmid types based on in silico rep typing; however, both genomic analysis and classical plasmid profiling showed plasmid diversity in the small ST73 population sampled here. The presence of a 112 kbp plasmid was inferred in six isolates, which were also the six most closely related isolates phylogenetically and at gene-content level. It is tempting to speculate there may be a circulating sub-clone of ST73, but such inference is hampered by our small and geographically restricted sample size.
The small population we have sequenced limits the inferences we can make from our dataset. However, there are several key points that our study highlights. The first is that the evolution and emergence of MDR lineages of ExPEC does not have a one-size-fits-all model. E. coli ST131 became a predominant clinical ExPEC isolate by clonal expansion and rapid global dissemination of an MDR clone of the wider ST131 lineage.7 Our data on clinically unrelated ST73 isolates show a highly diverse population of circulating ST73 strains, with a diverse plasmid pool driving MDR in this lineage. In order to gain a more comprehensive understanding of the emergence and population structure of this important lineage of pathogenic E. coli it is vitally important that larger global isolate collections are analysed. Equally important is that these collections include non-human reservoir isolates. By doing this we will acquire a far greater understanding of the ways in which ExPEC lineages can emerge as dominant MDR clinical isolates, and move our focus beyond just E. coli ST131.
Funding
This study was funded by an EMDA iNET award to A. M. and M. D., a Kuwaiti government studentship award to F. A. and a Royal Society grant award IE121459 to Z. Z. and A. M.
Transparency declarations
None to declare.
Acknowledgements
All sequencing was performed at the Exeter Sequencing Service at the University of Exeter.
References
