


Abstract
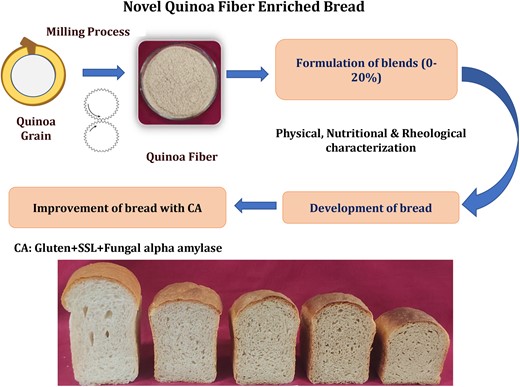
The study investigates the impact of incorporating a fibre-rich component derived from quinoa (QFC) into wheat flour on the physicochemical, rheological and bread-making characteristics. QFC, possessing triple the dietary fibre contents of quinoa grain, increased fibre levels in blends from 4% to 12%. As QFC inclusion increased from 0% to 20%, farinograph water absorption increased from 59.6% to 66.7%, while dough stability decreased from 9.9 to 3.5 min. Amylograph properties exhibited elevated gelatinisation temperature and reduced viscosities with QFC supplementation. Bread hardness surged from 997 to 2800 g with 0%–20% QFC incorporation. Sensory quality remained acceptable up to 15% QFC, beyond which it significantly declined. Additives enhanced bread volume from 2.66 to 3.34 for 15% QFC bread, along with sensory parameters. The QFC-incorporated bread not only improved nutritional quality but also positioned itself as a viable fibre-rich alternative in the food industry, promising benefits for health-conscious consumers.
Introduction
Maintaining optimal health and overall well-being requires a well-balanced diet that includes a diverse range of foods in appropriate proportions, providing essential nutrients to prevent malnutrition. Among the various macro and micronutrients crucial for human health, dietary fibre holds a significant role in sustaining good health. Integrating fibre into the daily diet is a scientific approach to fostering a healthy lifestyle. Dietary fibre primarily comprises plant-derived substances, including non-starch polysaccharides and lignin, resistant to digestion by the human system. It is divided into two components: soluble and insoluble fibre, each offering distinct benefits to the body. Soluble fibre can improve glucose tolerance, manage glycaemic response effectively and lower blood cholesterol. On the other hand, porous and low-density insoluble fibre possesses the ability to promote regular bowel movements, reduce intestinal transit time and increase faecal volume (Maphosa & Jideani, 2016). Studies have demonstrated that an adequate intake of dietary fibre positively influences the prevention and management of various conditions, including diabetes, cardiovascular diseases, obesity, constipation and colon cancer (Maphosa & Jideani, 2016). Embracing a diet rich in fibre proves to be a proactive step towards overall health and the prevention of associated health challenges.
The most effective approach to meet daily fibre requirements involves consuming whole grains, fibrous fruits, vegetables and legumes and opting for convenient high-fibre products, including fibre-enriched options. Traditionally, fibre supplementation has focused on utilising milling by-products of cereal grains. The food industry commonly employs cereal bran to manufacture bread and other bakery products due to its widespread acceptance. The addition of dietary fibre to bakery products made from wheat is a common practice aimed at enhancing the nutritional profile and health benefits of the final products. Various sources of dietary fibre, derived from different plant materials, are incorporated into bakery formulations to increase fibre content. Some researchers include the incorporation of wheat bran (Packkia-Doss et al., 2019), soluble oat fibre (De Erive et al., 2020a), corn bran (De Erive et al., 2020b), rice bran (Anil, 2012), rye bran (Döring et al., 2017), fenugreek fibre (Sakhare & Prabhasankar, 2017) and green gram fibre (Indrani et al., 2015) to produce bakery products with increased fibre content. Literature studies on bakery products incorporating bran suggest that inclusion at levels of 5%–20% leads to an improvement in total dietary fibre, protein, fat and mineral content without compromising the sensory quality of the products (Pauline et al., 2020). Beyond traditional cereal brans, nutrient-rich pseudocereals, such as quinoa, are gaining popularity as a source of dietary fibre.
Quinoa (Chenopodium quinoa Willd.) stands out as a pseudo-cereal renowned for its exceptional nutritional quality. Its remarkable ability to thrive in diverse climatic conditions positions it as a promising crop for ensuring food security amid climate variations. The edible seeds of quinoa are not only rich in protein, fat and dietary fibre but also contain valuable phytochemical compounds such as saponin, phytosterols and phytoecdysteroid. These compounds have demonstrated anticancer, hypocholesterolemic, hypoglycaemic, antioxidative and anti-inflammatory activities (Navruz-Varli & Sanlier, 2016). Quinoa, therefore, holds great potential as a versatile and health-promoting food source. Quinoa seeds exhibit a small, disc-shaped morphology, with diameters typically ranging from 1 to 3 mm. These grains are composed of three main components: a central large perisperm, a peripheral embryo, and an outer covering that includes the perianth, pericarp and seed coat (Prego et al., 1998). The outer bran, containing the highest concentration of dietary fibre and minerals, emerges as an important component within the seed for its utilisation as a functional ingredient.
A literature review has highlighted a gap in research concerning the extensive exploration of quinoa bran or fibre-rich component as potential sources of dietary fibre in food product development. There are several studies on the application of quinoa flour for the development of bakery products (Gao et al., 2018; Mu et al., 2022, 2023), but no previous studies are available concerning the effect of quinoa bran as a high fibre component on bread-making properties. The targeted separation of the fibre-rich component through physical fractionation has been shown to yield double the amount of dietary fibre compared to whole quinoa grain (Ray et al., 2021). These QFC present an opportunity to enhance the nutritional content of cereal-based food products, potentially bringing about positive changes in dietary habits. Bread, being a globally accepted and affordable staple food, is a prime candidate for such nutritional enrichment. Bread made from refined flour generally lacks essential nutrients such as dietary fibre, protein, vitamins and minerals when compared to whole grains. Incorporating quinoa fibre into refined wheat flour could lead to the development of a nutrient-rich bread, serving as an effective vehicle for nutrient delivery to a large population.
The objective of the present study is to explore the novel QFC for bread formulation, assess its impact on bread-making characteristics, and enhance overall quality using food additives. This research aims to contribute valuable insights into leveraging quinoa-derived fibre for nutritional improvement in widely consumed staple foods.
Materials and methods
Processing of quinoa and production of novel QFC
Quinoa (Chenopodium quinoa) seeds were procured from the local market in Bangalore, India. The acquired quinoa samples underwent thorough cleaning and water conditioning. Subsequently, the quinoa samples were processed using a laboratory Buhler mill (MLU-202) with a roller milling technique, following the procedure reported by Ray et al. (2021). The resultant product, termed quinoa fibre-rich component (QFC), was further subjected to milling, achieving a fine particle size of lower than 200 μ. This finely milled QFC was prepared for use in all subsequent experiments.
Blends formulations
The blends for analysis and product development were created by substituting refined wheat flour with QFC at varying percentages: 0%, 5%, 10%, 15% and 20%. These blends were specifically labelled as C, B1, B2, B3 and B4, respectively. The ‘C’ sample served as the control, consisting of 100% refined wheat flour. These designated blends, were used throughout the entire analysis and product development study.
Determination of physical characteristics of the blends
Particle size distribution
The particle size distribution of the blends was assessed using a Laser 132 Particle Size Analyzer (S3500, Microtrac Inc., USA). This analysis aimed to ensure the uniform nature of particle sizes within the blends. The percentage distribution of particles across different size classes (60–700 μ) was determined. Data obtained were processed using the Flex software integrated into the Microtrac S3500.
Colour measurement
Colour measurements were conducted using a Color Flex-EZ-Hunter Lab CN-508i (Reston USA) Laboratory, USA. Samples were securely placed in the sample holder, and colour values were automatically recorded across wavelengths ranging from 360 to 800 nm. The results were expressed in terms of lightness (L) and colour components (+a: red, −a: green, +b: yellow, −b: blue).
Rheological evaluation of blends
Dough rheological properties were assessed using a Farinograph (Model No. 810108004; Brabender, Duisburg, Germany), following the standard AACC method (54–21) 2012. The gelatinisation and pasting properties of starches, such as hot paste viscosity (HPV), cold paste viscosity (CPV), break down (BD) and set back (SB) under different time and temperature conditions for all the blends were estimated using a visco-amylograph (Brabender, Duisburg, Germany) according to the standard AACC procedure (method 61–01) 2012.
Chemical characterisation of blends
Control sample and All blends were analysed for moisture content (method 44–15), ash (method 08–01), protein (method 46–10), fat (method 30–10), dry gluten (38–10) and sedimentation value (56–61) according to the standard methods of AACC 2012 and dietary fibre (method 991.43) by AOAC (2016).
Water holding capacity (WHC) and oil holding capacity (OHC)
Water holding capacity (WHC) and oil holding capacity (OHC) assessments were conducted on the samples using the method described by Sakhare et al. (2020), with slight modifications. In this procedure, 1 g of the sample was mixed with 10 mL of distilled water or vegetable oil (sunflower) and allowed to stand for 1 h at room temperature (30 °C). Subsequently, the mixture was centrifuged at 3000g rpm for 15 min. The supernatant was carefully decanted, and the remaining precipitate was weighed for estimation. Both water-holding capacity and oil holding capacity were quantified as the amount of grams of water or oil retained by 1 g of the sample. The density of the oil used was 0.92 g mL−1.
Break making properties
Bread-making properties influenced by quinoa FRF were assessed through the test baking of bread using control and blend samples. The bread formulation consisted of wheat flour or blends (100 g), along with active dry yeast (0.75 g), salt (1.0 g), sugar (2.5 g) and hydrogenated fat (1.0 g). The water quantity for dough formation varied for each sample based on farinograph water absorption. All ingredients were mixed in a Hobart mixer (Model N-50, Hobart, GmbH, Offenburg, Germany) with a flat blade at 61 RPM for desired consistency. The dough underwent a two-stage fermentation process: initially fermented for 90 min at 30 °C and 75% relative humidity (RH), followed by remixing; the second fermentation was conducted for 25 min. Subsequently, the dough was moulded, proofed for 55 min at 30 °C and 85% RH, then baked for 25 min at 220 °C. After baking, the bread was cooled to room temperature and packed.
Bread quality evaluation
The specific volume of the bread was determined through the volume and weight results. The bread volume was measured using the rapeseed displacement method (Sudha & Leelavathi, 2008), and this information was then utilised to calculate the specific volume of bread. Assessment of bread crumb firmness was conducted using a texture analyser (TAHDi, Stable Micro Systems, Godalming, UK) following the standard method (AACC 2010, Method 74–09). The force needed to compress 50% of the bread slice (25 mm) was recorded using an aluminium cylinder probe P/75. Crust and crumb colour, indicative of effective baking and contributing to the visual appeal and overall sensory quality of the product, were analysed using the same method as mentioned in section 2.3.2. Preliminary sensory evaluation of the bread was performed by ten panellists who are researchers and subject experts in the field of baking technology, considering various parameters such as crust colour, crumb colour, grain score, texture, eating quality and overall quality.
Statistical analysis
The experiments were carried out in three replicates. The data were statistically analysed and the treatments were tested using Duncan's multiple range tests (Steel et al., 1980).
Results and discussion
Physical characteristics of blends
Colour is a crucial factor directly impacting consumer product acceptability. The colour of the blend significantly influences the overall appeal of the final product, as indicated by the data presented in Table 1. The control wheat flour exhibited the highest brightness value, with a gradual reduction observed as the addition of QFC increased. The lowest L* value was noted for B4, signifying that QFC contributes to a comparatively darker colour. The outer layer of quinoa contains pigments responsible for the light-yellow colour of QFC. QFC demonstrated higher yellowness (b*) and redness (a*) values compared to control flour, highlighting the addition of QFC to wheat flour and a notable decrease in brightness. Moreover, a significant increase in redness (+a) and yellowness (+b) values was observed in blends with QFC replacement ranging from 0% to 20%. This suggests a distinct influence of QFC on the colour attributes of the blends.
Effect of QFC on colour and particle size distribution of wheat flour
| Colour properties | Particle size distribution | |||||||
|---|---|---|---|---|---|---|---|---|
| Sample | L* | a* | b* | 250–300 μ | 150–250 μ | 100–150 μ | 60–100 μ | <60 μ |
| QFC | 68.53 ± 0.04f | 2.61 ± 0.03a | 16.63 ± 0.01a | 17.15 | 33.51 | 15.45 | 16.63 | 17.26 |
| C | 88.12 ± 0.05a | 0.39 ± 0.03f | 8.33 ± 0.09f | 0.47 | 5.90 | 21.6 | 38.28 | 33.75 |
| B1 | 84.54 ± 0.03b | 0.95 ± 0.02e | 9.86 ± 0.07e | 1.24 | 10.63 | 22.34 | 34.57 | 31.22 |
| B2 | 82.59 ± 0.01c | 1.27 ± 0.02d | 11.00 ± 0.03d | 0.77 | 12.61 | 23.82 | 32.39 | 30.41 |
| B3 | 80.74 ± 0.03d | 1.57 ± 0.02c | 11.87 ± 0.03c | 2.27 | 17.36 | 23.49 | 29.20 | 27.68 |
| B4 | 79.08 ± 0.07e | 1.76 ± 0.01b | 12.63 ± 0.08b | 2.29 | 21.07 | 22.60 | 27.13 | 26.91 |
Values are means of three replicates ± standard deviation.
Values in the column with the same letter in superscript are not significantly different from each other (P ≤ 0.05).
L = lightness/darkness, ±a: red/green, ±b: yellow/blue.
QFC: Quinoa fibre-rich component, C: Control wheat flour, B1, B2, B3 and B4: blends of 5%, 10%, 15%, 20%, respectively with QFC.
A granulation property evaluation through particle size analysis was conducted on the blends, and the results are presented in Table 1. The majority of QFC particles (48.97%) were found to be below the size of 150 μ. Approximately 33.51% of the particles fell within the range of 150–250 μ, while the remaining 17.52% were above 250 μ. The average particle size of QFC was determined to be 151.60 μ. In contrast, the control flour, with 93% of particles sized below 150 μm, exhibited an average particle size of 77.65 μm. Notably, QFC demonstrated a larger particle size compared to the control wheat flour. The results showed that an increase in the proportion of QFC within the wheat flour correspondingly led to a higher number of particles falling within the range of 150–250 μ. The quality of high-fibre bread is influenced by the particle size of the cereal bran. Pavlovich-Abril et al. (2015) found that fine wheat bran (180–155 μm) resulted in higher specific volumes and softer bread compared to larger particle sizes (265–180 μm).
Another observation by Coda et al. (2014) indicates that wheat bran with an average particle size of 160 μm yielded the highest specific loaf volume compared to other particle sizes (750, 400 and 50 μm). Additionally, fine bran exhibited a higher lightness value than coarser bran, contributing to a reduction in darkness in the final product.
Nutritional properties
The nutritional composition presented in Table 2 demonstrates that QFC showed significant dietary fibre content at 38.17%, accompanied by substantial protein (21.35%), ash (21.35%) and fat content (3.67%). This signifies that QFC is a rich source of fibre, protein and ash. In contrast, wheat flour exhibited lower values for dietary fibre, ash, protein and fat content. The nutritional profile of QFC aligns with previous studies on quinoa bran (Föste et al., 2014; Ray et al., 2021). Upon reviewing earlier research, it was observed that the total dietary fibre (TDF) content in the current QFC surpasses that of oat bran and rice bran. While the TDF of wheat bran is marginally higher than that of QFC, QFC exhibits a superior protein content compared to all these brans (Alan et al., 2012; Anil, 2012).
Effect of QFC on nutritional properties of wheat flour
| Samples | Moisture (%) | Ash (%) | Protein (%) | Fat (%) | TDF (%) | Carbohydrates* (%) | Dry Gluten (%) | SV (mL) |
|---|---|---|---|---|---|---|---|---|
| QFC | 9.83 ± 0.09f | 3.67 ± 0.02a | 21.35 ± 0.18a | 4.08 ± 0.01a | 38.17 ± 0.28a | 32.73 ± 0.65f | – | – |
| C | 12.06 ± 0.05a | 0.66 ± 0.02f | 12.31 ± 0.07f | 1.16 ± 0.06f | 4.02 ± 0.29f | 81.85 ± 0.78a | 9.62 ± 0.15a | 21.00 ± 0.00a |
| B1 | 11.74 ± 0.06b | 0.81 ± 0.03e | 12.85 ± 0.13e | 1.22 ± 0.08e | 5.45 ± 0.32e | 79.67 ± 0.71b | 9.10 ± 0.19b | 20.00 ± 1.00ab |
| B2 | 11.68 ± 0.05c | 0.96 ± 0.02d | 13.42 ± 0.15d | 1.59 ± 0.03d | 7.56 ± 0.25d | 76.47 ± 0.85c | 8.85 ± 0.05c | 19.00 ± 0.00b |
| B3 | 11.48 ± 0.01d | 1.07 ± 0.03c | 13.78 ± 0.11c | 1.71 ± 0.08c | 9.73 ± 0.18c | 73.71 ± 0.85d | 8.14 ± 0.14d | 17.00 ± 1.00c |
| B4 | 11.50 ± 0.04e | 1.29 ± 0.01b | 14.15 ± 0.12b | 1.78 ± 0.02b | 11.12 ± 0.13b | 71.66 ± 0.65e | 7.61 ± 0.08e | 16.00 ± 0.00d |
*Calculated by difference.
Values are means of three replicates ± standard deviation.
Values in the column with the same letter in superscript are not significantly different from each other (P ≤ 0.05).
Except for moisture, all values are expressed on dry-weight basis.
C, control wheat flour; QFC, quinoa fibre-rich component; SV, sedimentation volume; TDF, total dietary fibre; B1, B2, B3 and B4, blends of 5%, 10%, 15%, 20%, respectively with QFC..
The milling process involved in producing wheat flour, where the bran and germ are removed, results in a significant nutrient loss. The endosperm, left behind after this process, contains lower levels of protein, fibre and minerals, making it less nutritious (Cappelli et al., 2020). Hence, incorporating QFC into flour and bread preparation stands to enhance the nutritional value of the final product.
The moisture content in the blends showed a decreasing trend with higher QFC additions to wheat flour. As QFC content increased in the blends, there was a notable increase in total dietary fibre, protein, ash and fat content, thereby enhancing the overall quality of the flour. This enhancement is attributed to the higher nutrient presence in QFC, reflecting in elevated values within the blends. The addition of QFC resulted in an increase in total dietary fibre from 4.02% to 11.12% in C to B4 blend.
However, the incorporation of QFC led to a reduction in gluten content and sedimentation values, indicating decreased strength. Adequate gluten content is crucial for the structure and texture of bread. The strength of the dough, its capacity to retain gas during fermentation, and the final volume of the bread are all influenced by the quantity and quality of gluten present in the flour. The gradual decrease in gluten content and sedimentation values affected the resulting bread in terms of texture and loaf volume.
Functional properties
The water holding capacity (WHC) and oil holding capacity (OHC) of QFC were determined to be 3.40 g g−1 and 2.57 g g−1, respectively, with a solubility index of 16.75% (Fig. 1). These findings align with a previous report by Liu et al. (2020). In contrast, control wheat flour exhibited comparatively lower WHC (1.56 g g−1), OHC (1.95 g g−1) and solubility index (5.20%) than the blends. The water holding capacity (WHC) of fibre indicates its physiological importance in gastrointestinal function and blood sugar regulation. QFC demonstrated a higher WHC compared to oat hull (2.13 g g−1) and rice hull (2.58 g g−1), as reported by (Jacometti et al., 2015). An increased WHC in fibrous components is anticipated to improve moisture retention in the final product, leading to a softer texture. The WHC of bread formulations plays a critical role in ensuring adequate hydration and reducing proofing time, as emphasised by Xu et al. (2009).
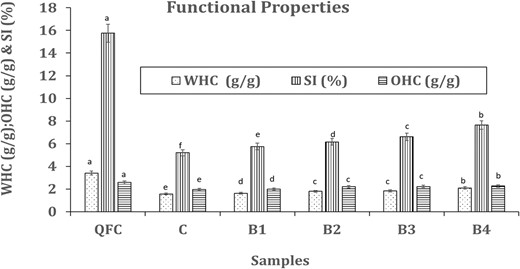
Effect of QFC on functional properties of wheat flour. Error bars indicate the standard deviation of three replicates. The same letter above bars indicate that values are not significantly different from each other (P ≤ 0.05). C, control wheat flour; OHC, oil holding capacity; QFC, quinoa fibre-rich component; SI, solubility index; WHC, water holding capacity, B1, B2, B3 and B4: blends of 5%, 10%, 15%, 20%, respectively with QFC.
These values gradually increased with the addition of QFC from 0% to 20%. The high-water holding capacity observed in fibres is a significant attribute, influenced by the presence of hydroxyl and hydrophobic groups within the matrix. QFC, primarily composed of cellulose, hemicellulose and lignin, contains numerous hydroxyl (OH) groups, contributing to its WHC and OHC. The farinograph water absorption of QFC also reflects its water holding capacity. Moreover, the solubility index of QFC was notably higher than that of control wheat flour, resulting in blends with higher amounts of QFC exhibiting increased water solubility index. The B4 blend, in particular, displayed the highest OHC (2.26 g g−1) and solubility index (8.65%).
Rheological properties
Farinograph properties play an important role in assessing the baking qualities and performance of wheat flour dough. The significant alterations in farinograph properties resulting from the inclusion of QFC are highly indicative of the baking quality of high-fibre bread. Notably, farinograph water absorption is a critical property influencing the proofing of bread dough. It contributes to the hydration of starch, proteins and dietary fibres in the flour, leading to the formation of a gluten network that imparts viscoelasticity to the dough. In this study, it was observed that the farinograph water absorption of all blends increased with increased addition of QFC to the wheat flour. The progressive replacement of wheat flour with QFC from 0% to 20% resulted in an increase in water absorption capacity (WAC) from 59.6% to 66.7% (Fig. 2a). This trend aligns with findings from previous studies on fibre-rich flour conducted by De Erive et al. (2020a, 2020b) and Sakhare & Prabhasankar (2017). The rise in water absorption capacity (WAC) in the blends is primarily attributed to the high water-holding capacity of fibre-rich fractions, as illustrated in Figure 2a. The abundant hydroxyl groups present in the fibre structure facilitate enhanced water interactions through hydrogen bonding, (Boita et al., 2016). Dough stability (DS), the highest DS was observed in the control, while the lowest was found in the 20% blend. DS directly correlates with the amount and strength of the gluten network. The decrease in stability time suggests a reduction in gluten content and a redistribution of water due to dietary fibres. The addition of QFC interferes with gluten network formation, altering its properties. Interactions between dietary fibre and gluten proteins induce structural changes in the gluten matrix, particularly affecting secondary and aggregate structures such as di-sulphide and hydrogen bonding patterns. This disruption leads to the unfolding of protein chains (Zhou et al., 2021). Dough development time is not significantly influenced by fibre. The Mixograph Tolerance Index (MTI) increased for QFC blends compared to the control. A low MTI value corresponds to stronger flours, typically resulting in high bread volume.
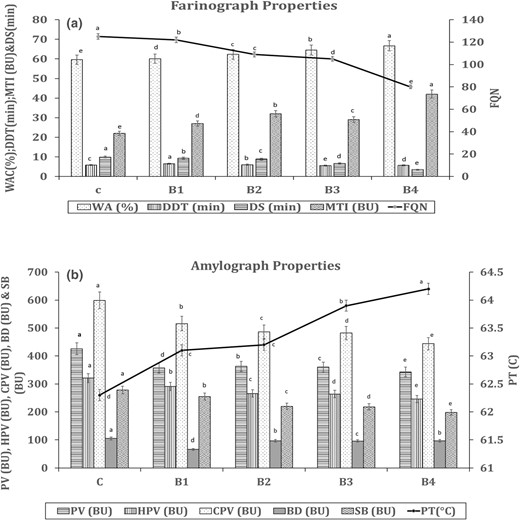
Effect of QFC on rheological properties of wheat flour (a) Farinograph & (b) Amylograph. Error bars indicate the standard deviation of three replicates. The same letter above bars indicate that values are not significantly different from each other (P ≤ 0.05). BD, break down; BU, Brabender units; C, Control wheat flour; CPV, cold paste viscosity; DDT, dough development time; DS, dough stability; FQN, Farinograph quality number; HPV, hot paste viscosity; MTI, mixing tolerance index; PT, pasting temperature; PV, peak viscosity; SB, Set back; WA, water absorption; B1, B2, B3 and B4, blends of 5%, 10%, 15%, 20%, respectively with QFC.
The pasting properties provide insights into the behaviour of starch when exposed to heating in excess water. Fibre, having different characteristics from wheat flour, exhibits a distinct influence on pasting properties in QFC-incorporated blends. The addition of QFC (ranging from 0% to 20%) led to a decrease in peak viscosity, declining from 426 to 343 BU (Figure 2b). Peak viscosity is directly proportional to starch concentration; hence, higher starch content in the wheat flour results in a higher peak viscosity value. The control sample exhibited the maximum viscosity, indicating a proportionately higher starch content. The visible reduction in peak viscosity values with QFC incorporation reflects the diminishing starch content. Fibre has the potential to impact the swelling power of starch in wheat flour, interfering with gelatinisation and viscosity. Consequently, the altered pasting properties in QFC blends results the distinct behaviour of fibre during cooking compared to traditional wheat flour. The substitution of wheat flour with fibre also influenced the gelatinisation temperature, with a decrease in wheat flour concentration leading to an increase in gelatinisation temperature. Other viscosity parameters, including HPV, CPV, BD and SB exhibited a decreasing trend after the incorporation of QFC (0%–20%). The results suggest that the addition of QFC reduces the viscosity of the blend paste during heating, cooking and cooling. This reduction can be attributed to the differences in the physicochemical characteristics of QFC compared to wheat flour. Similar trends in pasting properties were observed in previous studies involving the addition of fibre rich fraction from green gram by Indrani et al. (2015). These findings further support the finding that QFC has a consistent impact on viscosity parameters across different studies and applications.
Effect of QFC on bread making properties of wheat flour
The addition of QFC had a significant impact on the bread-making properties, resulting in an increase in the hardness value from 997 to 2800 g with 0%–20% incorporation. This rise in hardness indicated denser bread with a closely compacted crumb structure. As a consequence, the breads exhibited lower specific volume and greater hardness. The interactions between fibre and the gluten network caused thinning and weakening of the gluten matrix. Fibre in the dough matrix disrupted the viscoelastic system, producing weaker dough. Moreover, it competed for water with available starch, influencing gelling and pasting properties (Kurek & Wyrwisz, 2015). These alterations in the dough composition affected fermentation and gas entrapment, leading to a harder texture in fibre bread. Two crucial acceptability parameters for bread are the golden-brown colour of the crust and the creamish-white colour of the crumb. The decrease in lightness value of the blend was evident in the crumb's decreased lightness value. With an increase in the percentage of QFC in the blend, the crumb exhibited a higher yellowness value and the lightness value significantly decreased. Additionally, the crust became darker with the incorporation of QFC. These changes further contributed to the overall alterations in the bread's appearance and texture. Increased addition of fibre-rich components such as wheat bran (Packkia-Doss et al., 2019), corn bran (De Erive et al., 2020b) and fenugreek fibre (Sakhare & Prabhasankar, 2017) was associated with similar findings of reduced specific volume, porosity, gluten content, higher crumb hardness and darker colour. The colour changes in the bread crust were primarily influenced by the Maillard reaction, caramelisation and baking conditions. In contrast, the colour of the crumb was affected by the colour of the components added to the wheat flour, particularly polyphenols and dietary fibre (Koç & Atar Kayabaşi, 2023). According to Sabanis et al. (2009), the original colour of the fibre did not affect the crust colour. However, the colour of the crumb is generally similar to that of the fibres, as the crumb does not reach the same high temperatures as the crust. The photographs of QFC enriched bread are shown in Figure 3a and effect of additives in Figure 3b.
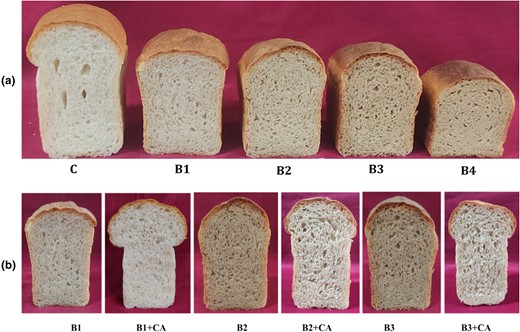
(a) Photographs of QFC enriched bread (b) Effect of additives of bread quality. CA, combination of additives; C, control wheat flour; B1, B2, B3 and B4, blends of 5%, 10%, 15%, 20%, respectively with QFC.
Preliminary sensory evaluation of the bread was conducted by a panel of ten members to assess different parameters. Each sample's parameters were individually rated by the panellists, with scores reflecting the quality of taste, appearance and overall sensory appeal. It was observed that the taste and appearance of the QFC-incorporated bread received positive feedback from all ten panellists, up to 15% blend for all blends except the 20% blend (Table 3). The overall sensory quality score remained acceptable up to a 15% QFC incorporation, beyond which the score decreased significantly. Consequently, the formulation with up to 15% QFC was considered the optimum blend, achieving favourable scores for taste, appearance and overall sensory quality according to the panellists' assessments.
Preliminary Sensory evaluation of breads
| Sensory parameters | Samples | ||||
|---|---|---|---|---|---|
| C | B1 | B2 | B3 | B4 | |
| Crust | |||||
| Colour (10) | 8.70 ± 0.32a | 8.10 ± 0.25b | 7.50 ± 0.31c | 6.50 ± 0.65d | 5.10 ± 0.36e |
| Shape (20) | 18.00 ± 0.26a | 17.00 ± 0.44b | 13.40 ± 0.32 c | 11.60 ± 0.42d | 9.80 ± 0.24e |
| Crumb | |||||
| Colour (15) | 14.60 ± 0.26a | 12.40 ± 0.32b | 11.10 ± 0.05c | 9.60 ± 0.32d | 8.10 ± 0.32e |
| Grain (20) | 18.10 ± 0.52a | 16.30 ± 0.05b | 13.20 ± 0.41c | 12.60 ± 0.37d | 7.90 ± 0.54e |
| Mouthfeel (20) | 18.10 ± 1.35a | 15.50 ± 0.82b | 14.30 ± 0.52c | 12.20 ± 1.83d | 11.00 ± 1.93e |
| Taste (15) | 13.90 ± 0.06a | 12.40 ± 0.42b | 11.80 ± 0.25c | 10.80 ± 0.25d | 8.70 ± 0.56e |
| Overall quality (100) | 91.40 ± 1.90a | 81.70 ± 1.01b | 71.30 ± 1.00c | 63.30 ± 1.40 d | 50.60 ± 1.80e |
C, control wheat flour; B1, B2, B3 and B4, blends of 5%, 10%, 15%, 20%, respectively with QFC.
Values in the row with the same letter in superscript are not significantly different from each other (P ≤ 0.05).
Effect of additives on bread qualities
The breads quality was further enhanced through the incorporation of additives, resulting in increased volumes for B1 from 500 to 630, B2 from 400 to 550 and B3 from 360 to 495 mL presented in Table 4. The specific volume also improved from 2.66 to 3.34 for B3 (15% blend) bread, accompanied by enhanced sensory parameters. The crust and crumb colour saw improvements after the addition of additives. The combination of gluten powder, SSL (sodium stearoyl lactylate) and fungal alpha-amylase (FAA) had a positive impact on the bread-making properties of QFC-enriched bread. The synergistic effect of these three additives significantly benefited the quality of fibre-enriched bread. Gluten powder was added to compensate for the lower gluten content in the blend, helping restore the viscoelasticity of the dough and improve the shape, volume and texture of the bread. SSL, as an emulsifier, contributed to both dough strengthening and crumb softening. Its action during fermentation, mechanical handling and proofing resulted in higher volume and improved crumb structure. The mechanism is not entirely clear, but one explanation is that dough strengtheners, like SSL, can create liquid films with a lamellar structure between gluten and starch strands. This enhances gluten's ability to form a film that effectively traps the gas produced by yeast (Stampfli & Nersten, 1995). The addition of FAA played a significant role in improving crust and crumb colour and flavour. FAA increased starch hydrolysis, leading to higher fermentable sugar in the dough. This enhanced the fermentation process and the formation of Maillard reaction in products, intensifying the flavour and crust colour of the bread (Sanz-Penella et al., 2014). The overall result was a significantly enhancement in the quality attributes of the bread with the incorporation of these additives. The enhancement of fibre-enriched bread has been noted through the incorporation of fungal alpha-amylase, dry gluten powder and SSL. The combination of these additives has been shown to yield a synergistic effect, leading to an overall improvement in bread quality (Indrani et al., 2015; Sakhare & Prabhasankar, 2017).
Effect of common additives on the physical properties of breads
| Sample | Volume (mL) | Specific volume (g mL−1) | Texture (g) | Crust colour (L* value) | Crumb colour (L* value) |
|---|---|---|---|---|---|
| C | 575.00 ± 1.00b | 4.14 ± 0.10b | 997.00 ± 5.80d | 32.07 ± 0.05b | 65.54 ± 0.14a |
| B1 | 500.00 ± 4.00d | 3.57 ± 0.05d | 1504.00 ± 7.50c | 31.48 ± 0.15c | 58.55 ± 0.03c |
| B1 + CA | 630.00 ± 2.00a | 4.24 ± 0.02a | 459.00 ± 9.00g | 32.89 ± 0.07a | 58.83 ± 0.04b |
| B2 | 400.00 ± 2.00f | 2.96 ± 0.12f | 1720.00 ± 6.00b | 30.49 ± 0.20d | 54.41 ± 0.31e |
| B2 + CA | 550.00 ± 1.00c | 3.8 ± 0.10c | 803.00 ± 4.560e | 31.27 ± 0.30c | 55.13 ± 0.01d |
| B3 | 360.00 ± 2.00g | 2.66 ± 0.20g | 2800.00 ± 8.00a | 25.88 ± 0.90f | 50.17 ± 0.10g |
| B3 + CA | 495.00 ± 3.00e | 3.34 ± 0.04e | 733.00 ± 5.00f | 27.08 ± 0.50e | 52.81 ± 0.30f |
Values are means of three replicates ± standard deviation.
Values in the column with the same letter in superscript are not significantly different from each other (P ≤ 0.05).
L = lightness/darkness, ±a: red/green, ±b: yellow/blue.
C, control wheat flour; B1, B2, B3, blends of 5%, 10%, 15%, respectively with QFC; CA: Common additives.
Conclusion
In present study, the roller-milled fibre-rich component of quinoa was explored as a dietary fibre source, and its influence on bread-making properties was investigated. The results indicate that QFC contained good amount of dietary fibre along with other nutrients such as protein, fat and ash content. QFC has a significant impact on both rheological and bread-making properties. The incorporation of QFC modified the rheological properties of the dough, leading to an increase in farinograph water absorption and a notable decrease in viscosity parameters. While QFC proves to be a promising source of fibre for developing high-fibre bread, the study suggests that QFC incorporation up to 15% is accepted by sensory score, and exceeding this amount is unfavourable in terms of sensory qualities. To address this limitation, additives such as gluten powder, sodium stearoyl lactylate (SSL) and fungal alpha-amylase (FAA) were explored, resulting in a significant improvement in the quality parameters of the bread. The combination of these additives effectively restored the bread making properties of the blends. The study concludes that QFC is a novel ingredient for the development of high-fibre bread, and the process could potentially be scaled up in food manufacturing units. This research contributes valuable insights into utilising quinoa-derived fibre for enhancing the nutritional profile of bread while maintaining acceptable sensory attributes.
Author contributions
T. V. Sreechithra: Investigation; formal analysis; writing – original draft. Amrita Ray: Writing – original draft; methodology; investigation. Suresh D. Sakhare: Conceptualization; writing – review and editing; supervision.
Conflict of interest statement
The authors declare that the research was conducted in the absence of any commercial or financial relationships that could be constructed as a potential conflict of interest.
Peer review
The peer review history for this article is available at https://www.webofscience.com/api/gateway/wos/peer-review/10.1111/ijfs.17387.
Data availability statement
The data that support the findings of this study are available from the corresponding author upon reasonable request.
References
When examining the impact of a fiber-rich fraction of quinoa on bread-making quality, it is essential to compare its characteristics with those identified in prior research on fiber-rich fractions from other grains. Hence, the present article serves as a reference in this study.
This review article described various nutritional trait of dietary fiber. It gave us better understanding of about the importance and health benefits of dietary fibre in the human diet.
This article explores the effects of substituting whole quinoa flour on the quality characteristics of wheat flour. Therefore, it serves as a suitable comparative analysis, highlighting how the current study on the fiber-rich component differs from those using whole quinoa flour as the fiber source.
The article provided a detailed description of the dry fractionation process used to produce a fiber-rich fraction from quinoa. In the present study, this method was employed to create a fiber-rich component from quinoa, which was subsequently used to develop bread.
Author notes
First Author.
