


Abstract
The acid heating extraction process is commonly employed to extract pectin from citrus peels, which results in the leaching of bioactive constituents into solvents. However, the discharge of these solvents represents a significant loss of valuable resources. To address this issue, this study aims to identify the composition and concentration of the bioactive constituents that escape into the solvents and propose an extraction process based on an ethanol-salt aqueous two-phase system (ATPS). The well-designed ATPS enables the enrichment and recovery of the bioactive constituents, and the findings demonstrate that the ethanol/sodium citrate-based ATPS can recover up to 80.61% of limonoids, 84.11% of flavonoids, and 88.09% of polyphenols that escape at an enrichment efficiency of 50.00%. Moreover, HPLC-DAD and UPLC-HRMS analysis of the ATPS extracts revealed the presence of nine bioactive constituents, including flavonoids, phenolic acids, and limonoids. Remarkably, in vitro antioxidant capacity studies indicate that the ATPS extracts exhibit superior antioxidant activity compared to the vacuum-concentrated solution. Thus, these results suggest that the application of ATPS extraction is a feasible and promising strategy for the recovery of bioactive constituents.
Introduction
Citrus, an extensively cultivated crop worldwide, annually produces over 124 million tons (Rashid et al., 2013), serving as a prominent raw material for industrial processing, which utilises approximately 18% of its output (Suri et al., 2022). The majority of commercial pectin is derived from citrus peels, accounting for approximately 85% of its production (Berk, 2016). Due to its exceptional dispersion and stability, gelation, thickening, emulsification, and other properties, citrus pectin serves as a commonly used food additive, widely employed in the production of various food products such as jelly, fruit juice, soft drinks, candy, dairy products, and jam (Foti et al., 2021). By 2026, the market demand for pectin is expected to reach about 103 990 tons. However, the industrial extraction of pectin results in significant amounts of wastewater, which poses a severe environmental burden (Liew et al., 2019).
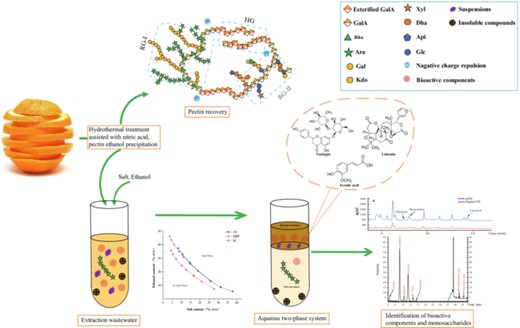
Citrus peels are a rich source of bioactive compounds, including polyphenols, flavonoids, and limonoids (Liu et al., 2021), as well as pectin, which have been the subject of extensive scientific research due to their remarkable health-promoting properties, including antioxidant (Czech et al., 2021), anti-inflammatory (Pan et al., 2010), anti-cancer (Yang et al., 2017), anti-obesity (Zhang et al., 2021), and so on. Citrus peels are subjected to a heating extraction process with acid, followed by alcoholic precipitation, during which the bioactive constituents present in the peels are released into the solvents. By concentrating the bioactive constituents that escape into the solvents, it is possible to circumvent the limitations of direct extraction methods (Wang et al., 2023), such as high cost, low yield, lengthy preparation cycles, and the use of toxic reagents. Furthermore, this method can help mitigate the environmental impact of sewage discharge and increase the value of the pectin industry.
Aqueous two-phase systems (ATPS) are highly effective for the extraction of bioactive compounds and the recovery of value-added products. These systems can be created using various combinations of substances, such as polymer–polymer (Chen & Lee, 1995), polymer–salt (Marić et al., 2021), ethanol–salt (Ooi et al., 2009), among others. Advantages of ATPS include environmental sustainability, ease of amplification, operator simplicity, and targeted selection etc. Polymer-based ATPS possess low ionic strength and are well-suited for the extraction of biomolecules sensitive to the ionic environment (Iqbal et al., 2016), but are associated with high costs, viscosity, and challenges related to recovery and recycling. Ethanol/salt-based ATPS have emerged as a cost effective and easy-to-recycle alternative to polymer-based ATPS, with recent research highlighting their potential for various applications, such as the recovery of value-added products from wastewater and the extraction of bioactive compounds from natural sources (Raja & Murty, 2013). For instance, salt/ethanol-based ATPS have been shown to be effective in extracting bioactive components from haskap leaves, with the majority of bioactive components being ethanolophilic, making ethanol/salt-based ATPS a promising method for their extraction, while eliminating the need for polymers helps to reduce costs for industrial applications (Chong et al., 2020).
In this paper, the pectin extraction solvents from Mexican citrus peels were used as the sample. (i) The composition and content of bioactive constituents escaping are determined in detail. (ii) The bioactive constituents escaping were enriched by ATPS, and the conditions of ATPS were optimised, which greatly improved the phase separation ability and extraction effect. (iii) An excellent antioxidant effect is demonstrated by the enrichment products of the top phase of ethanol/salt-based ATPS. (iv) The bioactive constituents of the top phase were identified by HPLC and HRMS. Ethanol/salt-based ATPS have excellent selectivity. Overall, the study provides a sustainable and efficient treatment method for the solvents generated during the pectin extraction process, which can serve as a benchmark for other wastewater recycling processes.
Materials and methods
Materials
Pectin extraction solvents were kindly provided by Guangzhou Lemon Biotechnology Ltd. (Guangzhou, China). Standards for limonin (purity ≥99 wt%), hesperidin (purity ≥99 wt%), and naringin (purity ≥99 wt%) were provided by Sigma-Aldrich (Shanghai, China). Monosaccharide standards (fucose [Fuc], arabinose [Ara], galactose [Gal], glucose [Glu], xylose [Xyl], mannose [Man], galacturonic acid [Gal-UA], and glucuronic acid [Glu-UA]) were also acquired from Sigma-Aldrich. HPLC grade acetonitrile, trifluoroacetic acid, methanol, and phosphoric acid, used in the chromatographic analysis, were from Sigma-Aldrich. All other chemicals used were of analytical grade.
Preparation of sample solution
After freezing and vacuum drying 100 g of solvents to a constant weight, 50 mg of the resulting lyophilized sample was dissolved in 50 mL of 50% ethanol. The solution was analysed to determine the composition and content of each substance, which were then converted to total content.
Determination of composition and content of bioactive constituents escaping
Total sugar content
To determine the total sugar content of the sample, the sulfuric acid-phenol reagent method was used with minor modifications based on the method of Kaprasob et al. (2018). One millilitre of the sample solution was mixed with 6% phenol (0.5 mL) and concentrated sulfuric acid (2.5 mL), and the resulting mixture was stirred and cooled for 30 min at room temperature. The absorbance was measured at 490 nm, with dextran serving as the standard.
Monosaccharide composition
Monosaccharide compositions of bioactive constituents escaping were determined, based on the method of Salvador et al. (2000) with slight modifications. Take 5 mg of the frozen-dry sample in a centrifugal tube and hydrolyze it using 10 mL of trifluoroacetic acid (2 m; 121 °C for 2 h). Trifluoroacetic acid was blown dry with nitrogen. The dried samples were washed-blow dried using methanol and repeated 2–3 times. Finally, the residue was redissolved with deionised water and determined by filtration through a 0.22 μm microporous filter membrane. Monosaccharide composition of bioactive constituents escaping was analysed by high-performance anion-exchange chromatography (HPAEC) (ICS5000, ThermoFisher, Waltham, MA, USA) with a Dionex CarboPac PA-20 anion-exchange column (3 × 150 mm). Flow rate of eluent (A: 0.1 m NaOH, B: 0.2 m NaAc), gradient program: 95:5 V/V at 0 min, 80:20 V/V at 30 min, 60:40 V/V at 30.1 min, 60:40 V/V at 45 min, 95:5 V/V at 45.1 min, 95:5 V/V at 60 min. Different concentrations (0.01–5 mg L−1) of monosaccharide mixtures (Fuc, Rha, Ara, Gal, Glu, Xyl, Man, Gal-UA, and Glu-UA) were employed as standards.
Protein content
The Kjeldahl method was utilised to determine the total protein content. A nitrogen conversion factor of 6.25, as suggested by Mallek-Ayadi et al. (Mallek-Ayadi et al., 2017), was applied to calculate the protein amount.
Total polyphenolics content
The classical Folin–Ciocalteu assay, as described by Amarowicz et al. (2004) with minor modifications, was employed to determine the total polyphenolic content in solvents. Specifically, 0.5 mL of the sample solution was mixed with 2.5 mL of 10% Folin reagent, followed by the addition of 2 mL of 7.5% Na2CO3 solution. The resulting mixture was shaken for 5 min and kept at room temperature for 30 min. The absorbance values were measured at 765 nm using gallic acid as the standard.
Total flavonoids content
The determination of total flavonoid content in solvents was carried out using the aluminium chloride method, with slight modifications adapted from Assefa et al. (2016). In brief, 0.5 mL of the sample solution was mixed with 2 mL of 30% ethanol and 2 mL of 1% AlCl3 solution, and the volume was made up to 5 mL with 30% ethanol. The resulting mixture was shaken vigorously and left to stand for 10 min to allow for complete reaction between the flavonoids and aluminium chloride. The absorbance of the solution was measured at a wavelength of 420 nm using a spectrophotometer, with hesperidin employed as the standard. The amount of total flavonoids present in the sample solution was then determined based on the absorbance value obtained and expressed as hesperidin equivalent units.
Total limonoids content
The determination of total limonoid content in solvents was carried out using the Ehrlich reagent, based on a modified version of the method developed by Breksa & Ibarra (2007). A 1 mL aliquot of the sample was mixed with 4 mL of anhydrous ethanol and 5 mL of Ehrlich reagent, and the resulting mixture was vigorously shaken and allowed to react for 1 h. The absorbance of the solution was then measured at a wavelength of 493 nm using a spectrophotometer, with anhydrous ethanol serving as the blank. Limonin was utilised as the standard for quantification purposes, and the amount of total limonoids present in the sample solution was calculated based on the absorbance value obtained. The results were expressed as limonin equivalent units per gram of sample.
Ash content
The total ash content in solvents was quantified using a method with slight modifications based on Gomez-Garcia et al. (2021) with slight modification. First, the freeze-dried sample (1 g) was incinerated at 550 °C for 24 h in a muffle furnace until complete ashing and constant weight were obtained. The percentage of total ash present in the sample was then calculated based on the weight of the residue.
Optimization of ATPS in terms of bioactive constituents' partition
Phase diagrams
The formation of ATPS depends on the material composition (w/w), which can be described using a phase diagram. The phase diagram was constructed at room temperature (25 °C) by employing the turbidity titration method described in the literature, with minor modifications inspired by the work of Nemati-Knade et al. (2012). To construct the phase diagram, a predetermined mass fraction of the salt solution is introduced into a 15 mL centrifuge tube. Anhydrous ethanol is then slowly added to the solution until it reaches a state of cloudiness, at which point it separates into two distinct phases. Precise measurements of the mass fractions of both ethanol and salt are recorded, and deionised water is added to clarify the mixture. This procedure is repeated several times to obtain a sufficient amount of data for generating the phase diagram.
Optimization of ATPS conditions
The extraction capacity of ethanol-salt ATPS was evaluated based on literature summary (Wang et al., 2022). Ethanol, being inherently present in solvents, was chosen as a phase-forming agent for ATPS, as it can reduce unnecessary processes and costs. Additionally, ethanol is almost non-toxic, has a moderate boiling point, and is more suitable for large-scale industrial production. Three different types of salts were eventually established, namely, ammonium sulfate (AS), sodium citrate (SC), and dipotassium hydrogen phosphate (DHP), and their optimization studies were conducted. The relevant factors affecting the separation efficiency, including ethanol and salt concentrations, temperature, and pH, were also investigated. The content of each component was accurately weighed to prepare the corresponding ATPS. The pH was adjusted using 1 m sulfuric acid and sodium hydroxide solutions.
Building on the findings of Marić et al. (2021), two parameters, namely recovery (RE) and enrichment efficiency (EE) of bioactive constituents (polyphenols, flavonoids, and limonoids), were utilised to assess the extraction performance of the ATPS.
where Ct was the equilibrium total concentrations of three bioactive constituents in the top phase, Vt were the equilibrium total volumes of three bioactive constituents in the top. Cs is the total concentration of solvents, and Vs is the total volume of solvents.
Characterisation of bioactive constituents escaping by RP-HPLC-DAD and UPLC-ESI-MS/MS
RP-HPLC conditions
The HPLC conditions were based on the method of Wei et al. (2015) with some modifications. Chromatograph: Agilent 1260 HPLC, column: Agilent Eclipse XDB C18 (4.6 × 250 mm, 5 μm). The column temperature was kept at 30 °C and the injection volume was 10 μL. The mobile phase consisted of a binary solvents system using 0.1% phosphate water (solvents A) and 100% acetonitrile (solvents B), kept at a flow rate of 1 mL min−1. The gradient program started with 77% eluent A and 23% eluent B, which was maintained for 5 min. And eluent B was ramped linearly to 55% at 10 min and the percentage (55% eluent B) was maintained for 15 min. Initial conditions were reached in 5 min, so the total run time was 30 min. Detection and quantification were performed at 285 and 210 nm. Hesperidin, naringin and limonin (3 μg mL−1) were used as external standard.
UPLC-HRMS conditions
The bioactive constituents were identified with UPLC (Agilent, Santa Clara, CA, USA), coupled with an ultra-high-definition accurate mass spectrometer. Separation of bioactive constituents was achieved on a UPLC column (Agilent C18, 2.1 mm × 100 mm, 1.8 μm) at 40 °C and flow rate of 4.0 mL min−1. The injection volume was 1 μL. The mobile phase consisted of a binary solvents system using deionised water (solvents A) and 100% acetonitrile (solvents B). The gradient program is the same as HPLC. Mass spectrometry conditions are as follows: ion source with ESI, negative ion mode, ion source gas at 350 °C, dry gas flow rate of 9 L min−1, atomization gas pressure: 45 psi, capillary voltage: 3500 V, crushing voltage: 150 V, mass number scan range: 50–1000 m/z.
Antioxidant activity
DPPH radical scavenging assay
A modified version of the method described by Wang et al. (2014) was used to determine the DPPH radical scavenging ability. Specifically, 100 μL of the sample solution and 100 μL of 0.3 mm DPPH solution were added to a 96-well plate and thoroughly mixed. The absorbance values (AS) were then measured at 517 nm after allowing the mixture to sit undisturbed at room temperature in the dark for 30 min.
where As was the absorbance of the tested sample group; Ab was the absorbance of the blank group (without DPPH); and Ac was the absorbance of the control group (without sample).
ABTS radical scavenging assay
The ABTS radical scavenging ability was determined using a modified method based on Gawlik-Dziki et al. (2016). In this method, 100 μL of the sample solution was mixed with 100 μL of ABTS+ solution, which was prepared by dissolving 200 mg of ABTS and 0.0344 g of potassium persulfate in 50 mL of deionised water 24 h prior to the experiment and protected from light. The mixture was incubated in a 96-well plate at room temperature in the dark for 30 min, and the absorbance values (AS) were measured at 734 nm using a spectrophotometer.
where As was the absorbance of the tested sample group; Ab was the absorbance of the blank group (without ABTS); and Ac was the absorbance of the control group (without sample).
Statistical analysis
All experiments were performed in triplicate unless stated and reported measurements represent the mean from three calculated values and standard deviations. Data was analysed using analysis of variance (Chong et al., 2020) and Tukey's test (performed using SPSS 17.0 for Windows,developed by IBM corportation, headquartered in Armonk, New York, USA) under differences were considered at p< 0.05.
Results and discussion
Composition analysis of solvents
The quantification of solids in a solution at 1.80 ± 0.27% of the total weight of 100 g of solvents indicates a relatively high proportion of physiologically bioactive constituents. Table 1 displays the composition and respective proportions of the identified solids, supporting the potential for valuable applications. The content of polyphenols accounted for 16.05 ± 0.12% (standard curve equation by y = 6.3233x + 0.002 R2 = 0.9995), the total flavonoids accounted for 6.43 ± 0.03% (y = 0.0151x + 0.0044 R2 = 0.9997), and the total limonoids contributed 2.27 ± 0.15% (standard curve equation by y = 5.6707x − 0.0276 R2 = 0.9962). The phenolic compounds in citrus peels mainly include phenolic acids (mainly caffeic acid, p-coumaric acid, ferulic acid, and erucic acid), flavanones (usually naringin and hesperidin), and polymethoxyflavonoids (mainly neem and orange peel). These bioactive compounds exhibit a broad range of biological activities, making them promising candidates for various applications in pharmaceuticals, nutraceuticals, and functional foods (Singh et al., 2020). Casquete et al. (2015) extracted polyphenols from lemon peel and orange peel by the pressure treatments and obtained 222.67 mg/100 g, and 284.19 mg/100 g, respectively. If over 80% of the polyphenolic compounds in solvents can be enriched, it would not only avoid the drawbacks (high cost, low yield, lengthy preparation cycles, and the use of toxic reagents, etc.) of traditional extraction methods but also contribute to environmental improvement and economic benefits.
The content and proportion of each material component in the solid (1.80 g solids was obtained from 100 g solvents)
| Percentage (%) | Mass (mg) | |
|---|---|---|
| Ingredient | ||
| Protein | 5.16 ± 0.03 | 92.81 ± 0.01a |
| Saccharides | 18.16 ± 0.60 | 326.81 ± 10.87b |
| Polyphenols | 16.05 ± 0.12 | 288.93 ± 2.19c |
| Flavonoids | 6.43 ± 0.03 | 115.82 ± 0.48d |
| Limonoids | 2.27 ± 0.15 | 40.85 ± 2.71e |
| Ash | 14.33 ± 0.01 | 257.94 ± 0.19f |
| The proportion of monosaccharide composition | ||
| Fuc (%) | 0.47 ± 0.07f | |
| Arb (%) | 60.72 ± 0.37a | |
| Gal (%) | 4.63 ± 0.16c | |
| Glu (%) | 29.19 ± 0.12b | |
| Xyl (%) | 0.72 ± 0.03f | |
| Man (%) | 1.35 ± 0.12e | |
| Gal-UA (%) | 2.46 ± 0.08d | |
| Glu-UA (%) | 0.46 ± 0.03f | |
Data are presented as means ± SD of triplicate samples, and values with different letters are significantly different at P < 0.05.
The freeze-dried sample contained an ash content of 14.33 ± 0.01%. However, the measured amount of matter was found to be less than the total amount of matter, possibly due to the conversion of nitrate (which was derived from nitric acid extraction of pectin) to NO2, leading to its escape during the ash measurement and resulting in a lower measured ash content.
Table 1 shows that the polysaccharide content accounted for 18.16 ± 0.60% (standard curve equation y = 0.0367x − 0.0135 R2 = 0.9954). To gain further insight into the polysaccharide, the monosaccharide composition (Fig. 1) and proportion (Table. 1) of bioactive constituents escaping were obtained by HPAEC. The main monosaccharide is arabinose, accounting for 60.72% ± 0.37%, followed by glucose at 29.19% ± 0.12%, galactose at 4.63% ± 0.16%, and galacturonic acid at 2.46% ± 0.08%. It is worth noting that heating extraction with acid could disrupt the structure of pectin (Wandee et al., 2019), resulting in large molecules of pectin being subsequently precipitated by ethanol, leaving only small molecules of pectin that cannot be precipitated.
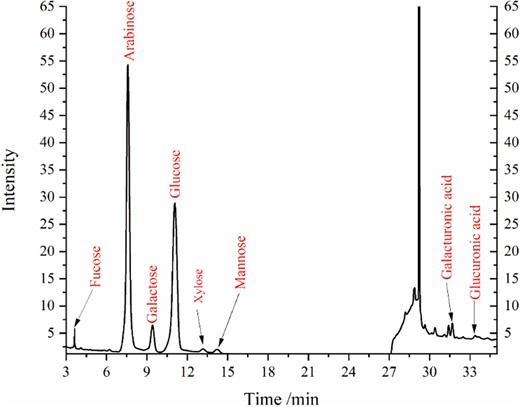
Chromatogram of monosaccharides in solvents.
Natural citrus pectin consists of three structural domains, homogalacturonan (HG), rhamnogalacturonan I (RG-I), and rhamnogalacturonan II (RG-II), with the RG-I region being highly branched and known as the “hair region” (Liang et al., 2022). It is estimated that 20–80% of the rhamnose residues in the RG-I region are replaced by neutral sugar side chains, including galactan, arabinogalactan, and arabinogalactan, which are likely the most abundant side chains, and a small amount of xylogalacturonan may also be present (Voragen et al., 2009). The abundant presence of arabinose suggests that the analysed polysaccharides are likely small molecules of pectin originating from neutral sugar side chains in the RG-I region, while glucose is likely derived from fibre and pectin in citrus. Previous studies have demonstrated that pectin enriched in RG-I structure possesses stronger anticancer, cardiovascular disease prevention, and fibrosis prevention properties (Zhang et al., 2018). Therefore, the polysaccharides containing bioactive constituents that have escaped are of considerable value for exploitation.
Screening of salts
The phase diagram in Fig. 2a illustrates the ATPS formation between ethanol and three salts: ammonium sulfate (AS), sodium citrate (SC), and dipotassium hydrogen phosphate (DHP). The biphasic region is located above the binodal curves, whereas the region below is not able to form two phases. The selection of mass fraction of ethanol and salt is critical to ensure ATPS formation. Furthermore, the binodal curves enable the comparison of phase formation ability among different salts. A salt with a binodal curve closer to the origin of the coordinates possesses a stronger ability to induce ATPS formation. According to Fig. 2a, the order of the salts' ATPS formation ability is DHP, SC, and AS, respectively.
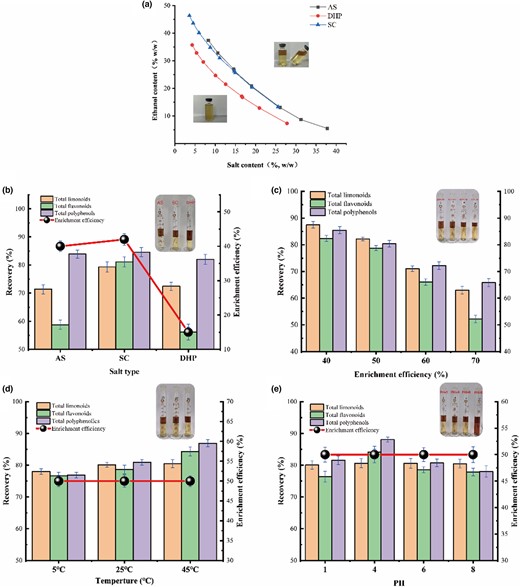
(a) Ternary phase diagrams composed of ethanol/salts-based ATPS. (Insert: The upper part of the curves is split phases and the lower part is unable to form split phases.) Effect of salt types (b), salt and ethanol concentration (c), temperature (d), pH (e) on the recovery of bioactive constituents escaping. (Insert: experimental phenomena under different conditions).
The objective was to compare the extraction performance of three types of salts constructed with ethanol for ATPS, with the same mass fraction of ethanol and salt (19.5% wt ethanol + 23% wt salt). All bioactive constituents were found to migrate towards the ethanol-rich phase, as illustrated in Fig. 2b. The results indicated that the enrichment efficiency of SC (EE = 65.48%) and AS (EE = 63.64%) was approximately the same, and both were much higher than that of DHP (EE = 49.1%). It was evident from the solubility that DHP had much lower solubility compared to the first two salts, which may indicate that it is much less absorbent than the other two salts.
The recoveries of the three salts for polyphenols were about the same (RESC 83.90% > REAS 83.90% > REDHP 82.05%), and SC was slightly more efficient than AS and DPH (RESC 79.32% > REDHP 72.45% > REAS 71.36%) for limonoids. However, for the recovery of flavonoids (RESC 81.14% > REAS 58.77% > REDHP 56.19%), SC has obvious superiority. The study indicates that SC outperforms the other two salts in terms of extraction efficiency. Notably, SC is also a biodegradable and non-toxic salt, but the discharge of wastewater containing AS and DHP can lead to the growth of aquatic plants, which can have adverse effects on aquatic organisms.
Compared to AS and DHP, SC was found to have a significantly higher extraction performance, making it the optimal choice for ATPS extraction. In addition to its excellent performance, SC is a biodegradable and nontoxic salt, making it an environmentally friendly option. Conversely, the discharge of wastewater containing AS and DHP can have detrimental effects on aquatic organisms by promoting the growth of aquatic plants. Furthermore, DHP is an alkaline salt that has been demonstrated to damage the structure of anthocyanins in previous studies, posing a risk to the quality of bioactive compounds extracted from ATPS (Ran et al., 2019). As evidenced by Fig. 2b, ATPS-containing DHP has a darker colour, while the colour of ATPS containing SC remains largely unchanged, reflecting the weak alkalinity of SC that has minimal impact on the system's pH. Overall, SC is the recommended choice for ATPS extraction due to its superior extraction performance, environmentally friendly profile, and minimal impact on the quality of bioactive compounds.
The effect of mass fraction of salt and ethanol
A significant salting-out effect is an important characteristic of SC. The higher the enrichment efficiency, the lower the degree of cross-contamination, the ethanol-rich phase contains a very small amount of SC (removed by low temperature), while the salt-rich phase contains only water + salt. Enrichment efficiency (40%, 50%, 60%, 70%) was controlled by varying the salt (23.0, 23.4, 23.8, 24.1 wt%) and ethanol concentrations (19.5, 18.1, 16.6, 15.7 wt%). As demonstrated in Fig. 2c, the recoveries of limonoids (RELim 87.47% > RELim 82.23% > RELim 71.02% > RELim 62.93%), flavonoids (REFla 82.38% > REFla 78.76% > REFla 65.98% > REFla 52.18%), and polyphenols (REPol 85.47% > REPol 80.44% > REPol 72.19% > REPol 65.84%) were decreasing with the increasing enrichment efficiency.
Microscopically, the “ion-dipole” interaction between salt ions and water molecules leads to ionic hydration, which in turn leads to the dissolution of the salts in the bottom phase (Cheng et al., 2016). However, as the salt concentration increases and ethanol concentration decreases, the migration of free water from the ethanol phase to the salt phase leads to a reduction in the concentration of free water in the ethanol phase. This decrease in free water concentration may impede the solubility of hydrophilic bioactive compounds, thereby affecting their recovery. Notably, as demonstrated in Fig. 2c, the increase in enrichment efficiency from 50% to 60% is accompanied by a significant reduction in the recovery of bioactive constituents. Consequently, the optimum concentration for maximum recovery is set at 50% (23.4% salt + 18.1% ethanol wt), although higher concentrations can be used to achieve higher enrichment efficiencies.
The effect of temperature
The influence of temperature (5 °C, 25 °C, and 45 °C) on RE and EE values of limonoids, flavonoids, and polyphenols were shown in Fig. 2d. The recoveries of limonoids (RE45 °C 80.48% > RE25 °C 80.12% > RE5 °C 78.02%), flavonoids (RE45 °C 84.30% > RE25 °C 78.69% > RE5 °C 76.63%), and polyphenols (RE45 °C86.92% > RE25 °C 80.92% > RE5 °C 76.91%) exhibit a slight increase with rising temperature. Nevertheless, the enrichment efficiency remains unchanged (EE = 50%) at all tested temperatures.
While temperature plays a crucial role in the thermodynamic equilibrium of ATPS and can enhance the migration rate of molecules, it also has both advantages and disadvantages when it comes to the extraction of bioactive constituents. On one hand, a higher temperature can promote the migration of active constituents and thus improve their recovery. On the other hand, it can also cause the destabilisation and degradation of certain polyphenols, such as anthocyanins. Additionally, elevated temperatures may cause the evaporation of solvents such as ethanol and water, which is highly undesirable, especially in closed experimental environments where solvent loss can result in decreased extraction performance. Furthermore, high-temperature extraction processes often require significant additional energy consumption, making them less sustainable. As such, a more optimal temperature for extraction would be at room temperature, typically around 25 °C.
The effect of pH
The effect of pH on the recovery and enrichment efficiency in the range of 1–8 was also tested. The result was shown in Fig. 2e, from which we can know the recoveries of limonoids (REpH = 1 80.05%, REpH = 4 80.61%, REpH = 6 80.60%, REpH = 8 80.50%) flavonoids (REpH = 1 76.44%, REpH = 4 84.11, REpH = 6 78.56%, REpH = 8 77.87%), and polyphenols (REpH = 1 81.58%, REpH = 4 88.08%, REpH = 6 80.74%, REpH = 8 78.01%) increased and then decreased with the increase of pH. As with temperature, pH does not change the enrichment efficiency (EE = 50%).
The pH level plays a crucial role in the partitioning behaviour of solutes in ATPS as it alters the charge form of the solute and affects the electrostatic interaction between the solute and the solvents. Polyphenols and flavonoids, which are primarily weakly acidic compounds, are more influenced by pH, rendering them stable in a weakly acidic environment. The colour of the system becomes significantly darker with the increase of pH, particularly under alkaline conditions, indicating that polyphenols are strongly affected by pH. As pH increases, the phenolic hydroxyl groups dissociate, affecting the partitioning of polyphenols in the ethanol-rich phase. Conversely, limonoids are predominantly neutral, so they are less impacted by pH. The pH level does not alter the relative concentrations of salt and ethanol in ATPS, and consequently, it does not affect the enrichment efficiency.
In summary, ATPS based on ethanol-sodium citrate (23.4 SC + 18.1 ethanol wt%) had the best extraction performance at 25 °C and pH = 4. The recoveries of limonoids, flavonoids, and polyphenols were 80.61%, 84.11%, and 88.09% respectively, and the enrichment efficiency was 50% at this time.
Identification of compounds of bioactive constituents escaping
The bioactive constituents extracted from ATPS and the original solvents were analysed using high-performance liquid chromatography with a diode-array detector (HPLC-DAD). The resulting chromatograms were compared to determine any differences in the bioactive components. As shown in Fig. 3a, the chromatograms of ATPS and the original solvents closely matched, indicating that ATPS selectively enriched and recovered the bioactive constituents with high efficiency.
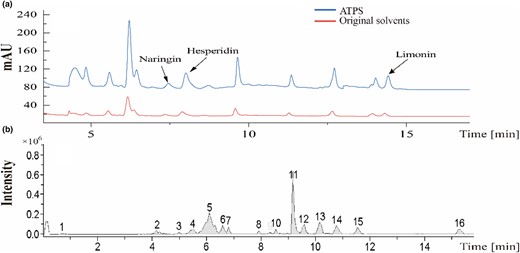
(a) Chromatographic contrast chart of ATPS and original solvents simultaneously obtained by high-performance liquid chromatography, using C18 column at 284 and 210 nm. (b) Chromatogram of ATPS was obtained by UPLC-HRMS using C18.
Figure 3b displays the UPLC-HRMS of ATPS, which is comparable to the HPLC and UPLC-HRMS with minor discrepancies potentially attributed to the HPLC utilising solely two wavelengths (285 nm, 210 nm) and variations in mobile phases and columns.
Sanches et al. (2022) conducted a comprehensive analysis of the chemical composition of three citrus peels, namely lime (Citrus × latifolia), lemon (Citrus limon), and rangpur lime (Citrus × limonia), and identified twenty-four polyphenols and five limonoids. As citrus peels are predominantly composed of polyphenols containing one or more hydroxyl and/or carboxylic acid groups, mass spectrometry data was acquired in negative ionisation mode. Initially, three phenolic acids, four flavonoids, and two limonoids were detected and reported in Table 2. Although the solvents appeared orange-yellow in colour, carotene, which is typically abundant in citrus peels, was not detected. It is possible that the carotene may have been unstable, leading to its degradation and loss of structure.
Bioactive constituents escaping tentatively are identified from enrichment of ATPS by UPLC-HRMS
| Peak no. | R.T. | m/z [M-H]− | Compound | MS/MS2 fragment | Molecular formula |
|---|---|---|---|---|---|
| 1 | 0.72 | 169.0181 | Gallic acid | 125 | C7H5O5 |
| 3 | 5.00 | 287.0565 | Luteolin | 133, 151 | C15H11O6 |
| 5 | 6.13 | 515.1911 | Dicaffeoylquinic acid | 359, 179, 135, 101 | C25H24O12 |
| 6 | 6.61 | 579.2112 | Naringin | 459, 271, 151 | C28H34O15 |
| 7 | 6.81 | 609.0872 | Hesperidin | 465, 303, 153 | C28H34O15 |
| 8 | 7.92 | 513.2112 | Nomilin | 369, 161 | C28H34O9 |
| 10 | 8.55 | 353.2105 | Caffeoylquinic acid | 191, 179 | C16H18O9 |
| 13 | 10.17 | 255.2323 | Isoliquiritigenin | 135, 119, 91 | C15H12O4 |
| 16 | 15.28 | 469.1800 | Limonin | 425, 161 | C26H30O8 |
Antioxidant activity of ATPS
To evaluate the antioxidant activity of extracts of ATPS, the extracts of ATPS were compared with 50% vacuum concentrated solution. (The vacuum concentrated solution (50%) is obtained by using RE5298A rotary evaporator with SHZ-III circulating water bath vacuum pump, and the conditions are 100 rpm, 55 °C water bath temperature and 0.1 MPa vacuum.) The results are shown in Fig. 4. There was a significant dose–response correlation between the bioactive constituents of bioactive constituents escaping and antioxidant ability. The scavenging ability of bioactive constituents escaping was determined with dilution, and the scavenging ability increased with decreasing dilution rate.
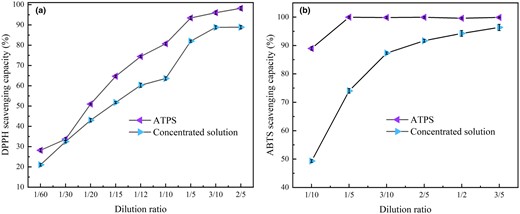
Radical scavenging capacity of extract of ATPS and vacuum concentrated solution. (a) DPPH radical scavenging assay, (b) ABTS + radical scavenging assay. (The extract of ATPS and 50% vacuum concentrated solution were simultaneously diluted to 1/60, 1/30, 1/20, 1/15, 1/12, 1/10, 1/5, 3/10, 2/5, 1/2, 3/5, Data are presented as means ± SD of triplicate samples).
When the DPPH• solution comes in contact with a substance that can provide hydrogen atoms (polyphenols) or another radical (R•), the reduced form DPPH-H (Suri et al., 2022) or DPPH-R (SET) loses its intense purple colour and therefore the absorbance at 515 nm is reduced or lost. The difference between the antioxidant capacity measured by the ABTS method is due to the fact that the ABTS method measures the activity of both hydrophilic and lipophilic compounds (flavonoids; Suárez et al., 2022). Figure 4 shows that the antioxidant capacity of ATPS extracts surpasses that of the vacuum concentrate solution, particularly in terms of ATBS scavenging capacity. This result could be attributed to the extraction of water-insoluble bioactive compounds like hesperidin by ATPS, while the vacuum concentration process may have degraded some of these bioactive ingredients. Therefore, the ATPS extraction method offers significant advantages in extracting bioactive constituents.
Conclusion
In this study, we proposed a novel ethanol/salt-based ATPS extraction method to recover bioactive constituents, namely polyphenols, flavonoids, and limonoids, which are often lost during pectin extraction. Our results demonstrated that ATPS displayed excellent selectivity in the enrichment of escaped bioactive constituents. Specifically, the ethanol-rich phase enriched the bioactive constituents, the insoluble compounds were removed as residues, while the hydrophilic waste was retained in the citrate-rich aqueous phase. Notably, the ethanol/sodium citrate-based ATPS recovered 80.61% of limonoids, 84.11% of flavonoids, and 88.09% of polyphenols at an enrichment efficiency of 50.00%. And compared with conventional vacuum concentration, ATPS showed superior antioxidant activity in scavenging free radicals (DPPH, ABTS) while maintaining the same enrichment efficiency. Therefore, ATPS has enormous potential as a green, efficient, and economical extraction method that solves the problem of industrial wastewater pollution, enhances the added value of the pectin industry, and provides a theoretical basis for the application of waste liquid recovery in other industries.
Acknowledgments
This work was supported by the Industry-University Research Project of Guangdong Province, China (Project approval number: Guangdong Finance Science and Education: [2020]172). We are grateful to Guangzhou Laimeng Biotechnology Co., Ltd., China., the supplier of raw materials, and the colleagues at the protein Center for their assistance in our experimental operations and data processing.
Author contributions
Cheng-wei Ruan: Conceptualization (lead); data curation (lead); formal analysis (lead); investigation (lead); methodology (lead); software (lead); writing – original draft (lead). Wen-Xin Jiang: Data curation (equal); formal analysis (equal); software (equal); validation (equal); visualization (equal); writing – review and editing (equal). Jin-Song Liao: Funding acquisition (equal); resources (equal). Zi-wei Liu: Software (equal); supervision (equal). Ya-ting Song: Software (equal); supervision (equal). Jun-Ru Qi: Conceptualization (equal); investigation (equal); project administration (lead); supervision (lead).
Declaration of competing interest
All authors agreed with the submission, and the authors declared no competing financial interest about this work.
Data availability statement
Research data are not shared.
