


Abstract
Pomegranate peel, a biological waste, is of great interest due to its higher gallic acid, catechin and quercetin contents and their therapeutic action. The current research focuses on the evaluation of pomegranate peel extracts of two cultivars, Badana and Kandhari. Polyphenols from various concentrations of ethanol were extracted and analysed by modern techniques. Results indicated that the extract of Badana showed the highest phenolics (667.14 ± 7.48 mg GAE/g), flavonoids (151.54 ± 2.01 mg CE/g), antioxidant activity by DPPH (87.77% ± 0.16% inhibition) and FRAP (70.54 ± 0.25 mmol/100 g). Also, the 70% hydroalcoholic Kandhari extract exhibited the highest flavonoids in comparison to 50% and 100% extracts. Fourier Transform Infrared spectroscopy spectra indicated numerous functional groups such as alkyl halides, alcohols, polyphenols, alkenes, carbonyl and carboxylic acid. The HPLC chromatogram revealed the presence of gallic acid, quercetin, ferulic acid, benzoic acid, caffeic acid, cinnamic acid, vanillic acid, syringic acid and sinapic acid with the highest concentration of gallic acid in Badana extract. So, here we concluded that 70% hydroethanolic Badana extract is an excellent source of bioactive components and can further be utilised for value addition and curative attributes.
Introduction
Agro-industrial waste has become one of the major challenging aspects worldwide because of the production of huge quantities of fruit waste such as peels, seeds and bagasse (Waheed et al., 2019; Arshad et al., 2021; Hassan et al., 2022). Pomegranate, fruit from the family Punicaceae is known scientifically as Punica granatum. Its origin is Iran, and now widely found in the entire Mediterranean, South-Western America Mediterranean, South-Western America, India, Pakistan, China and Afghanistan. The morphological diversity of Pakistan reveals 62 cultivated and 53 wild genotypes of pomegranates but their productivity is very low (Nafees et al., 2017). The different parts of pomegranate as peel, seed, juice, root, leaves and flower used for the management of hepatotoxicity (Sayed et al., 2022), type 2 diabetes (Thulsidhar et al., 2022), cardiovascular diseases (Michicotl-Meneses et al., 2021), cancer (Wong et al., 2021), obesity (Lei et al., 2007) and oxidative stress (Wei et al., 2022).
The annual production of pomegranate was reported around 3.8 million tons worldwide and despite this massive production about 90% of the peel portion is wasted (Kahramanoglu, 2019). The major portion of peel waste is disposed of in landfills or used as animal feed. However, this peel waste is a countless source of secondary metabolites and among them, polyphenols constitute the main portion. Polyphenolic compounds are of great interest due to their strong antioxidant capacity that has therapeutic potential for the prevention and management of various chronic diseases (Yan et al., 2020). The antioxidant capability of peel is 3- to 5-fold higher than seed, pulp, leaves and flower. Extracts from the peel of pomegranate contain higher quantities of phenolics and flavonoids that scavenge the reactive species of oxygen and nitrogen and protect them from cellular damage. In this way, extracts can be further valorized for therapeutic purposes in the pharmaceutical industry. Peel is also a rich source of polysaccharides that are used as dietary supplements in the treatment of several disorders (Fahmy & Farag, 2022). That is the reason why pomegranate peel was selected in the present study. In the current research, the two varieties of pomegranate (Badana and Kandhari) were selected depending on their climate suitability and commercial availability. Presently, there is very little knowledge about the chemical composition, phytochemical screening and functional group identification of peels of pomegranate varieties. To the best of our knowledge, this work is the first to use Fourier Transform Infrared spectroscopy (FTIR) and high-performance liquid chromatography (HPLC) to comparatively analyse the alcoholic and hydroalcoholic extracts of pomegranate cultivars. The objective of the current study was to investigate and compare the total phenolics, flavonoids, antioxidant capability, proximate composition and various functional groups of 100%, 70% and 50% ethanolic extracts of Badana and Kandhari peels.
Materials and methods
Procurement of raw materials
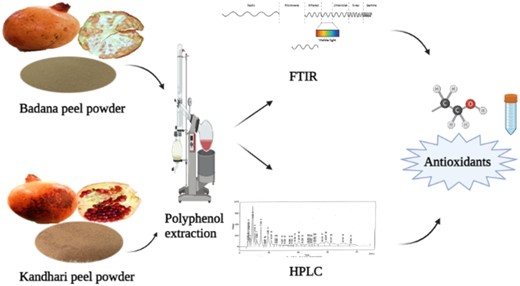
Pomegranate fruit of two varieties (5 kg for each), Badana and Kandhari were procured from the local market of Faisalabad, Pakistan. Peels were separated manually and washed with distilled water to remove any dust particles. Next, the peels were cut into small pieces and placed in a dehydrator (R-5A, Commercial dehydrator systems, Inc., Eugene, OR, USA) at 40 °C for 48 h. The dehydrated peels were ground and sieved through 40 mesh sizes to obtain a fine powder. This powder was packed in airtight polythene bags to avoid humidity and stored at room temperature until further analysis.
Mineral analysis
The mineral contents were determined according to the standard protocols of (AOAC, 2016) by wet digestion. The amounts of phosphorous, magnesium, iron, zinc and copper were estimated by using atomic absorption spectrophotometer (Thermo Scientific iCE 3000 series, Waltham, MA, USA) while sodium and potassium were evaluated by a flame photometer (Model 410, Sherwood, Cambridge, UK).
Preparation of extracts
The different types of alcoholic and hydroalcoholic extracts were prepared according to the protocol of (Ismail et al., 2019). The 15 g of peel powder of Badana and Kandhari were separately macerated with 100 mL of solvent and kept in an orbital shaker (SHO-ID, DaiHan Scientific, Korea) for 6 h at 70 r.p.m./min. The constant stirring helps in the extraction of maximum bioactive compounds. Then, these extracts were concentrated and solvents were recovered in a rotary evaporator (VP-30, LabTech, Inc., Sorisole, Northern Italy) at 40 °C under reduced pressure. The six types of semi-solid extracts were obtained.
Calculation of extract yield
The percentage of extract yield was calculated by the protocol of (Hadjadj et al., 2018) by using the following formula:
where W1 was the amount of dried extract (g) while W2 was the amount of peel powder.
Determination of total phenolic and total flavonoid content
The total phenolics in each extract were assessed according to the method of (Gulsunoglu et al., 2019). Flavonoids in each extract were determined by the aluminium trichloride colorimetric technique according to the procedure of (Ardekani et al., 2011).
Antioxidant activity by DPPH method and ferric reducing antioxidant power (FRAP) assay
The antioxidant activity of extracts was measured by using the DPPH method as elaborated by (Wang et al., 2011) and the FRAP value was determined according to the procedure of (Tabaraki et al., 2012).
FTIR spectroscopy
The FTIR spectrum of ethanolic and hydroethanolic extracts was recorded with Bruker model TENSOR 27 FTIR spectrometer (Borken, Germany) by using OPUS software. The total reflectance is in the range of 400–6000 cm−1 with a KBr beam splitter. The spectra were obtained at room temperature with a DLATGS detector with a maximum resolution of 6 cm−1.
HPLC analysis
The 50 mg of extracts of Badana and Kandhari were dissolved in 24 mL of methanol and homogenised. Then, 16 mL of distilled water was added followed by 10 mL of 6 M hydrochloric acid. The following mixture was thermostated at 95 °C for 2 h. The final solution was filtered through a nylon membrane filter of 0.45 μm (Biotech, Germany) before HPLC analysis (Pak-Dek et al., 2011). The HPLC separation (LC-10AT, Shimadzu, Japan) was achieved by using the Agilent 1290 HPLC system equipped with a pump (LC-10AT) and UV–Visible detector of 280 nm (SPD-10AV, Shimadzu, Japan). An analytical reverse phase C-18 column Shim-pack CLC–ODS with a column length of 25 cm, a width of 4.6 mm and a particle size of 5 μm was used for analysis. A gradient with a mobile phase consisting of water and acetic acid, H2O:acetic acid-94:6, pH 2.27 (HPLC mobile phase ‘A’), and acetonitrile 100% (HPLC mobile phase ‘B’) was chosen for chromatographic separation. The duration for analysis was 1 h and gradient chromatographic condition was applied as follows: 0–15 min = 15% solvent B, 15–30 min = 45% solvent B and 30–45 min = 100% solvent B. The separation was conducted at room temperature with a flow rate of 1 mL/min.
Statistical analysis
All the experiments and analyses were conducted in triplicates. Data were subjected to a one-way analysis of variance (Anova) by using Statistics 8.1 software. Mean values with their standard deviation are presented and mean values were compared with the least significant difference test used for the comparison of treatment means at the level of significance of 0.05 and confidence interval of 95%.
Results and discussion
Mineral composition
The mineral analysis of Badana and Kandhari is shown in Table 1. The values of all macro and micro minerals significantly (P < 0.05) differ from each other. The highest concentration of potassium and magnesium were found in the peels of both the cultivars. Badana exhibits greater amounts of potassium, magnesium, phosphorus and zinc, whereas Kandhari has elevated quantities of sodium, iron and zinc. The lower quantities of zinc and copper were observed.
Mineral composition of pomegranate peel powder
| Mineral content | Badana (mg/100 g) | Kandhari (mg/100 g) |
|---|---|---|
| Na | 34.67 ± 0.1b | 57.27 ± 0.1a |
| K | 185.46 ± 0.3a | 167.92 ± 0.2b |
| Fe | 5.23 ± 0.1b | 7.44 ± 0.1a |
| Mg | 156 ± 0.2a | 144 ± 0.2b |
| P | 5.01 ± 0.1a | 3.52 ± 0.1b |
| Zn | 2.54 ± 0.01a | 1.36 ± 0.01b |
| Mineral content | Badana (mg/100 g) | Kandhari (mg/100 g) |
|---|---|---|
| Na | 34.67 ± 0.1b | 57.27 ± 0.1a |
| K | 185.46 ± 0.3a | 167.92 ± 0.2b |
| Fe | 5.23 ± 0.1b | 7.44 ± 0.1a |
| Mg | 156 ± 0.2a | 144 ± 0.2b |
| P | 5.01 ± 0.1a | 3.52 ± 0.1b |
| Zn | 2.54 ± 0.01a | 1.36 ± 0.01b |
Means that share a similar letter in a row are statistically non-significant (P > 0.05). Means that shared altered letters in a row are statistically significant (P < 0.05).
Badana and Kandhari peels contain a significant concentration of macro and micro minerals which performs physiological functions in the body and can be used for fortification in various value-added products for the mitigation of nutritional deficiencies. The variation in the nutritional profile of both peels may be due to the different cultivars, state of ripeness, soil type, soil condition, climatic conditions, topographic regions and agronomic techniques (Ranjha et al., 2020).
Yield of extract
The total quantity of extract yield ranged from 18% to 35% in 100 g of dried peel powder and the highest yield percentage was shown by Badana in comparison to Kandhari extract. However, the hydroalcoholic extract contains a greater amount of extract yield as compared to ethanol. The trend for yield was 50% hydroethanolic extract Badana, >70% hydroethanolic extract of Badana, 100% ethanolic extract of Badana, >50% hydroethanolic Kandhari, >70% hydroethanolic Kandhari, >100% ethanol extract of Kandhari, respectively. The extraction yield from Badana and Kandhari is represented in Table 2.
Total phenolics, total flavonoids, antioxidant activities and extract yield of pomegranate cultivars
| Treatment | TPC (mg GAE/g) | TFC (mg CE/g) | DPPH (%inhibition) | FRAP (mmol/100 g) | Yield (%) |
|---|---|---|---|---|---|
| Badana 100% ethanol | 667.14 ± 7.48a | 151.54 ± 2.01a | 87.77 ± 0.16a | 70.54 ± 0.25a | 29.64 ± 0.25c |
| Badana ethanol: water 70%: 30% | 515.48 ± 5.36c | 120.03 ± 1.52c | 77.78 ± 0.13b | 51.51 ± 0.36c | 32.65 ± 0.25b |
| Badana ethanol: water 50%: 50% | 454.98 ± 4.19d | 86.26 ± 1.01e | 52.25 ± 0.11e | 38.43 ± 26e | 35.61 ± 0.31a |
| Kandhari 100% ethanol | 602.22 ± 5.39b | 105.56 ± 1.53d | 60.77 ± 0.13c | 62.41 ± 0.05b | 18.53 ± 0.11f |
| Kandhari ethanol: water 70%: 30% | 412.80 ± 5.04e | 147.40 ± 1.08b | 54.64 ± 0.25d | 45.42 ± 0.19d | 21.55 ± 0.32e |
| Kandhari ethanol: water 50%: 50% | 284.74 ± 3.80f | 57.93 ± 0.56f | 48.57 ± 0.14f | 28.53 ± 0.06f | 24.35 ± 0.24d |
Means that share similar letters in a column are statistically non-significant (P > 0.05). This means that sharing the altered letter in a column is statistically significant (P < 0.05).
In our results, the 50% hydroethanolic extract of Badana exhibited a higher extraction yield that is relevant to the research work of (Kamarudin et al., 2016). The addition of water in an organic solvent is more important in the maximum recovery of bioactive components rather than alone ethanol or water (Wang et al., 2011). The better extract yield is highly dependent on the molecular composition and polarity of the solvent used. As water is a highly polar solvent due to the presence of a hydroxyl group and oxygen molecule while ethanol is less polar. These properties enable the hydroethanolic solvent for maximum extraction yield as compared with the pure solvent as discussed by (Pandit & Vyas, 2021).
Total phenolic and flavonoid contents
The total phenolic contents were varied from 284.74 ± 3.80 mg GAE/g to 667.14 ± 7.48 mg GAE/g with the highest concentration which was found in the 100% ethanolic extract of Badana (667.14 ± 7.48 mg GAE/g) followed by the 100% ethanolic extract of Kandhari (602.22 ± 5.39 mg GAE/g). The total phenolics from the different ratios of hydroethanolic extracts were obtained in the order 100% ethanol extract of Badana, >100% ethanol extract of Kandhari, >70% hydroethanolic extract of Badana, >70% hydroethanolic extract of Kandhari, >50% hydroethanolic extract Badana, >50% hydroethanolic extract of Kandhari.
The total flavonoid contents in pomegranate peels of both cultivars range from 57.93 ± 0.56 mg CE/g to 151.54 ± 2.01 mg CE/g. Results showed the highest quantity of flavonoids are found in the pure ethanol extract of Badana peel and the lowest in the 50% hydro ethanol extract of Kandhari. However, 70% hydro ethanol of Kandhari showed maximum flavonoids as compared with the pure ethanol. Total flavonoid contents range in the order of 100% ethanol extract of Badana, >70% hydroethanolic Kandhari, >70% hydroethanolic Badana, >100% ethanol extract of Kandhari, >50% hydroethanolic Badana, >50% hydroethanolic Kandhari. The mean values for total phenolics and flavonoids are presented in Table 2.
Phenolics are a group of heterogeneous organic compounds that are found in various parts of fruits and vegetables, mostly bound chemically to their macromolecules, or entrapped physically in intact cells. These phenols perform various biological actions in our bodies and protect against cellular damage (Wang et al., 2020). The 100% ethanol is associated with higher TPC values that could be explained because of the molecular weight and polarity difference of water and ethanol. As the ethanol is less polar in comparison to water so, these phenolic compounds may contain more phenol groups (non-polar) or higher molecular weight which make them more soluble in 100% ethanol in comparison to hydro ethanol extracts (Do et al., 2014) The extraction of different phenols dependent on solvent polarity and dipole moment of individual components that vary with extraction methods, various solvents maturity stages, cultivars, soil conditions and environmental conditions (Malviya et al., 2014; Jalal et al., 2018). The flavonoids belong to the subclass of dietary polyphenols that are strongly associated with a lower risk of morbidity and mortality in the heart diseases (Jiang et al., 2022). The 70% hydroethanolic extract of Badana contained more total flavonoids which is similar to the work of (Seo et al., 2014), which elaborated that the maximal flavonoids from guava leaf are extracted with 70% hydroalcoholic extract as compared to 30% and 50% hydro ethanol. The hydroethanolic extract is regarded as an environmentally favourable and food-grade solvent for the recovery of polyphenols as well as in terms of safety and cost (Saffarzadeh-Matin & Khosrowshahi, 2017).
Antioxidant activity by DPPH and FRAP analysis
The antioxidant activity of pomegranate peels of Badana and Kandhari is shown in Table 2. The total antioxidant activity was represented in terms of percent inhibition that ranged from 87.77% ± 0.16% to 48.57% ± 0.14% with the highest activity was indicated by the ethanolic extract of Badana peel and the lowest by the 50% hydro alcohol extract of Kandhari. Overall, different ratios of the Badana peel showed higher antioxidant activity in comparison to Kandhari peel.
The FRAP values for the extract of Badana and Kandhari are summarised in Table 2. The total FRAP value ranges from 28.53 ± 0.06 to 70.54 ± 0.25 mmol/100 g. The highest FRAP activity was shown by the ethanolic extract of the Badana peel in comparison to the Kandhari peel. Moreover, 100% ethanolic extract of Badana showed the highest antioxidant capacity while the lowest was shown by 50% hydro ethanol extract of Kandhari peel. The trend for FRAP activity was 100% ethanol extract of Badana, >100% hydroethanolic Kandhari, >70% hydroethanolic Badana, >70% ethanol extract of Kandhari, >50% hydroethanolic Badana, >50% hydroethanolic Kandhari, respectively. FRAP value increases with the increased concentration of ethanol.
Antioxidant activity help in the reduction of oxidative stress caused by drought, intense temperature, high salinity and heavy metals. These unfavourable conditions for plants cause increased production of reactive species of oxygen which damage the cell. The polyphenolic components donate hydrogen or electrons and protect them from cellular injury (Chaves et al., 2020). The DPPH and FRAP, two methods were analysed to access the antioxidant capabilities of the extract with greater sensitivity. The ethanol extract of Badana provides the highest antioxidant capacity in comparison to hydroalcoholic extract. The antioxidant activity of the pomegranate peel might be correlated to its polyphenolic contents as discussed by (Jayathilake et al., 2022).
FTIR assay
Fig. S1. represents the FTIR spectra of ethanolic and hydroethanolic extracts of Badana and Kandhari. The infrared spectrum of 100% ethanolic extract of Badana and Kandhari shows some major variations in their peaks and vibrations while less difference was seen among ethanol and hydroalcoholic extracts. The Badana peel shows a broad band at a frequency of 3342.2416 cm−1 while Kandhari at 3261.1717 cm−1 reflects the stretching vibration of OH bonds corresponding to gallic acid. Another small band at a frequency of 2998.3936 and 2962.0519 cm−1 at (a) and (d), respectively, indicated the vibrating stretching bond of aliphatic group C—H. The medium intensity band at 1737.6178 and 1732.0267 cm−1 of Badana and Kandhari peel ethanolic extract shows C═O stretching of the carbonyl group. The vibration bands in (a) at 1617.4108, 1226.0391 cm−1 while (d) at 1606.2287, 1335.0641 cm−1 attributed the stretching of the hydroxyl group of polyphenols. The peaks at 1446.8845 and 1486.0217 cm−1 in (a) and (d) assigned the skeletal vibration of aromatic ring structures. The plane bending at 873.8046 cm−1 in the Badana peel is referred to as isolated hydrogen in the benzene ring. This plane bending has a small peak at 871.0091 cm−1 in the Kandhari extract. The bending at 940.8969 cm−1 exhibits OH deformation of ellagic acid while this bending is not found in Kandhari ethanolic extract. The band at 661.3457 cm−1 in the Badana extract and 636.1861 cm−1 in the Kandhari extract depicts the bending of the acetylenic C—H bond. A small band at 1335.064 cm−1 in ethanolic extract of Kandhari peel indicates C—O—O stretching (Ben-Ali et al., 2018; Vinay et al., 2018).
The infrared spectrum of 70% hydroalcoholic extract of Badana and Kandhari shows a wide band at 3359.0146 and 3367.4012 cm−1 which correspond to stretching of a hydroxyl group (alcohol, carboxylic acid or phenols). The vibration band at 2922.9148 and 2914.5282 cm−1 depicts the aliphatic groups of C—CH and C—CH2 bond in Badana and Kandhari, respectively. The peaks in (b) and (e) at 1732.0267 and 1723.6402 cm−1 respectively, elaborate the C═O bond of the carboxylic group and COO groups of aldehydes and ketones. The vibration band at 1617.4108 and 1620.2063 cm−1 shows the presence of stretching in C═O and C═C in Badana and Kandhari hydroalcoholic extract. A peak at 1035.9443 and 1044.3308 cm−1 attributed to the stretching of the CO bond and deformation of alcohols in Badana and Kandhari extracts (Saadat et al., 2021).
The FTIR spectrum of 50% hydroalcoholic extract of Badana indicates the presence of a band at 3372.9922 cm−1 while Kandhari exhibits at 3350.6281 cm−1 which shows stretching of OH bond and is attributed as a phenolic group. A frequency of 2962.0519 cm−1 explicit by Badana peel and 2928.5058 cm−1 exhibited by the Kandhari peel referred to as CH stretching of methoxy and methyl group as well as methyl and methylene of carboxylic group (Bertolo et al., 2020). The frequency of 1768.3684 and 1734.8223 cm−1 in (c) and (f) peel extract indicated the presence of stretching C═O at carbonyl group and indicated the presence of gallagic acid (polyphenolic acid) while the band at 1620.2063 and 1611.8197 cm−1 of Badana and Kandhari might be referred as C═C linkages of alkene and aromatics, explicit the occurrence of ellagitannins or punicalagin. The peaks at 1446.8845 and 1441.2935 cm−1 are attributed to the bending vibration of the C—H bond of an alkyl group (Nisha et al., 2015; Skenderidis et al., 2019).
Infrared spectroscopy, an analytical technique that quantifies the absorbance of IR radiation of dipole bonds within functional groups of molecules. Most chemical compounds have a dipole moment and can be analysed by their distinctive infrared absorption. For organic components, typical stretching vibrations often occur between 4000 and 1500 and are called Mid Infrared zone. However, below 1500 provide the molecule's distinctive fingerprint for structural identification (Valand et al., 2020). In our research work, the infrared spectrum of peel extracts exhibited the presence of various aromatic and functional groups. Peaks at specific frequencies indicated the presence of various phenolic acids and prominent vibrating stretching bands of gallic acid in hydroalcoholic extract. The wide bands of gallic acids exhibited by 70% hydroalcoholic extracts in comparison with 50% hydroalcoholic or pure ethanol.
HPLC analysis
HPLC analysis of ethanolic and hydroalcoholic extracts of Badana and Kandhari peels was presented in Table 3. The results indicated the presence and quantity of distinct types of polyphenolic compounds in pomegranate peel. These bioactive compounds were found in higher quantities in Badana as compared to Kandhari. Moreover, the hydroalcoholic extract contains more polyphenolic compounds in comparison to 100% ethanol. Among hydroalcoholic extracts, 50% hydro ethanol of Badana and 70% hydro ethanol of Kandhari contains more phenolics such as ferulic acid, p-coumaric acid, m-coumaric acid, chlorogenic acid, vanillic acid and cinnamic acid. However, gallic acid was found as a major compound as shown by the HPLC chromatogram in Fig. S2. These results indicated the importance of water in the extraction of polyphenolics rather than only ethanol.
Phytochemical profiling of pomegranate peel extract by using HPLC
| Compound | Chemical formula | Molecular weight (g/Mol) | Retention time (min) | Area (mV/s) | Area (%) |
|---|---|---|---|---|---|
| Badana 100% ethanol | |||||
| Quercetin | C15H10O7 | 302 | 2.920 | 4003.918 | 2.6 |
| Gallic acid | C7H6O5 | 170 | 4.360 | 28033.673 | 18.5 |
| Caffeic acid | C9H8O4 | 180 | 12.673 | 2578.587 | 1.7 |
| Benzoic acid | C7H6O2 | 122 | 14.973 | 1959.175 | 1.3 |
| Syringic acid | C9H10O5 | 198 | 16.807 | 1686.099 | 1.1 |
| Sinapic acid | C11H12O5 | 224 | 24.913 | 10564.427 | 7.0 |
| Badana ethanol: water (70%: 30%) | |||||
| Quercetin | C15H10O7 | 302 | 2.927 | 2077.740 | 1.8 |
| Gallic acid | C7H6O5 | 170 | 4.360 | 19142.063 | 16.4 |
| Caffeic acid | C9H8O4 | 180 | 12.640 | 1862.243 | 1.6 |
| Benzoic acid | C7H6O2 | 122 | 14.367 | 1229.431 | 1.1 |
| Chlorogenic acid | C16H18O9 | 354 | 15.300 | 1766.628 | 1.5 |
| Syringic acid | C9H10O5 | 198 | 16.980 | 990.078 | 0.9 |
| p-coumaric acid | C9H8O3 | 164 | 17.753 | 949.983 | 0.8 |
| M-coumaric acid | C9H8O3 | 164 | 20.107 | 5079.334 | 4.4 |
| Cinnamic acid | C9H8O2 | 148 | 25.353 | 1810.289 | 1.6 |
| Badana ethanol: water (50%: 50%) | |||||
| Quercetin | C15H10O7 | 302 | 3.033 | 1834.722 | 2.5 |
| Gallic acid | C7H6O5 | 170 | 4.567 | 16615.735 | 22.3 |
| Caffeic acid | C9H8O4 | 180 | 12.773 | 650.771 | 0.9 |
| Vanillic acid | C8H8O4 | 168 | 13.327 | 104.439 | 0.1 |
| Benzoic acid | C7H6O2 | 122 | 14.947 | 530.826 | 0.7 |
| Chlorogenic acid | C16H18O9 | 354 | 15.853 | 212.921 | 0.3 |
| Syringic acid | C9H10O5 | 198 | 16.533 | 586.630 | 0.8 |
| p-coumaric acid | C9H8O3 | 164 | 17.300 | 1174.718 | 1.6 |
| M-coumaric acid | C9H8O3 | 164 | 20.087 | 3440.734 | 4.6 |
| Cinnamic acid | C9H8O2 | 148 | 25.107 | 2063.609 | 2.8 |
| Kandhari 100% ethanol | |||||
| Quercetin | C15H10O7 | 302 | 2.927 | 2843.683 | 2.2 |
| Gallic acid | C7H6O5 | 170 | 4.360 | 14571.723 | 11.1 |
| Caffeic acid | C9H8O4 | 180 | 12.200 | 2228.773 | 1.7 |
| Vanillic acid | C8H8O4 | 168 | 13.640 | 458.215 | 0.4 |
| Benzoic acid | C7H6O2 | 122 | 14.653 | 943.176 | 0.7 |
| Chlorogenic acid | C16H18O9 | 354 | 15.387 | 829.734 | 0.6 |
| M-coumaric acid | C9H8O3 | 164 | 20.527 | 3274.056 | 2.5 |
| Cinnamic acid | C9H8O2 | 148 | 25.107 | 2555.387 | 2.0 |
| Kandhari ethanol: water (70%:30%) | |||||
| Quercetin | C15H10O7 | 302 | 3.067 | 2951.000 | 4.5 |
| Gallic acid | C7H6O5 | 170 | 4.260 | 14059.923 | 21.4 |
| Caffeic acid | C9H8O4 | 180 | 12.827 | 782.086 | 1.2 |
| Syringic acid | C9H10O5 | 198 | 16.440 | 439.975 | 0.7 |
| P-coumaric acid | C9H8O3 | 164 | 17.847 | 421.966 | 0.6 |
| M-coumaric acid | C9H8O3 | 164 | 19.667 | 2073.190 | 3.1 |
| Ferulic acid | C10H10O4 | 194 | 22.300 | 3799.572 | 5.8 |
| Cinnamic acid | C9H8O2 | 148 | 24.807 | 2866.563 | 4.4 |
| Sinapic acid | C11H12O5 | 224 | 26.733 | 1886.507 | 2.9 |
| Kandhari ethanol: water (50%: 50%) | |||||
| Quercetin | C15H10O7 | 302 | 2.940 | 1888.479 | 3.1 |
| Gallic acid | C7H6O5 | 170 | 4.320 | 13502.894 | 22.3 |
| Caffeic acid | C9H8O4 | 180 | 12.613 | 1274.952 | 2.1 |
| Vanillic acid | C8H8O4 | 168 | 13.873 | 398.993 | 0.7 |
| Chlorogenic acid | C16H18O9 | 354 | 15.433 | 1068.583 | 1.8 |
| M-coumaric acid | C9H8O3 | 164 | 19.827 | 508.359 | 0.8 |
| Ferulic acid | C10H10O4 | 194 | 21.733 | 1544.416 | 2.5 |
| Cinnamic acid | C9H8O2 | 148 | 25.453 | 1033.749 | 1.7 |
The HPLC is a modern and versatile chromatographic technique for the separation, identification and quantification of phytochemicals or bioactive compounds from the crude mixture (Nahar et al., 2020). According to our results, Badana hydroalcoholic extracts exhibited the highest concentration of polyphenols, which is agreed with the study of (Mansour et al., 2018) that shows the presence of gallic acid as a predominant compound in the pomegranate peel extract followed by quercetin and other compounds such as p-coumaric acid, vanillic acid, caffeic acid, ellagic acid, etc. Previous studies indicated that these bioactive polyphenolic compounds found in the peel extract of pomegranate possess strong antioxidative, anti-bacterial and antiplasmogenic potential. These compounds also help to strengthen the immune system of human beings (Reddy et al., 2007).
Conclusion
The present research compares the attributes of two cultivars of P. granatum L. which concluded that pomegranate peels of the Badana variety possess higher nutritional and phytochemical profile such as phenolic acids (gallic acid, chlorogenic acid, M-coumaric acid, cinnamic acid, sinapic acid, syringic acid, benzoic acid, caffeic acid, p-coumaric acid and vanillic acid) flavonoids (quercetin) and strong antioxidant activity in comparison to Kandhari. The present research work depicted that 70% hydroethanolic extract is the best solvent for the extraction of maximal polyphenolic compounds and antioxidant activity. The molecular structure, polarity or dielectric constant of solvents (50%, 70% and 100% ethanol) have an impact on their polyphenolic yield, concentration, antioxidant value and presence of certain metabolic or bioactive compounds. These extracts can further be utilised as a food additive and as well as a nutraceutical agent in the pharmacological industry.
Acknowledgments
We are thankful to the University of Agriculture, Faisalabad, Pakistan for their support.
Author contributions
Sadia Kafeel: Conceptualization (equal); data curation (equal); formal analysis (equal); investigation (equal); methodology (equal); resources (equal); software (equal); writing – original draft (equal); writing – review and editing (equal). Muhammad Inam-ur-Raheem: Conceptualization (equal); data curation (equal); formal analysis (equal); investigation (equal); methodology (equal); project administration (equal); resources (equal); software (equal); supervision (equal); validation (equal); visualization (equal); writing – review and editing (equal). Moazzam R khan: Conceptualization (equal); data curation (equal); formal analysis (equal); investigation (equal); methodology (equal); project administration (equal); software (equal); supervision (equal); visualization (equal); writing – review and editing (equal). Muhammad Naeem Faisal: Conceptualization (equal); data curation (equal); formal analysis (equal); investigation (equal); methodology (equal); project administration (equal); resources (equal); software (equal); supervision (equal); validation (equal); visualization (equal); writing – review and editing (equal).
Conflict of interest
The authors declare that there is no conflict of interest.
Ethical approval
Ethics approval was not required for this research.
Data availability statement
Data will be available on reasonable demand.
References
This reference was added as it provides in depth knowledge related to sample preparation and analysis for the determination of various minerals.
This reference was given as it provides the effect of molecular weight and polarity on the sextraction of bioactive compounds from different solvents which is somewhat similar to our study.
This reference was added because it explains the preparation and extraction of various extracts by rotary evaporator which is similar to some extent to our study.
This reference was added as it provides brief information regarding preparation of sample and analysis for HPLC.
