


Abstract
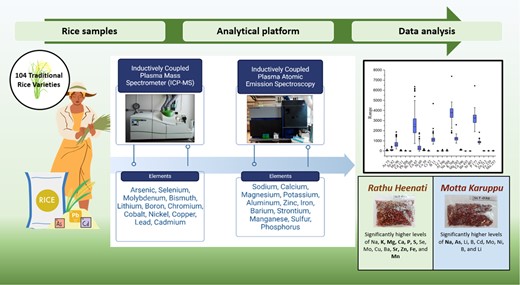
Recently, traditional rice cultivars have become more popular than new, enhanced rice varieties, with the main focus being on their health benefits. Few rice cultivars have been thoroughly studied to understand their nutritional and health benefits. Inductively coupled plasma atomic emission/mass spectroscopy methods were used to determine the concentrations of 24 key nutrients and trace elements in 104 traditional rice types (Oryza sativa L.) grown in Sri Lanka. Compared to the Codex Alimentarius provisional tolerable daily intake for 24 different elements, the concentrations of toxic elements such as As, Cd, Pb and Cr were significantly lower (P < 0.05), and most of the nutritional elemental concentrations were substantially higher (P < 0.05) in evaluated traditional rice varieties. Furthermore, Pb, Bi, B, K, Mg, S, Zn and Fe concentrations among traditional rice varieties were not substantially different (P > 0.05). Notably, several traditional rice varieties (i.e. Rathu Heenati, Pragathi Wee, Weda Heenati, etc.) contained significantly high levels of selenium (≈250 μg L−1 DM, P < 0.05), an important trace element that is deficient in the diets of 1 billion people globally.
Introduction
Rice is commonly a semiaquatic annual grass and belongs to the genus Oryza. It is estimated that around 50% of the world's population consumes rice as a main diet (Ravichanthiran et al., 2018; Thushara et al., 2022). Especially in Asia, including Sri Lanka, rice has become the staple diet and main income source for millions of people (Poutanen et al., 2022). World Health Organization reported that 30% of the energy and 20% of the protein in the diets of people in Asia come from rice (Poutanen et al., 2022). The physicochemical properties and nutritional value of rice have long been acknowledged as crucial elements in consumer appeal and, more importantly, the resolution of health concerns (Ravichanthiran et al., 2018; Thushara et al., 2022). Since ancient times, Sri Lankans have employed a variety of local rice varietals in culinary and ‘Ayurvedic’ medicinal treatments, although not understand the precise nutraceutical and functional ingredients supporting various health benefits (Ravichanthiran et al., 2018; Thushara et al., 2022).
Rice, on the other hand, is well known for containing high levels of trace elements that build in grains as a result of exposure to the environment. The trace elements are present in small amounts in rice grains, their levels might be significantly increased as a result of the use of agrochemicals and irrigation of paddy fields with polluted water (Sebastian & Prasad, 2015). Erratic usage of inorganic fertilisers and heavy usage of pesticides in rice cultivation have emerged as major threats to accumulating toxic heavy metals in the rice grain. Rice grains from contaminated areas, as well as certain non-polluted areas, were found to have considerably higher levels of toxic elements such as Cd, Pb and As (Sebastian & Prasad, 2015). Exposure to harmful trace elements in food chains may harm human health, resulting in chronic disorders such as malfunction of organs (e.g. chronic kidney disease; CKDu) (Hänsch & Mendel, 2009; Sebastian & Prasad, 2015).
Nevertheless, it is widely acknowledged that various micronutrients, including Se, Mo, Cr, Mn, Fe, Co, Cu and Zn, may support the body's regular physiological activities (Hänsch & Mendel, 2009; Al-Daej, 2022). Furthermore, studies have shown that brown and red rice are excellent sources of minerals including fibre, B vitamins, Ca, Zn, Fe, Mn, Se and Mg (Hänsch & Mendel, 2009; Sebastian & Prasad, 2015; Peña-Rosas et al., 2019).
The mineral content of some Sri Lankan traditional rice varieties was found to be higher than that of newly improved rice varieties. For example, the iron content of the traditional rice varieties ranged from 3.60 to 5.87 mg/100 g, while the iron content of the newly improved rice varieties ranged from 2.02 to 2.44 mg/100 g. Similarly, the calcium content of the traditional rice varieties ranged from 23.60 to 50.95 mg/100 g, while the calcium content of the new improved rice varieties ranged from 4.90 to 7.65 mg/100 g (Peña-Rosas et al., 2019). Another study reported that some traditional rice varieties in Sri Lanka contain high levels of essential minerals such as Fe, Zn, and Se. For example, the Fe content of some traditional rice varieties was found to be as high as 6.5 mg/100 g, whereas the Zn content ranged from 22.6 to 37.8 mg/100 g.
The variations in the mineral content in rice have been observed in the rice varieties due to genetic variations, crop management practices, environmental factors, location of cultivation, cultivation season and processing conditions (Hänsch & Mendel, 2009; Peña-Rosas et al., 2019). Despite these findings, there is still a lack of comprehensive data on the mineral content of Sri Lankan traditional rice varieties. More research is needed to evaluate the mineral content of a wider range of rice varieties as well as to investigate the bioavailability and nutritional impact of these minerals.
The purpose of the current research was to compare traditional rice types to find out how they differed in terms of different trace elements and nutritious components. The amount of heavy metals (trace elements) and nutritional components in 104 traditional Sri Lankan rice types were measured using the ICP-MS and ICP-AES.
Materials and methods
Reagents
Ultrapure water (18.2 MΩ.cm) was generated from the Milli-Q purification system (Millipore, Bedford, MA, USA) employed to prepare all standards and samples. Suprapur® grade 65% HNO3 (w/w) and 30% H2O2 (w/w) were purchased from VWR (Stockholm, Sweden). Verfilco, Fontenay-sous-Bois, France provided all the glassware for sample digestion. Using a 200 μM mesh, mono-elemental, high-purity grade 1 g L−1 stock solutions were prepared (Teknolab AS, Drobok, Norway). Certified reference materials for the analyses, such as SRM 1567a wheat flour, SRM 1577a bovine liver, SRM 1572a citrus leaves and SRM 0538 pig kidney, were purchased from the National Institute of Standards and Technology (NIST), Maryland, USA.
Selection of rice samples
The Rice Research and Development Institution (RRDI) in Bathalagoda, Sri Lanka provided 104 rice samples that were grown experimentally at the institution and some certified farmers according to the Randomised Complete Block Design (RCBD). The samples were taken in 2019 during the Yala and Maha seasons, reflecting Sri Lanka's primary paddy-growing climate zones. A list of the analysed rice varieties is shown in Table 1. Biological replicate samples of each cultivar were gathered and kept at room temperature (25 °C) in sealed containers. Raw homogenised brown and white rice samples (3–7 mm grain length) were manually milled (reduced in size to below 500 μm) in a mortar with a pestle and kept in Falcon tubes at room temperature (25 °C). The milling and storage conditions for all the rice samples were kept the same for all the analysed rice samples before the ICP-MS and ICP-AES analyses and maintained airtight conditions in the sample containers throughout the experiments.
Selected traditional rice varieties for the analyses
| Name of the rice variety | Rice pericarp colour |
|---|---|
| Asuda Wee | White |
| Batapola el | Red |
| Beheth Heenati | Red |
| Beheth Heenati | White |
| Black Rice | Red |
| Dahanala | Red |
| Dewaraja | Red |
| Dik wee | Red |
| Duru wee | Red |
| Sulai | Red |
| Galu Sulai | Red |
| Geeras | Red |
| Goda Heenati | Red |
| Gonabaru | Red |
| Gurusinghe wee | Red |
| Heen Rathdel | Red |
| Herath-Banda | Red |
| Hichchi Nangi | Red |
| Hodarawala | Red |
| Kadan wee | Red |
| Kahamal | Red |
| Kaharamana | Red |
| Kahawanu | White |
| Kalu heenati | Red |
| Kalukumara | Red |
| Kiri Naran | White |
| Kottiyaran/kotayaya dik wee | Red |
| Kuru wee | White |
| Kuruluthuda | Red |
| Lidagala Sudu wee | Red |
| Madathawalu | Red |
| Maha Ma Wee | Red |
| Mahagoda wee | Red |
| Maharathdel | Red |
| Mal kora | Red |
| Maligakande wee | Red |
| Masuran | Red |
| Matin Samba | White |
| Motta Karuppu | Red |
| Murungakayan | Red |
| Pachchaperumal | Red |
| Panrikooran | Red |
| Pihatu wee | Red |
| Pokkali | Red |
| Pragathi wee | Red |
| Pushparaga | Red |
| Ran Ruwan | Red |
| Ranthawalu | Red |
| Rath Suwadel | Red |
| Rathdel | Red |
| Rathhabili el | White |
| Rathkada | Red |
| Rathkada el | White |
| Rathkada sudu | White |
| Rathkayan | Red |
| Raththaran wee | Red |
| Rathu heenati | Red |
| Siwuru wee | Red |
| Sudu Heenati | Red |
| SuduMurunga | Red |
| Suduru samba | Red |
| Suwadel | White |
| Thuwulu el | Red |
| Unakola samba | White |
| Weda Heenati | Red |
Preparation of the internal standards
The present research included three distinct forms of internal standards as stated in a previously validated method by Korvela et al. (2018), with the following modifications: The quantification of As and Se was performed using Ge as the internal standard with ICP-MS, and the rest of the elements were quantified using Tl as the internal standard. In ICP-MS analyses, the mass and ionisation potential of an element are the most important determinants of the matrix effect. Therefore, ideal internal standards were selected by having a similar mass and ionisation potential with the analyte. An internal standard mixture, prepared by Tl [(1001 ± 0.5 μg L−1) from Teknolab AB, Kungsbacka, Sweden. Additionally, 0.7% HNO3, Ge [(1000 ± 0.5 μg L−1) 4.9% HF by Teknolab AS Drobok, Norway)] were used in the analyses in ICP-MS and Scandium (999 ± 5 μg L−1, 2% HNO3d = 1.010 g mL−1, Teknolab AB, Kungsbacka, Sweden) was used in the elemental determination with ICP-AES of the samples. The mixed internal standard solution had a concentration of 5 ng/mL in all the samples and calibration solutions with Tl and Ge for the ICP-MS analyses. A working solution of 1 μg L−1 was prepared, 0.05 mL of each standard was added to a 50 mL Falcon tube, and HNO3 (5 mL) was added to obtain the 10% concentration of acid. For the preparation of the calibration solutions, 250 μL of the prepared mixed internal standard solution was added to each standard solution. For the samples, 125 μL of the prepared mixed internal standard was added. The single-elemental stock solutions, 1000 ± 5 μg L−1 of As, Se, Mo, Bi, Li, B, Cr, Co, Ni, Cu, Pb, and Cd in 5.0% HNO3 (v/v), distributed by Inorganic Ventures Kontroll ARev., Sweden, were used to prepare the calibration solutions for ICP-MS. The calibration solutions were prepared in concentrations of 0.0, 0.5, 1.0, 5.0, 10.0, 20.0, and 25.0 μg L−1. The single-elemental stock solutions, 1000 ± 5 μg/mL of Al, Zn, Fe, Ba, Sr, Mn, S, P, Na, Ca, Mg, and K in 5.0% HNO3 (v/v), distributed by Inorganic Ventures Kontroll ARev, Sweden, were used to prepare the calibration solutions. The calibration solutions were prepared in concentrations of 0.0, 0.2, 0.5, 1.0, 5.0, and 10.0 mg L−1, in 50.0 mL Falcon tubes for ICP-AES (Fig. S3).
Sample preparation
Acid digestion of each rice sample was performed using a commercial high-pressure laboratory Titan MPS (PerkinElmer, USA) microwave-assisted digestion system. Sample masses of 0.5 g of each dried and ground rice sample were weighed and transferred to a microwave-closed vessel (PTFE digestion vessel) and 4.0 mL HNO3 solution and 1.0 mL of 30% (w/w) H2O2 were also added to each vessel. The heating programme was performed in five successive steps as shown in Table 2. After digestion and cooling, the digests were transferred to Falcon tubes and 125 μL from the mixture of internal standards containing 81Tl and 32Ge (5 ng/mL) were added into the digest and made up to a final volume of 25.0 mL with Milli-Q water. Finally, blank samples were prepared in each batch of samples. An additional step was followed before the measurement of inorganic Al, Zn, Fe, Ba, Sr, Mn, S, P, Na, Ca, Mg and K with ICP-AES (Fig. 3). The prepared samples for the ICP-MS were again prepared for the ICP-AES by taking 8 mL from the ICP-MS sample solution, adding 100 μL from the internal standard of Sc with the final concentration of 1 μg L−1, and volumerised up to 10 mL with the purpose of dilution of the previously prepared samples for the ICP-MS.
The microwave settings used for digesting the rice samples
| T (оC) | Pressure (bar) | Ramp | Hold | Pressure % | |
|---|---|---|---|---|---|
| 1 | 160 | 30 | 10 | 15 | 70 |
| 2 | 180 | 35 | 5 | 15 | 90 |
| 3 | 50 | 35 | 1 | 10 | 0 |
| 4 | 50 | 0 | 0 | 0 | 0 |
| 5 | 50 | 0 | 0 | 0 | 0 |
| T (оC) | Pressure (bar) | Ramp | Hold | Pressure % | |
|---|---|---|---|---|---|
| 1 | 160 | 30 | 10 | 15 | 70 |
| 2 | 180 | 35 | 5 | 15 | 90 |
| 3 | 50 | 35 | 1 | 10 | 0 |
| 4 | 50 | 0 | 0 | 0 | 0 |
| 5 | 50 | 0 | 0 | 0 | 0 |
Analysis of elements
A quadrupole ICP-MS, Perkin Elmer NexION 300 D Inductively Coupled Plasma Mass Spectrometer, equipped with a peristaltic pump, concentric type nebulizer, and baffled cyclonic spray chamber was used for the determination of As, Se, Mo, Bi, Li, B, Cr, Co, Ni, Cu, Pb and Cd. The injector tube and torch used were Perkin Elmer factory standards, made of quartz. In addition to that, the instrument was outfitted with the option to either employ a collision (He) or reaction (NH3) gas in a cell before the main quadrupole analysis cell. In this analysis, the collision (He) reaction cell was used for interference removal. Inductively coupled plasma mass spectrometry operating conditions are shown in Table 3.
Inductively coupled plasma mass spectrometric operating conditions
| Parameter | Description | Setting |
|---|---|---|
| Nebulizer Gas Flow STD/KEO [NEB] | Standard | 0.98 |
| Auxiliary Gas Flow | Standard | 1.20 |
| Plasma Gas Flow | Standard | 18.00 |
| Deflector Voltage | Standard | −10.75 |
| ICP RF Power | Standard | 1600.00 |
| Analog Stage Voltage | Standard | 2000.00 |
| Pulse Stage Voltage | Standard | 1050.00 |
| Quadrupole Rod Offset STD [ORO) | Standard | −2.00 |
| Cell Rod Offset STD [CAO] | Standard | −14.00 |
| Discriminator Threshold | Standard | 15.00 |
| Cell Entrance/Exit Voltage STD | Standard | −5.00 |
| DRC-DRC Mode NEB | Ammonia | 0.98 |
| DRC-DRC Mode ORO | Ammonia | −10.00 |
| DRC-DRC Mode CAO | Ammonia | −2.00 |
| DRC-DRC Mode Cell Entrance Voltage | Ammonia | −9.00 |
| DRC-Axial Field Voltage | Ammonia | 400.00 |
| DRC-RPa | Ammonia | 0.00 |
| DRC -RPq | Ammonia | 0.25 |
| Ammonia DRC-Cell Gas A | Ammonia | 0.50 |
| Helium KEO-KEO Mode ORO | Helium KEO | −12.00 |
| Helium KEO-KEO Mode CAO | Helium KEO | −15.00 |
| Helium KEO-KEO Mode Cell Entrance Voltage | Helium KEO | −8.00 |
| Helium KEO-KEO Mode Cell Exit Voltage | Helium KEO | −25.00 |
| Helium KEO-KEO Mode Axial Field Voltage | Helium KEO | 475.00 |
| Helium KEO-KEORPa | Helium KEO | 0.00 |
| Helium KEO-KEORPq | Helium KEO | 0.25 |
| Helium KEO-Cell Gas B | Helium KEO | 4.50 |
To obtain optimal accuracy and precision, the internal standards were chosen as close in mass number as possible to that of the analyte element. Therefore, Ge and Tl were used as internal standards. The CRM was analysed before the experiment and within each sample set. For the ICP-MS Rice Flour-NIST SRM 1568a-National Institute of Standard and Technology, USA and the ICP-AES SRM 1567a-Wheat Flour, SRM 1577a-Bovine Liver, SRM 1572a-Citrus Leaves, and SRM 0538-Pig Kidney, from National Institute of Standard and Technology, USA were used as the reference materials to check the performance of the instrument. The data processing was performed by applying Syngistix software (Perkin Elmer USA).
The ICP-AES instrument, Spectro Ciros CCD (Charge Coupled Device) EOP (Spectro Analytical Instruments, Kleve, Germany) was used for determinations of Al, Zn, Fe, Ba, Sr, Mn, S, P, Na, Ca, Mg and K (Fig. 4). The sample introduction to the ICP-AES instrumentation was accomplished by the use of a modified Lichte nebulizer accompanied by a cyclone spray chamber. The ICP AES was calibrated with a multi-element calibration solution containing Al, Zn, Fe, Ba, Sr, Mn, S, P, Na, Ca, Mg and K, and the optical alignment was adjusted using a solution containing 1.0 mg L−1 from all the elements mentioned above. The selection of emission lines was carried out based on the absence of spectral interferences and adequate sensitivity for the determination of the elements at low and high concentrations. The analytical wavelengths (nm) employed were Al (I) 396.152, Ca (II) 396.847, Ca (II) 317.933, Fe (II) 238.204, Fe (II) 259.941, K (I) 766.491, Mg (I) 285.213, Mg (II) 279.553, Mn (II) 257.610, Mn (II) 259.373, Zn (II), 213.856, Zn (II) 206.191, Na (I) 589.592, Na (I) 588.995, P (I) 177.495, P (I) 178.287, S (I) 180.731, S (I) 182.034, Sr (II) 407.771, Sr (I) 421.552, Ba (II) 455.404 and Ba (II) 233.527.
Quality assurance and quality control
All of the samples were digested in replicates and all measurements were run in analytical triplicate for each sample. Element concentrations were calculated and expressed in μg L−1 in ICP-MS and mg L−1 in ICP-AES dry weight. The accuracy of the analytical methods was verified by analysing certified reference materials separately for the ICP-MS and ICP-AES. At least two samples of the certified reference materials and two blanks (reagents and digestion blanks) were included in each analytical batch. The precision of the method was defined as the closeness of agreement between mutually independent test results and it was expressed in terms of relative standard deviation (RSD%). The results obtained from the certified reference materials were within the acceptable range.
Statistical analysis
Principle Component Analysis (PCA) was used to examine the contents of the elements, followed by Cluster Analysis. The linearity of the calibration curves was confirmed using regression analysis and ANOVA. The calibration graphs' linearity was tested using all of the samples at various points throughout the tests. The coefficient of determination, r2, was used to determine the linearity of the calibration curves. To investigate the individual elemental changes among traditional rice varieties found in Sri Lanka, an analysis of variance (ANOVA) was used with two-sample t-tests. For each elemental variation, box plots were used to represent the summary of a set of data. The data were analysed using Minitab 17 Statistical Software, SAS Version 9.0, and Origin 2022.
Results and discussion
Analytical performance
The proposed method was applied to determine the trace elements and nutritional elements of 104 traditional rice varieties and 27 new improved rice varieties obtained from the Rice Research and Development Institute (RRDI), Bathalagoda, Sri Lanka. The results of the new improved rice varieties will be discussed in a separate manuscript.
The efficacy of the breakdown of the samples in the microwave oven was evaluated using certified reference materials (CRM), acid concentration, digesting time and temperature. Recovery of the analytes for all the reference materials ranged from 84% to 123%. All the ICP-MS and ICP-AES calibration curves for the 24 elements had an r2 value of 0.999, indicating that the calibration curves utilised in the study were linear (Fig. S1). The residual impact was not considerably altered for the calibration points, as seen by residual plots of calibration curves that showed no trend. The results obtained for CRM samples from ICP AES and ICP MS analyses were found to be in accord with the values provided by the supplier. The recovery ranges of Na and K (102%-123%) were in accordance with the prior studies on the assessment of minerals in dietary samples and these findings were within an acceptable range for mg g−1 or μg g−1 concentration levels. The results of the aforesaid investigation verified that the suggested approach had a high analytical performance of the apparatus utilised, which is a necessary condition for multi-element analysis using the ICP-MS and ICP-AES.
Mineral composition variations of rice samples
In the current study, principle component analysis (PCA) (Fig. 1b) showed that the first three principle components provided a reasonable summary of the data and explained more than 60% of the total variations. The fact that variance in the data set was distributed in the first three variables was likely due to the high correlation between the elements which are responsible for the first three principle components. Table 4 shows the eigenvalues for the first three principle components. The first component explained 26.4% of the total variance, which was mainly contributed by Mg, P, S, K, Zn, Fe and Ca (Fig. 1). The second principle component accounted for 16.1% of variations mainly through As, Co, Ba, Mn, Cd, Cr and Na. The third principle component explained 11.3% of variations mainly via the concentrations of Pb, Cr, Li, Al, Fe, Mo and Se (Diyabalanage et al., 2016).
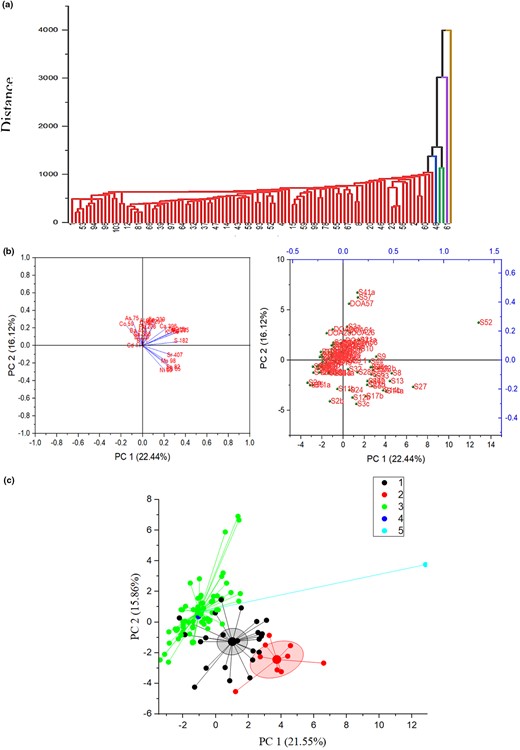
(a) Cluster analysis, (b) Principle component analysis and (c) traditional rice varieties grouping based on the principle components of 104 rice varieties found in Sri Lanka based on different similarity levels.
Responsible elements for the first three principle components based on the eigenvalues
| PC 1 | PC 2 | PC 3 |
|---|---|---|
| Cu 0.929 | Cu 0.221 | B 0.957 |
| P 0.167 | Mo 0.013 | Mo 0.270 |
| S 0.062 | Cd 0.008 | Cd 0.007 |
| K 0.147 | Ni 0.080 | Li 0.002 |
| Mg 0.058 | B 0.007 | Na 0.005 |
| Ni 0.204 | Pb 0.001 | K 0.020 |
| Ca 0.003 | Bi 0.000 | S 0.023 |
| PC 1 | PC 2 | PC 3 |
|---|---|---|
| Cu 0.929 | Cu 0.221 | B 0.957 |
| P 0.167 | Mo 0.013 | Mo 0.270 |
| S 0.062 | Cd 0.008 | Cd 0.007 |
| K 0.147 | Ni 0.080 | Li 0.002 |
| Mg 0.058 | B 0.007 | Na 0.005 |
| Ni 0.204 | Pb 0.001 | K 0.020 |
| Ca 0.003 | Bi 0.000 | S 0.023 |
ANOVA with two-sample t-test analysis revealed significant differences for different elements at P = 0.05 suggesting there are strong elemental variations among traditional rice varieties, especially the trace elements such as As, Cd and Pb. Previous studies confirmed that rice and other paddy crops and vegetables contain Cr 15–465 μg L−1, Pb 16–248 μg L−1, Cu 1–4 mg L−1, Zn 10.9–24.5 mg L−1, Cd 8.7–17.1 μg L−1, Co 7–42 μg L−1, Mn 61–356 μg L−1, Ni 61–356 μg L−1 and Pb 670–16, 500 μg L−1 and further revealed that the As and other metal-contaminated groundwater could be the source of heavy metal contaminants affecting food chains (Sebastian & Prasad, 2015; Diyabalanage et al., 2016; Islam et al., 2016; Perera et al., 2023). For instance, significantly higher amounts of Cd, Pb and As were reported in rice grains from contaminated areas and even from some non-polluted regions despite the type of soil (Sebastian & Prasad, 2015; Perera et al., 2023). The mineral composition variations in the current study mostly can be explained by the similarity of the environments because all the samples were obtained from the same research field and certified farmers from the same area. For instance, since the cultivation areas were close, all the tested varieties shared the same soil traits and differed only in the climatic conditions among the harvests. According to the literature, in similar environments, the micronutrient concentration of a given genotype remains constant, and therefore the analysed data could differ due to the inherent genotypes of the traditional rice varieties tested (Hänsch & Mendel, 2009; Sebastian & Prasad, 2015; Karunarathna et al., 2022; Perera et al., 2023).
Cluster analysis
Cluster analysis generated a dendrogram as illustrated in Fig. 1a. The analysis is based on the mean values of the 24 measured elemental concentrations within 104 rice varieties into 10 clusters based on a similarity level of 70%. Each cluster was markedly different from the other clusters and consisted of various types of rice varieties. Principle component analysis showed that the traditional rice varieties of Batapola el, Dewaraja, Galu Sulai, Geeras, Goda Heenati, Gonabaru, Kadan wee, Kahawanu, Kiri Naran, Kottiyaran/Kotayaya dik wee, Madathawalu, Maharathdel, Mal kora, Masuran, Panrikooran, Pragathi wee, Pushparaga, Ran Ruwan, Rath Suwadel, Rathkayan, Sudu Heenati, Suduru samba and Unakola samba were grouped based on their elemental concentration similarities as shown in black in Fig. 1c. Whereas Beheth Heenati, Duru wee, Gurusinghe wee, Heen Rathdel, Kalukumara, Lidagala Sudu wee, Maligakande wee and Siwuru wee were grouped as group 2 based on their elemental concentration similarities which are shown in red in Fig. 1c. As the largest group with most of the traditional rice varieties tested group 3 was formed with the traditional rice varieties of Asuda Wee, Batapola el, Beheth Heenati, Beheth Heenati (White), Black Rice, Dahanala, Dik wee, Sulai, Goda Heenati, Gonabaru, Hichchi Nangi, Hodarawala, Kadan wee, Kahamal, Kaharamana, Kahawanu, Kalu heenati, Kalukumara, Kiri Naran, Kuru wee, Kuruluthuda, Madathawalu, Maha Ma Wee, Mahagoda wee, Masuran, Matin Samba, Murungakayan, Pachchaperumal, Pihatu wee, Pokkali, Ranthawalu, Rath Suwadel, Rathdel, Rathhabili el, Rathkada, Rathkada el, Rathkada sudu, Rathkayan, Raththaran wee, Sudu Heenati, Sudu Murunga, Suduru samba, Suwadel, Thuwulu el, Weda Heenati and Herath-Banda which are shown in green in the Fig. 1c.
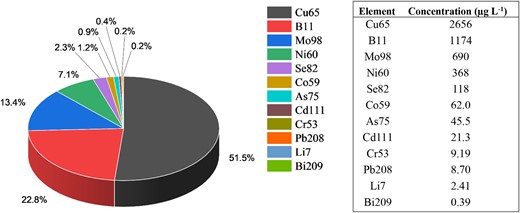
There were two clusters only with one rice variety, as shown in Fig. 1c. In the same Fig. 2c, in group 4 and group 5 (dark blue and light blue), the only rice varieties found were Motta karuppu and Rathu Heenati, respectively. Those two different clusters showed two different types of rice varieties which had invariably higher amounts of elements compared to the rest of the rice varieties analysed. The traditional rice variety called Motta Karuppu is the only rice variety that is responsible for cluster 9 or group 4 in both cluster analysis and PCA. This could be due to the Motta Karuppu traditional rice variety which contains significantly higher levels of Na, As, Li, B, Cd, Mo, Ni, B and Li compared to the rest of the rice varieties (Fig. S2). The regression analysis performed for the current study revealed that there is a significant (P = 0.0003) correlation between Na and As. Compared with the other tested varieties, Motta Karuppu rice variety had an arsenic concentration of 170 ± 2 μg L−1 and a high sodium concentration. The presence of both these elements at a high level showed that the high arsenic concentration is correlated to the presence of high sodium. The elemental concentrations in 104 traditional rice varieties measured by ICP-MS are presented in Fig. 1a,b.
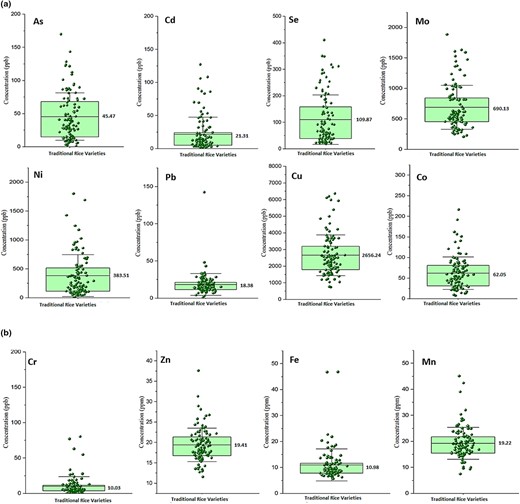
Elements concentration in traditional rice varieties (μg L−1).
Excess As accumulation in traditional rice varieties may be due to the application of organic manure such as poultry litter. In addition, the rice variety Motta Karuppu is widely grown in the northern area of Sri Lanka and the cultivar itself could be responsible for the presence of elevated levels of As with its genotype. As is a highly redox-sensitive element that combines iron hydroxide and/or sulfide with oxyhydroxide. Through irrigation water that contains As, it may be accumulated in the rice grains. Rock weathering, a natural source of As pollution, and human actions such as pesticide use are the primary causes of As contamination in soil. The process of As absorption in rice grains is the conversion of arsenate As (IV) into the more hazardous arsenite As (III) under flooded circumstances in paddy soil, followed by translocation and accumulation in rice (Polizzotto et al., 2013; Qaswar et al., 2022; Perera et al., 2023). As, a toxic metallic substance, is formed in the form of As (III) and As (V) (Tongesayi & Smart, 2006). Due to oxidation, depletion and methylation, As in paddy soil are manipulated by microorganisms. The addition of organic matter increases the methylation of the paddy through microbial activity and thus enhances evaporation due to microbial activity, possibly in the form of trimethylarzine, monomethylarcin, dimethylsorbic acid and arazine. The nature of the event depends on the methylation product concentration as well as the nature of the microorganisms present in the soil. Under anaerobic conditions (flooded), inorganic As exists as low trivalent arsenite and inorganic As as oxidised pentavalent arsenate in aerated soil. The mobility of arsenite in the soil is higher than that of arsenate (Tongesayi & Smart, 2006; Qaswar et al., 2022). According to previous studies, As speciation is due to geographical conditions and showed that environmental conditions play a major role compared to genetic factors.
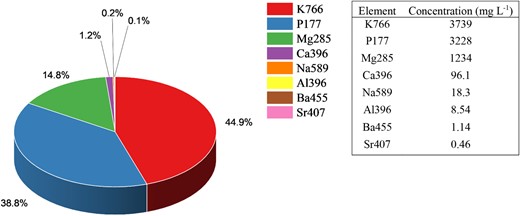
In cluster analysis, cluster 10 also has only one rice variety among the other 104 rice varieties based on a similarity level of 70%. It indicates that the variety Rathu Héenati contained a high concentration of most of the essential nutrients such as Na, K, Mg, Ca, P, S, Se, Mo, Cu, Ba, Sr, Zn, Fe and Mn compared to the other traditional rice varieties. The elements such as K, P and Mg were identified as the macro-minerals for all studied rice samples. The order of the mean concentration of elements was K > P > Mg > S > Ca > Na. This is the normal order of presentation of the elements based on the plant requirement which may vary from species to species and slightly among the varieties within a given species. The elemental concentrations in 104 traditional rice varieties measured by ICP-AES are presented in Figs 3 and 4.
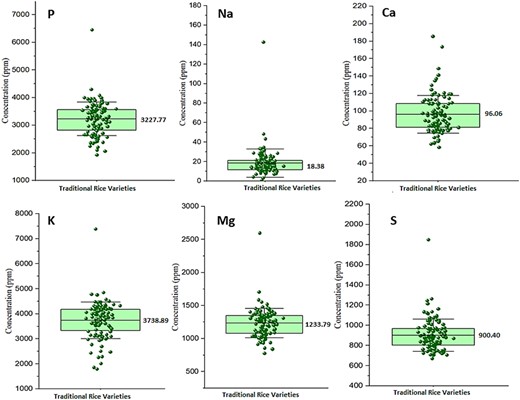
Elements concentration in traditional rice varieties (mg L−1).
The median concentration of elements in 104 traditional rice varieties (macro).
In comparison, within these microelements As, Se, Mo, Cd, Cu, Ni, Co, Cr and Mn mean concentrations were significantly (t-test; P < 0.05) different between traditional and newly improved rice varieties (Kodikara et al., unpublished). It is a well-known traditional rice variety in Sri Lanka that has high nutritional benefits for human health. The current study confirms that Rathu Héenati rice variety has both essential macro- and micro-minerals, which are deficient in most people around the world.
Rice is a very diverse species and it is divided into Japonica and Indica rice. They can be divided further into subpopulations such as Aus, Aromatic, Indica, Tropical Japonica and Temperate Japonica (Garris et al., 2005; Garcia-Oliveira et al., 2009). Several studies have been conducted to evaluate the variation in the genetics of element content across and within subpopulations (Jiang & Wessler, 2001; Garcia-Oliveira et al., 2009). For instance, eight elements in 247 rice genotypes were measured in a study conducted by a previous study confirmed that there were significant genotype differences among rice types for different elemental concentrations (Jiang & Wessler, 2001). The values varied 8.5-, 6-, 8-, 19.5-, 5-, 26-, 3.5- and 7.5-fold in sodium, potassium, calcium, magnesium, manganese, iron, zinc and copper, respectively (Jiang & Wessler, 2001).
Single elemental variation among the traditional rice varieties
When considering the box plots of P concentrations Rathu Heenati, appears as an outlier. However, the variety Rathu Heenati is rich in most of the essential elements and has a P concentration of 6447 ± 13 mg L−1, which proves that it is not an outlier with the standard deviation value obtained from the replicate measurements.
The box plots of Na concentrations exhibited a similar pattern where the variety Kahawanu, behaves better (Na concentration of 140 ± 1 mg L−1) than the average Na concentrations. However, the concentrations of K, Mg and S were not significantly (t-test; P > 0.05) different among rice varieties studied in this study. Even though the K concentrations were not significantly different, the variety Rathu Heenati had a high K concentration of 7386 ± 4 mg kg−1. In Mg box plots and S box plots, Rathu Heenati also behaves as an outlier with a higher Mg concentration of 2179 ± 7 mg L−1 and S concentration of 1847 ± 5 mg L−1, respectively. All these findings prove that the traditional rice variety called Rathu Heenati has most of the essential minerals in higher concentrations compared to all other traditional rice varieties as shown in Figs 3 and 4. The mean concentrations with the standard deviation of the tested macro-minerals in traditional rice samples analysed by ICP-AES are shown in Table 5.
Mean of elements in traditional rice samples by ICP-AES (mg/kg)
| Elements | Traditional rice verities (mg/kg) |
|---|---|
| K | 3739 ± 136 |
| P | 3228 ± 104 |
| Mg | 1234 ± 102 |
| S | 900 ± 59 |
| Ca | 96 ± 11 |
| Elements | Traditional rice verities (mg/kg) |
|---|---|
| K | 3739 ± 136 |
| P | 3228 ± 104 |
| Mg | 1234 ± 102 |
| S | 900 ± 59 |
| Ca | 96 ± 11 |
The elemental concentration of rice samples was analysed with a confidence interval of 95% to check the single elemental variations among traditional rice varieties studied after analysing groups. Concentrations of As, Se, Mo, Cd, Cu, Ni, Co, Cr, Li, Al, Na, Ca, Ba, Sr, P and Mn were significantly (t-test; P < 0.05) different among traditional rice varieties (Fig. 5). Pb, Bi, B, K, Mg, S and Zn were not significantly (t-test; P > 0.05) different among the tested traditional rice varieties. The box plots illustrate the most significant single elemental concentration variations of micronutrients. The mean concentrations of a few of the micronutrients are shown in Table 6 with the calculated standard deviations for the analysed samples.
Mean of elements in traditional rice samples by ICP-MS (mg/kg)
| Elements | Traditional rice verities (mg/kg) |
|---|---|
| Cd | 0.02 ± 0.03 |
| As | 0.04 ± 0.04 |
| Se | 0.11 ± 0.02 |
| Mo | 0.69 ± 0.36 |
| Ni | 0.38 ± 0.01 |
| Pb | 0.02 ± 0.01 |
| Cu | 2.66 ± 1.23 |
| Co | 0.06 ± 0.01 |
| Cr | 0.01 ± 0.00 |
| Zn | 19.4 ± 2.10 |
| Fe | 11.0 ± 2.16 |
| Mn | 19.2 ± 1.71 |
| Na | 18.4 ± 2.85 |
Arsenic
According to the CODEX standards (1995), As is a commonly occurring metallic substance. Minerals are trapped in the earth's crust and are readily available from natural sources such as volcanic activity and the weathering of mineral salts and from human activities that emit into the environment, such as smelting, coal burning and specialised utilities, arsenic-based wood preservatives, pesticides or veterinary and human inhalants, etc. Many inorganic chemical forms including food are found in the biosphere as a result of the naturally occurring metabolic processes of As. Thus, As is generally found at very low levels in crops and livestock (usually 0–20 μg L−1). However, in rice and mushrooms, sometimes high levels of As are found. According to the toxicological guidelines, Provisional Tolerable Weekly Intake (PTWI) for As should be around 0.015 mg L−1 body weight. Chronic exposure to As causes severe human health problems such as cardiovascular diseases, different carcinomas, renal illnesses and peripheral vascular diseases (Diyabalanage et al., 2016).
Figure 2 shows the As concentration of traditional rice varieties found in Sri Lanka. When considering the box plots, there are some rice varieties that emerge as outliers and are above the maximum data range. As shown in Fig. 2, Motta Karuppu had an As concentration of 0.16 ± 0 mg kg−1. This implies the Motta Karuppu rice variety has the highest concentration of As compared to the other rice varieties. A recent study reported that new improved rice varieties contain much higher As concentrations compared to the traditional rice varieties. It has been reported that Cd elevations in rice in Bangladesh and Sri Lanka as well as in several Asian countries (Diyabalanage et al., 2016). Furthermore, according to the published reports a high level of As-contaminated rice was found in Bangladesh (Polizzotto et al., 2013; Diyabalanage et al., 2016). The amount of As present in rice varies greatly depending on local environmental variables. Rice has high levels of As and 80% of the inorganic form of As is presented in rice compared to other grain types (Polizzotto et al., 2013; Qaswar et al., 2022; Perera et al., 2023). However, in the current study, none of the studied traditional rice samples exceeded the recommended level of total As (300 μg L−1) for rice and inorganic As (200 μg L−1) by the Codex Committee on Food Additives and Pollutants. According to the results obtained from the current analysis, traditional rice varieties contain a mean As concentration of 45.5 ± 0 μg L−1 which does not exceed the permissible level.
Cadmium
In addition to the As, Cd has also been identified as a carcinogenic element by the International Agency for Research on Cancer (IARC). According to the Codex Committee on Food Additives and Contaminants (CCFAC), the maximum permissible level of cadmium for rice grain is 200 μg L−1 (FAO, 2013). The mean concentration of Cd (21.3 ± 0.35 μg L−1) in the traditional rice varieties was in the acceptable range according to the CCFAC. Cd has been identified as the main problem for Chronic Kidney Diseases (CKDu) and the amount of Cd in the kidney tubular cells increases during a person's lifespan and makes up the major part of the Cd contribution to the body (Bandara et al., 2008; Balali-Mood et al., 2021). The provisional tolerable weekly intake of Cd is 0.003 mg L−1 for an adult according to the WHO/FAO and the United States Environmental Protection Agency (USEPA). According to the toxicological guidance, the provisional Tolerable Weekly Intake (PTWI) of Cd should be around 0.007 mg L−1 body weight (Lien et al., 1902; Liang et al., 2019).
Cd is a relatively rare element that human activities release into the air, land and water. In general, the production and utilisation of Cd and the disposal of Cd-containing wastes are the two main sources of pollution. Increasing the amount of Cd in the soil increases the amount of Cd available in plants; the path of human exposure to increased Cd level (Bandara et al., 2008; Liang et al., 2019). Regular consumption of agricultural by-products may increase exposure to Cd intake as stated by International Programme on Chemical Safety (Redmon et al., 2014). It is reported that similar to humans, Cd levels in the liver and kidneys of horses and some wild animals are elevated with the consumption of agricultural by-products. High Cd concentration in rice is a widespread problem in many parts of the world, and this has become a critical problem in South Asian countries. It has also been found that rice bran has higher Cd levels than polished rice. Widespread use of phosphate fertilisers for paddy cultivation and polluted water were the main sources of Cd accumulated in irrigated rice grains (Lien et al., 1902; Bandara et al., 2008; Poutanen et al., 2022).
Even though the rice bran contains a high Cd concentration, the current study reveals that the traditional rice varieties contain a considerably low amount of cadmium (Fig. 2). Cd movement in the soil solution is sensitive to redox conditions and mobilisation under reduction conditions is more advantageous. This facilitates cadmium mobilisation and subsequent acquisition by the rice plant (Lien et al., 1902; Satarug, 2018). On the other hand, dry zone paddy in Sri Lanka is irrigated, which facilitates contact with cadmium oxides and/or oxyhydroxide of Fe and Mn which prevents prolonged sinking of Cd (Lien et al., 1902; Bandara et al., 2008; Diyabalanage et al., 2016). Phosphate fertilisers, especially superphosphate, are the main source of Cd in rice paddies, and Cd concentrations of 2.3 to 46 mg L−1 in triple superphosphate have been reported. The application of organic manure which contains phosphates could be the reason for having reduced Cd content in traditional rice varieties (Tahir et al., 2021).
Selenium
Apart from the toxic elements which are harmful to the human body, there are essential trace elements that have been identified as deficient all over the world for example selenium. Figure 2 shows the Se concentrations in traditional rice varieties tested in the current study. Rice is the main source of Se intake in Sri Lankan people. Twenty-five different seleno-proteins are essential for the human body, which act as antioxidants and detoxifying agents, such as glutathione peroxidase, thioredoxin reductase and chemoprotective agents. Recommended average Se levels vary by geographic area and recommended dietary allowance is 55 μg for both men and women (19–55 years of age). Se deficiency has been identified as a major health problem among 1 billion people around the world (Stoffaneller & Morse, 2015). In addition to that, Se deficiency has also recently been linked to CKDu in Sri Lanka (Selvarajah et al., 2016). Findings from the current study clearly showed that the Se content is considerably high (t-test; P = 0.0002) in some traditional rice varieties, which can be used as a major food source to overcome the Se deficiency problem around the world. The Se content of rice is determined by the geochemical content. Properties such as parent material, mineralogy, soil processes (pH, redox status, flood and submergence conditions), and plant genetics could influence the Se content (Li et al., 2016).
The physical significance of Se for higher plants has not yet been proven. Therefore, the Se content of the soil content does not affect the rice variety or yield. The flood situation in the paddy fields creates anaerobic conditions hence that the plants can uptake less amount of Se. The root system of plants takes the form of selenate and selenite and also as organic compounds through sulfate transporters in the original plasma membranes. Selenate and selenite are the major forms of Se for plants, with no elemental Se and no metal selenides to obtain for plants. Selenite is preferred under alkaline and oxic conditions and selenate is preferred in acidic and moderate soils with low oxic conditions (Li et al., 2016; Joy et al., 2017). However, the mobility and bioavailability of selenite are limited due to the high absorption relationship of clay minerals, organic compounds and hydroxides. Selenite depletion under submerged conditions may lead to a decrease in the ability of paddy soil to absorb Se, which can lead to a lower content of Se in rice in the wet zone compared to the dry zone of Sri Lanka. Therefore, the reason for different Se concentrations in studied rice varieties could be due to the paddy cultivating method and climatic zone. For instance, if the rice varieties are grown in a wet zone, low selenium concentrations could be expected due to the heavy rains and depletion of Se from the soil (Joy et al., 2017; Yao et al., 2020). However, the presence of high concentrations of selenium in traditional rice varieties tested in the current study could be due to the inherent genetic differences even though they were grown in the wet zone (Yao et al., 2020).
Other trace elements
The other minor elements are also identified in traditional rice varieties in small quantities apart from As and Cd. The concentrations of Cu, Mn, Zn and Fe were observed as the micronutrients for all studied samples as shown in Fig. 2 and their variations in Fig. 5. The order of the mean concentration of elements was Mn > Zn > Fe > Cu. This is the normal order of presentation of the elements based on the plant requirement which may vary from species to species and slightly among the varieties within a given species. In addition to that, some of the microelements such as lead were not significantly (P > 0.05) different among traditional rice varieties tested in the current study. Elements such as Se, Mo, Cr, Mn, Fe, Co, Cu and Zn are well known as micronutrients that help human biological systems to function properly, while non-essential elements such as Pb, As, Cd and Hg are not identified to have physiological functions and they have been identified as toxic to the human health if they are accumulated inside the body (Mitra et al., 2022).
The median concentration of elements in 104 traditional rice varieties (micro).
Provisional Tolerable Weekly Intake (PTWI) of Pb should be around 0.025 mg L−1 body weight according to the toxicological guidance. Results from the current study revealed that the mean concentration of Pb is not significantly different (t-test; P > 0.05) among traditional rice varieties found in Sri Lanka. The mean concentrations of Pb in traditional rice varieties are 0.018 mg L−1 (Mitra et al., 2022). This implies that the Pb concentrations are not considerably higher among the studied rice varieties according to the PTWI. Furthermore, the box plot results (Fig. 2) for Pb also consist of a few outliers. Though it is not significant, the highest value was recorded in the traditional variety ‘Suwadel’ (64.0 ± 1 μg L−1 of Pb).
It is important to understand the accumulation of minerals in rice grains as some of them are toxic and some are considered essential. Especially the toxic trace element can have a severe impact on the health of people who consume contaminated rice. Among these elements, Fe, Zn, Cu, Mo and B are considered to be essential trace elements for human health (Li et al., 2016; Mitra et al., 2022). It is expected that the knowledge of the nutritive value as well as other nutraceutical properties of traditional rice varieties in Sri Lanka would help to promote them in local and global markets and to encourage the local farmers to cultivate them on a large scale which may be also helpful to conserve their genetic variability and use them in future rice breeding programmes (Hänsch & Mendel, 2009; Korvela et al., 2018; Ravichanthiran et al., 2018; Al-Daej, 2022; Karunarathna et al., 2022). In addition, traditional rice varieties are genetically well known for thriving in harsh environmental conditions and new improved varieties have developed by altering the genetics to obtain high quality, high yields and disease and pest resistance in rice production (Polizzotto et al., 2013; Al-Daej, 2022).
Conclusions
The results obtained in this study increase our attention to trace element contents in traditional rice varieties commonly grown in Sri Lanka as they contain lower levels or negligible amounts of toxic elements which could harm human health. A multivariate data analysis method (Principle Component Analysis and Cluster Analysis) was used to identify the differences in trace elements and nutritional elements composition in traditional rice varieties, and ANOVA with a t-test was used to identify the single element variation among different types of traditional rice varieties. Accuracy was verified by high recovery of different element concentrations in certified reference materials.
Based on the results of descriptive statistics and multivariate analyses, it can be concluded that the toxic elements such as As and Cd content in traditional rice varieties are significantly low compared to the Provisional Tolerable Weekly Intakes (PTWI). The elevated levels of toxic elements, Cd and As in some of the traditional rice varieties such as Motta Karuppu, suggest the genetic variation in accumulating these elements. Most of the traditional rice varieties contain much lower concentrations according to the food standards (Codex Alimentarius) of toxic elements apart from the one variety called Motta Karuppu. In addition to those toxic elements, concentrations of 14 other elements such as As, Se, Mo, Cd, Cu, Ni, Co, Cr, Li, Al, Na, Ca, Ba, Sr and P were highly variable among traditional rice varieties found in Sri Lanka. Toxic elements such as As, Cd, Cr and Pb were identified with significantly low contents and they were below the recommended food standards (Codex Alimentarius). The trace elements such as Se, Mo, Cu, Ni, Li, Al and Se were identified as essential trace elements that are present in traditional rice varieties. Notably, several traditional rice varieties (i.e. Rathu Heenati, Pragathi Wee, Weda Heenati, etc.) contained high concentrations (≈250 μg L−1 DM, P < 0.05) of Se in the studied traditional rice varieties, and the mean values obtained for the rest of the traditional rice were 130 ± 0.4 μg L−1 on dry weight basis which is an essential trace element that is considered a deficient element among 1 billion people around the world.
Recommendations
Further studies should be carried out to evaluate the genetic variations within the rice varieties to check whether there is a genetic influence on the different elemental concentrations. The results of the new improved rice varieties (manuscript in progress) should be compared with the traditional rice varieties to get a holistic view of the elemental distribution of the rice that people consume worldwide. In addition to that, various types of paddy soils should be evaluated to check the effect of the soil type on the traditional rice varieties used in this study. Furthermore, the traditional rice varieties which are rich in essential elements could be promoted to cultivate among farmers. For instance, the variety called Rathu Heenati contains most of the essential macronutrients and micronutrients on an exceptional basis compared to all other traditional rice varieties. Hence, with the use of advanced technologies, attempts must be made to increase productivity and popularise such verities and to exploit their nutraceutical properties to make a healthy society and for value addition as well.
Conflict of interest
The authors have no conflict of interest to declare.
Ethical approval
Ethics approval was not required for this research.
Author contributions
Chamali Kodikara: Data curation (equal); formal analysis (equal); investigation (equal); methodology (equal); validation (equal); writing – original draft (lead); writing – review and editing (equal). Janak K. Vidanarachchi: Conceptualization (supporting); project administration (supporting); supervision (equal); writing – original draft (equal); writing – review and editing (equal). Sarath P. Nissanka: Resources (supporting). Jonas Bergquist: Project administration (equal); resources (lead); supervision (supporting); validation (supporting); visualization (equal). Jean Pettersson: Conceptualization (equal); data curation (supporting); formal analysis (supporting); investigation (supporting); methodology (supporting); supervision (lead); validation (equal); visualization (equal); writing – original draft (supporting); writing – review and editing (equal). Sarojini Jayantha Kumari A. Ubhayasekera: Conceptualization (equal); data curation (equal); investigation (equal); project administration (equal); resources (equal); supervision (equal); validation (equal); visualization (equal); writing – review and editing (equal).
Funding information
No external funding for the present study.
Peer review
The peer review history for this article is available at https://www.webofscience.com/api/gateway/wos/peer-review/10.1111/ijfs.16615.
Data availability statement
The data that support the findings of this study are available from the corresponding author upon reasonable request.
References
This paper gave some insights into how native rice differs from improved rice based on its mineral composition in different climatic zones in Sri Lanka which helped in gaining some insights on our current experiment.
This paper discussed how the mineral profile of rice could vary based on seasonal variations and the paper was used to discuss some of the results we obtained from our current study.
Method development and optimization for the analysed elements in rice samples were done following the methods used in this study. This paper helped to determine the internal standards that had to be used for the current study.
The information regarding most of the traditional rice varieties and their health benefits were mentioned in this paper and used as a reference to discuss the results of the current study.
