


Abstract
Grape skin, seed and flesh, a potential source of bioactive compounds, were investigated to discriminate Kyoho skin, seed and flesh antioxidant activities by solvent extraction using chemometrics, including multivariate, discriminant analysis (DA) and hierarchical cluster analysis (HCA). Multivariate analysis (Wilk's Λ = 0.02 × 10⁻⁴, P < 0.01) explained the discrimination behaviour of phenolics and antioxidants by different solvents. Moreover, DA with three discrimination functions (DFs) and HCA with three well-defined clusters (clusters 1 to 3) further demonstrated the differences and/or similarities among the solvents. Solvent I (75% ethanol: water) exhibited the different extraction process over the solvents IV (water) and III (acetone: water). Quercetin (39.25 mg kg−1), epicatechin (53.08 mg kg−1) and gallocatechin gallate (1.28 mg kg−1) were the major phenolic compounds in Kyoho skin, seed and flesh extracts, respectively. These further confirmed the chemometric approach that could be used to discriminate solvents. Therefore, these findings suggested the application of chemometrics in extraction studies to understand the role of solvents and high recovery of grape bioactive compounds.

Introduction
Grape residues (skin, seed and stalk) are abundant sources of phenolic and flavonoid compounds (Guaita & Bosso, 2019). The concentration of individual phenolic compounds in grapes is influenced by solvent selection, which affects physicochemical properties of phenolics in skin, seed and flesh. Therefore, the type of solvent and extraction is an important step in the processing of phytochemicals and to optimise the concentration of bioactive constituents. Cañadas et al. (2021) examined the effect of 14 hydrophobic eutectic solvents (e.g. ammonium salts, DL menthol and fatty acids) on the amount of extracted phenolic acids from winery waste. Thus, these studies supported the idea of variations in phenolic content as affected by solvent extraction. Hence, the effect of solvent extraction on discrimination of plant phenolic and bioactive compounds needs to be addressed using advanced mathematical and statistical methods (i.e. chemometrics).
Chemometrics is an interfacial discipline that interprets chemical information using different mathematical and statistical methods (Miladinović et al., 2021). More recently, these techniques are commonly used methods in the field of food science and technology to determine the quality evaluation of food products, such as sensory evaluation of espresso coffees (Belchior et al., 2019) and discrimination of two seaweed cultivars (Charles & Alamsjah, 2019). Similarly, there has been detailed investigation of solvent extraction and impact on bioactive compounds (Alcântara et al., 2019; Lim et al., 2019; Rafińska et al., 2019) but the solvent mechanism that underpins the discrimination behaviour of Kyoho skin, seed and flesh extracts using advanced chemometrics has remained a paucity of evidence. The clear understanding of the aforementioned recent studies persuaded us to use chemometric tools to discriminate bioactive compounds by solvent extraction. Thus, we selected Taiwanese commercial grape cultivar (Kyoho, Vitis labruscana) due to their high consumption and wider availability in local markets (Sridhar et al., 2020).
Therefore, the present study was conducted to investigate the discrimination behaviour of Kyoho skin, seed and flesh antioxidant activities by solvent extraction using advanced chemometric methods, such as multivariate statistical analysis, discrimination analysis and hierarchical cluster analysis. These findings are expected to contribute to the rapidly expanding field of chemometrics in food science and technology to determine the solvent discrimination behaviour, which might be useful for scale-up and regulate the efficiency of the extraction process from plant sources at an industrial level.
Materials and methods
Sample collection and preparation
Fresh Kyoho (Vitis labruscana) was purchased from the local market in Taiwan. Initially, the skins were peeled, separated and washed manually with distilled water (dH2O) at 25 °C for 30 s to remove external juice adhere to grape skins (Sridhar & Charles, 2019). After removing skins, fruits were vertically cut into two pieces per berry to separate seeds. Grape flesh pieces were further cut into small pieces for experimental analysis. Seeds were separated manually, washed with tap water and air-dried (Sridhar & Charles, 2019). Seeds were further blended in a domestic blender (Eupa TSK-9391, Tokyo, Japan) for 2 min at the interval of 0.25 min to prevent heating of the samples. Kyoho skin and flesh samples were grinded using a domestic blender.
Preparation of extracts
The extraction was conducted by different solvent systems, such as solvent I (75% ethanol: water (4:1 v/v)), solvent II (methanol: water (4:1 v/v)), solvent III (acetone: water (4:1 v/v)) and solvent IV (water) in a 10 g of Kyoho skin, seed and flesh, respectively, according to Annegowda et al. (2012). The samples were transferred to a 250 mL conical flask containing liquid–liquid solvent mixtures (solvents I to IV). After homogenisation, samples along with conical flasks were sonicated in the dark for 60 min (Delta Ultrasonic Cleaner, New Taipei City, Taiwan) at room temperature (25 ± 1 °C). Then, the extracts were filtered through muslin cloth and the mixtures were centrifuged (Universal 32 R centrifuge, Kirchlengern, Germany) at 3,000 × g for 15 min. Finally, the filtrate was concentrated in a rotary evaporator (A-1000 S, Eyela, Tokyo, Japan) at 45 °C under controlled vacuum.
Determination of polyphenol contents
Total phenolic content (TPC) was performed according to Moniruzzaman et al. (2014) with some modifications. Briefly, extracts (1 mL) were mixed with Folin–Ciocalteau’s phenol reagent (1 mL, 0.20 N in water). After 3 min of incubation, 1 mL of 10% Na2CO3 was added to the reaction mixture and incubated for 90 min at room temperature. The absorbance was measured at 725 nm using a DU 730® UV/Vis spectrophotometer (Beckman Coulter Inc., California, United States). TPC was measured with a gallic acid solution as standard and expressed as mg of gallic acid equivalent (GAE) per g sample fw (fresh weight).
Total flavonoid content (TFC) was determined following the Moniruzzaman et al. (2014) with some modifications. Briefly, sample extracts (1 mL) were mixed with NaNO2 (0.30 mL, 5% w/v) and incubated for 5 min at room temperature. Then, AlCl3 (0.30 mL, 10% w/v) was added, followed by the addition of NaOH (2 mL, 1 m) 6 min later. The reaction mixture was shaken, and the absorbance was measured at 510 nm using a DU 730® UV/Vis spectrophotometer. TFC was measured with a quercetin as standard and expressed as mg of quercetin equivalent (QE) per g sample fw.
Antioxidant activity
DPPH free radical scavenging activity
The DPPH free radical scavenging activity of Kyoho skin, seed and flesh extracts was measured using DPPH (2,2-diphenyl-1-picrylhydrazyl) free radicals in methanol (Sridhar & Charles, 2019). The inhibition percentage of DPPH radical scavenging activity was calculated according to the following equation (1):
where, Acontrol is the absorbance of control and Aextract/standard is the absorbance of extract or standard.
Free radical scavenging activity by the ABTS radicals’ assay
Free radical scavenging activity of the Kyoho skin, seed and flesh extracts was determined by adapting the method used by Sridhar & Charles (2019). The ABTS values were expressed as % inhibition using equation (1).
Hydrogen peroxide (H2O2) scavenging assay
The scavenging ability of Kyoho skin, seed and flesh extracts was determined by the procedure of Sroka & Cisowski (2003). The percentage inhibition of H2O2 radicals was calculated with the equation (1).
Total antioxidant activity (TAA)
The TAA of Kyoho skin, seed and flesh extracts was measured using the thiocyanate method (Charles & Huang, 2009). The results were calculated as a % TAA shown in equation (2).
Chemometric analyses
Multivariate analysis of variance (Manova)
Manova is a statistical tool that deals with several dependent variables at the same time. We performed the Manova based on the method described by Sridhar & Charles (2018) using IBM® SPSS® Statistics version 22.0 (IBM Ltd., Armonk, NY, USA).
Discriminant analysis (DA)
DA is a multivariate predictive model used to identify group membership based on linear combinations of the predictor variables (discriminant functions (DFs) or canonical vector). We demonstrated the application of DA using equation (3) according to Charles & Alamsjah (2019) and IBM® SPSS® Statistics version 22.0.
in which, DF = discriminant score, p = discriminant coefficients and X = discriminating variables.
Hierarchical cluster analysis (HCA)
HCA is an unsupervised method of cluster analysis designed to reveal groupings within experimental data. We performed the HCA method according to Sridhar & Charles (2018) in the following equation (4) using IBM® SPSS® Statistics version 22.0.
where, Ai and Bj are a distance between two samples or clusters
Quantification of phenolic compounds
The quantification of phenolic compounds in grape skin (solvent III), seed (water) and flesh (solvent I) extracts was performed using a high-performance liquid chromatography (HPLC) as described by Ivanova et al. (2011). A C18 reversed-phase analytical column (4.60 × 250 mm, 5 μm D) was used at 30 °C for the separation. The mobile phase consisted of (A) 1% acetic acid in water (v/v) and 1% acetic acid in methanol (v/v) (B), which were applied in the following gradient condition: 5%–20% B for 0-10 min, 20%–50% B for 10–45 min, 50%–80% B for 45–50 min and 80%–90% B for 50–60 min. The flow rate of the mobile phase was set at 0.20 mL min−1 and the detection wavelength to 280 nm. The samples were filtered with 0.45 μm filter and injected into the HPLC. Identified phenolic compounds were expressed as mg kg−1.
Statistical analysis
All experimental analyses were conducted in triplicate, and the values were expressed as mean ± standard deviation (SD). The IBM® SPSS® Statistics version 22.0 was used for the mean comparisons by Duncan’s multiple range post-hoc test (P < 0.05).
Results and discussion
Determination of total phenolic and flavonoid contents
Solvent III exhibited significantly (P < 0.05) higher TPC (16.15 mg GAE g−1) in Kyoho skin, whereas lower one was observed in solvent IV (7.09 mg GAE g−1) of Kyoho skin (Table 1). Similar levels of TPC in the skin and seed extracts of grape cultivar were observed by Iacopini et al. (2008). Solvents IV and II were extracted the highest (0.62 mg QE g−1) and the lowest (0.52 mg QE g−1) flavonoids in Kyoho seed extracts, whereas solvents I and IV presented a higher (0.36 mg QE g−1) and lower (0.17 mg QE g−1) TFC in Kyoho flesh extracts. TFC of Kyoho skin, seed and flesh extracted by different solvents exhibited the same trend as TPC (Table 1), and a similar trend of TPC and TFC was also observed by Do et al. (2014). The results indicated that the solvents extracted more phenolic compounds than flavonoids. A possible explanation for this might be the presence of a variety of phenolic compounds in extracts; moreover, another possible explanation for this complexity, the structure of phenolic compounds and type of solvents also contributed to the recovery of phenolics from plant extracts.
Total phenolics and flavonoids of Kyoho skin, seed and flesh extracted by different solvents1
| Solvent | Total phenolic content (mg GAE g−1) | Total flavonoid content (mg QE g−1) | ||||
|---|---|---|---|---|---|---|
| Skin | Seed | Flesh | Skin | Seed | Flesh | |
| 75% ethanol: water (4:1 v/v) | 7.90 ± 1.65a | 18.39 ± 0.62b | 0.63 ± 0.04b | 0.62 ± 0.04ab | 0.52 ± 0.01b | 0.36 ± 0.01d |
| Methanol: water (4:1 v/v) | 12.85 ± 1.16a | 14.95 ± 2.59a | 0.57 ± 0.03b | 0.58 ± 0.01a | 0.50 ± 0.01a | 0.26 ± 0.01b |
| Acetone: water (4:1 v/v) | 16.15 ± 1.25b | 16.35 ± 0.85ab | 0.59 ± 0.03b | 0.63 ± 0.01b | 0.60 ± 0.01c | 0.31 ± 0.01c |
| Water | 7.09 ± 0.90a | 18.79 ± 0.60b | 0.44 ± 0.03a | 0.60 ± 0.05ab | 0.62 ± 0.02d | 0.17 ± 0.01a |
1Values are expressed as mean ± standard deviation (n = 3). Means in the same column followed by different superscripts are significantly different, F18,9 = 350.26 (P < 0.05, Duncan’s multiple range test). GAE, Gallic acid equivalents and QE, Quercetin equivalents.
Antioxidant activity
DPPH radical scavenging activity
Solvent III showed the highest DPPH radical scavenging activity (87.33%) in Kyoho skin extracts, and solvent IV exhibited the highest inhibition in Kyoho seed extracts (92.69%) as shown in Figure 1a. Kyoho flesh extracts demonstrated the highest inhibition capacity in solvent I (89.14%) and the lowest in solvent IV (47.34%). In the case of Kyoho seed, solvents III and IV presented the highest DPPH scavenging activity, which was statistically insignificant (P > 0.05) and the lowest was reported in solvent II. Singha & Das (2015) studied DPPH scavenging activity of four grape (Vitis vinifera) skin cultivars in liver tissue (ex vivo) and reported that DPPH scavenging activity ranged from 44% to 58% in different grape cultivars, which was found to be lower in our study. It seems possible that these similar trends were due to their hydrogen donating ability that is often extracted by solvents in other studies of different cultivars.
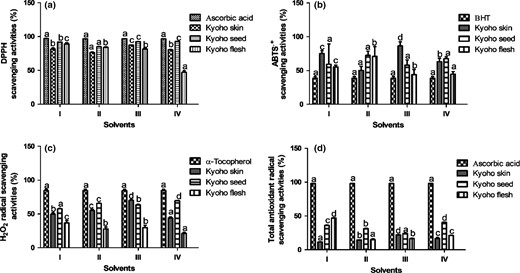
Free radical scavenging activity of grape skin, seed and flesh extracts. (a) DPPH radical scavenging activity, (b) ABTS radical scavenging activity, (c) H2O2 radical scavenging activity and (d) total antioxidant radical scavenging activity. Values were expressed as mean ± standard deviation (n = 3). Error bar represents the standard deviation from the mean of three independent determinations. Lowercase alphabets (a-d) represent significant difference (P < 0.05) from each other based on Duncan’s multiple range test. Solvent I = 75% ethanol: water (4:1 v/v), solvent II = methanol: water (4:1 v/v), solvent III = acetone: water (4:1 v/v), and solvent IV = water. DPPH = 2,2-diphenyl-1-picrylhydrazyl, ABTS = 2,2'-azinobis-(3-ethylbenzothiazoline-6-sulphonic acid), BHT = butylated hydroxytoluene, and H2O2 = hydrogen peroxide.
Free radical scavenging activity by the ABTS radicals’ assay
Kyoho skin, seed and flesh extracts showed a high capacity of ABTS radical scavenging activity (Figure 1b). Solvents III and II extracts demonstrated a higher (86.48%) and lower (50.22%) ABTS radical scavenging activity for Kyoho skin extracts; moreover, solvents I, II and IV extracts possessed the highest and the lowest scavenging capacity of ABTS radicals for Kyoho flesh extracts. Similarly, other studies have revealed that the Kyoho seed scavenging capacities of DPPH and ABTS were found to be significant in 12 grape varieties grown in Turkey (Yemis et al., 2008). Based on the results, solvents used in the extraction experiments had significant effects (P < 0.05) on ABTS radical scavenging activity due to the presence of the bioactive phenolic and non-phenolic compounds.
Hydrogen peroxide (H2O2) scavenging assay
Kyoho skin extracts showed the lowest inhibition (43.94%) in solvent IV and the highest inhibition (70.10%) in solvent III (Figure 1c). Furthermore, Kyoho seed extracts exhibited the highest inhibition (69.56%) in solvent IV, whereas the lowest inhibition (57.51%) was observed in solvent I. Keser et al. (2013) reported % H2O2 scavenging activity of seeds in water and ethanol extracts of grape varieties. They suggested that seed extracts showed 45.71% and 54.88% H2O2 scavenging activity in water and ethanol, respectively. Our findings in Kyoho skin and seed extracts showed a higher scavenging activity than studies reported. These higher inhibitions in our study could be attributed to grape variety, phenolic composition, environmental factors and water stress (Pinasseau et al., 2017). The results suggested that the extracts are better for showing H2O2 radical scavenging activity.
Total antioxidant activity (TAA)
Solvent III extracts showed the highest inhibition (22.09%) compared to other solvents used in Kyoho skin extracts (Figure 1d). Moreover, solvents IV and I exhibited the best lipid peroxidation inhibition in Kyoho seeds and skins, respectively. The results of the experiment found clear support for the study conducted by Loganayaki et al. (2013) and reported that the inhibition capacity of extracts (41.30%–54.60%) was significantly lower than those of positive control (88%), which was likely comparable in our study. These outcomes proved that solvents III, IV and I were more effective for extraction of antioxidants from Kyoho skin, seed and flesh extracts, respectively.
Based on the high recovery of antioxidant activities, our findings conclusively recommended the solvents III (acetone: water), IV (water) and I (75% ethanol: water) for the better extraction of bioactive compounds from Kyoho skin, seed and flesh extracts, respectively. These findings may be considered as theoretical due to lack of proper statistical and mathematical evidence on how extracting solvent influencing on discrimination behaviour of Kyoho (skin, seed and flesh) bioactive compounds. Therefore, this needs to be addressed using the application of advanced chemometrics. Moreover, individual phenolic compounds were identified in Kyoho skin, seed and flesh extracts.
Chemometric analyses
Multivariate analysis of variance (Manova)
The significant relationship (P < 0.01) was confirmed by four different commonly employed Manova statistical tests (Table 2), including Pillai's trace (1.99), Wilk's Λ (0.02 × 10⁻⁴), Hotelling–Lawley trace (1756.07) and Roy’s largest root (1447.32) in terms of phenolics and antioxidant activities. These Manova significant tests demonstrated the influence of solvents on each Kyoho polyphenolic and antioxidant activities. In-depth analysis of literature on Manova revealed the importance of all four statistical tests to prove hypotheses; however, to understand the effect of solvents and to avoid errors (e.g. type 1 error in Roy’s largest root), we computed the test of homogeneity of variance (Levene’s test of equality of error variances) for all dependent variables within Manova. Levene’s computation analysis (F(2, 6) = 0.09 to 0.39, P > 0.05) documented the interesting findings to select the best statistical test, which undoubtedly predicted the influence of solvent on polyphenolic and bioactive compounds. Thus, based on Levene’s computation analysis, Wilks’s Λ significant test (F(12,2) = 111.46, P < 0.01, Λ = 0.02 × 10⁻⁴) explained the variation of phenolic and antioxidant activities as affected by solvents. Many recent studies investigated the effect of solvent and extraction on phenolic and bioactive compounds (Alcântara et al., 2019; Lim et al., 2019; Rafińska et al., 2019) but completely failed to understand the solvent effect in discrimination of phenolic and bioactive compounds using chemometrics. However, a study by Sridhar & Charles (2018) exclusively recommended the Wilks’s Λ significant test when explaining MANOVA results, which was in line with our investigation. Studies on solvent extraction and influence on bioactive compounds can be an inappropriate approach without proper statistical and mathematical evidence, which leads to false conclusions and also influences the research community in the future. Therefore, we suggested the application of chemometric techniques; for instance, Wilk's Λ MANOVA statistical test (chemometric techniques) was used for understanding the role of solvent in polyphenolic and antioxidant studies.
Multivariate general linear analysis of Kyoho skin, seed and flesh extracts§
| Test | Value | F- value | Hypothesis df | Error df | P-value |
|---|---|---|---|---|---|
| Pillai’s Trace (P) | 1.99 | 169.78 | 12 | 4 | <0.0001 |
| Wilks’ Lambda (Λ) | 0.02 × 10⁻⁴ | 111.46† | 12 | 2 | <0.01 |
| Hotelling–Lawley Trace (H) | 1756.07 | 0 | 12 | 0 | <0.01 |
| Roy’s Largest Root (R) | 1447.32 | 482.44‡ | 6 | 2 | <0.01 |
†Exact statistic.
‡The statistic is an upper bound of F that yields a lower bound on the significance level.
§df is degree of freedom.
Discriminant analysis (DA)
DA was applied to analyse the variation in phenolics and antioxidant activities of Kyoho skin, seed and flesh extracts as affected by solvent extraction. Higher eigenvalues (1447.36 and 308.74) and canonical correlations (1 and 0.99) of DFs for Kyoho skin, seed and flesh extracts are shown in Table 3. These values explained the 100% variation associated with discrimination functions by means of two functions: functions 1 (82.40%) and 2 (17.60%) as presented in Table 3. The significance levels between these functions were further evaluated by Wilks’ Λ and chi-square tests (Table 4), and the results were highly significant among the DFs for Kyoho skin, seed and flesh extracts. Higher discrimination ability for the classification of Kyoho extracts revealed the effect of solvent extraction to discriminate each other. Moreover, classification function coefficients were calculated to discriminate Kyoho skin, seed and flesh extracts using Fisher’s linear DFs. The relative contribution of each parameter was explained by three statistically significant DFs (DFs 1-3) according to equations (5–7).
where, DFs = discrimination functions, TPC = total phenolic content, TFC = total flavonoid content, DPPH = 2,2-diphenyl-1-picrylhydrazyl, ABTS = 2,2'-azinobis-(3-ethylbenzothiazoline-6-sulphonic acid), H2O2 = hydrogen peroxide, TAA = total antioxidant activity, NOSA = nitric oxide radical scavenging activity, and †variables failed in tolerance test due to zero within-groups variance.
Eigenvalues and canonical correlation of discriminant functions for Kyoho skin, seed and flesh extracts
| Function | Eigenvalue† | Variance (%) | Cumulative (%) | Canonical correlation |
|---|---|---|---|---|
| 1 | 1447.36 | 82.40 | 82.40 | 1 |
| 2 | 308.74 | 17.60 | 100 | 0.99 |
| Function | Eigenvalue† | Variance (%) | Cumulative (%) | Canonical correlation |
|---|---|---|---|---|
| 1 | 1447.36 | 82.40 | 82.40 | 1 |
| 2 | 308.74 | 17.60 | 100 | 0.99 |
†First two canonial discriminant functions were used in the analysis.
Wilks’ Λ and chi-square values of discriminant test functions for Kyoho skin, seed and flesh extracts†
| Test of Functions | Wilks’ Λ | χ2 value | df | P-value |
|---|---|---|---|---|
| 1 through 2 | 0.02 × 10⁻⁴ | 45.55 | 12 | <0.0001 |
| 2 | 0.003 | 20.07 | 5 | 0.001 |
| Test of Functions | Wilks’ Λ | χ2 value | df | P-value |
|---|---|---|---|---|
| 1 through 2 | 0.02 × 10⁻⁴ | 45.55 | 12 | <0.0001 |
| 2 | 0.003 | 20.07 | 5 | 0.001 |
†df is degree of freedom.
Presence of three significant DFs might be the consequences of solvents (solvents III, IV and I) used for the extraction of Kyoho skin, seed and flesh bioactive compounds. This proved the influence of solvents in discrimination of Kyoho extracts. Therefore, it was obvious to notice positive and negative magnitudes in discriminating Kyoho skin, seed and flesh extracts as affected by solvent extraction; for example, phenolic content and DPPH activity were positively contributed in discrimination of Kyoho skin, seed and flesh extracts, while TFC and ABTS activity were negatively contributed. Moreover, DFs (DF2 and DF3) reported almost similar discrimination score that of DF1 in discriminating Kyoho skin, seed and flesh extracts (equations 5–7). The relationship between solvents and phenolics as well as antioxidant properties of Kyoho skin, seed and flesh extracts (canonical discriminant function coefficients) further explained by two correlation functions, which ranged from −1.78 to 2.71 (Table 5). It is somewhat surprising that ABTS antioxidant activity was influenced less in discrimination, which might be due to different solvents used in extraction of Kyoho skin, seed and flesh bioactive compounds. These solvents were failed to extract equal amounts of bioactive compounds from Kyoho skin, seed and flesh extracts and thus confirmed the effect of solvents in discrimination of Kyoho skin, seed and flesh extracts. Although we performed the repeated extraction process (thrice), slight differences were observed in the visual appearance of Kyoho skin, seed and flesh residues. This observation in solvent extractability could be attributed to differences in recovery of bioactive compounds from Kyoho skin, seed and flesh extracts. No scientific evidence has been reported on the influence of solvent extraction on discrimination behaviour using DA; however, more recently, we conducted few investigations on the discrimination ability of grape extracts (Sridhar & Charles, 2018) and seaweed cultivars (Charles & Alamsjah, 2019). Studies on influence of solvent extraction on bioactive compounds probably uncertain without understanding the discrimination behaviour using chemometrics. Therefore, based on their findings and those of our study, this is the cornerstone investigation to discriminate antioxidant activities as affected by solvent extraction. These findings further suggested that the solvent selection is a critical step in discrimination of Kyoho skin, seed and flesh bioactive compounds.
Standardised canonical discriminant function coefficients between solvent and phenolics and antioxidant properties of Kyoho skin, seed and flesh extracts†
| Parameter | Functions | |
|---|---|---|
| 1 | 2 | |
| Extraction yield | 2.71 | −0.17 |
| Effectiveness | −1.10 | 0.21 |
| Total phenolic content | 0.61 | 0.52 |
| Total flavonoid content | −1.78 | 0.80 |
| DPPH radical scavenging activity | 1.69 | −0.72 |
| ABTS free radical scavenging activity | −1.69 | 0.32 |
| Hydrogen peroxide scavenging activity | Variables failed in tolerance test due to zero within-groups variance | |
| Total antioxidant activity | ||
| Nitric oxide radical scavenging activity | ||
†DPPH = 2,2-diphenyl-1-picrylhydrazyl and ABTS = 2,2'-azinobis-(3-ethylbenzothiazoline-6-sulphonic acid).
Hierarchical cluster analysis (HCA)
The results of HCA proved the presence of three well-defined clusters based on different solvents, which indicated the divergences of solvents used (Figure 2). Generally, HCA groups clusters based on their similarity with less information than principal component analysis (Patras et al., 2011). This is the reason to consider unsupervised HCA for the analysis of this data. The first cluster (cluster 1) included the solvent I extracts, whereas clusters 2 and 3 were grouped together with two sub-clusters containing solvents IV and III. It was important to emphasise that clusters 2 and 3 contained similarities associated with phenolic and in vitro antioxidant activities compared to cluster 1. It is interesting to compare HCA results with DA (equations 5–7), where DFs (DF2 and DF3) showed similarities over the DF1 in discriminating Kyoho skin, seed and flesh extracts based on solvents. Moreover, these differences observed in HCA were in association with the results obtained by other chemometric techniques (MANOVA and DA) used in this study. The observed tendencies or similarities in cluster analysis could be the results of extracted solvents that extremely influenced on discrimination of Kyoho skin, seed and flesh extracts. Almost 4 years ago, Teofilović et al. (2017) formulated a central idea of using chemometrics on their study on the antioxidant capacity of basil extracts using different solvents and found it useful for discrimination of plant extracts based on selected solvents. Our findings suggested that the solvent I (75% ethanol: water) reported the different effect on the extraction process over the solvents IV and III (Figure 2), which contributed to the discrimination of Kyoho skin, seed and flesh extracts. It is an important criterion to include chemometric techniques for any solvent extraction studies in addition to phenolic and antioxidant activity studies for better understanding and grouping of solvents. Solvent extraction and comparison studies to recommend the best solvent might be the inappropriate approach to draw plausible conclusions without chemometrics. Hence, we recommend the use of chemometric techniques for any solvent extraction studies. The relevance of using HCA to discriminate Kyoho skin, seed and flesh extracts based on solvents is clearly supported by the current findings and provided the evidence in the application of unsupervised HCA for critical analysis of solvent extraction and its effects on bioactive compounds.
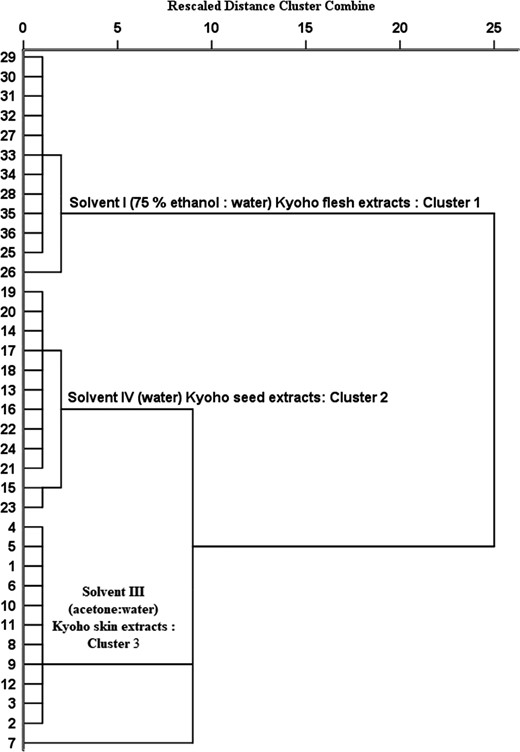
Dendrogram of hierarchical cluster analysis of Kyoho skin, seed and flesh extracts as affected by solvent extraction. Note: 1–12: Solvent III (acetone:water) Kyoho skin extracts; 13–24: Solvent IV (water) Kyoho seed extracts, and 25–36: Solvent (75% ethanol:water) Kyoho flesh extracts.
Quantification of phenolic compounds
The individual phenolic compounds of Kyoho skin, seed and flesh extracts are shown in Table 6. In grape skin extracts, resveratrol (10.39 mg kg−1), myricetin (11.34 mg kg−1), quercetin (39.25 mg kg−1) and rutin (13.81 mg kg−1) were the main phenolic compounds. These compounds found in grape seed extracts were significantly (P < 0.05) lower than grape skin extracts. Epicatechin, epigallocatechin and gentisic acid were not detected in grape skin extracts, while grape seed extracts reported a significant amount of epicatechin (53.08 mg kg−1), epigallocatechin (25.07 mg kg−1) and gentisic acid (10.63 mg kg−1). Many phenolic compounds were found to be undetected in grape flesh extracts, which indicated that the major phenolic constituents are predominantly present in grape skin or seed extracts. However, grape flesh extracts reported the presence of ferulic acid, which was found to be undetected in grape skin or seed extracts. The presence of these phenolic compounds in grape skin, seed and flesh extracts were in accordance with the phenolic compounds available in different grape skin, seed and pulp extracts (Pantelić et al., 2016). The presence of major phenolic compounds, such as gallic acid, catechin and epicatechin in grape skin and seed extracts, were also reported by Dabetić et al. (2020). However, it is important to note that each grape cultivar has its unique set of phenolic compounds based on differences in cultivars, environmental conditions and harvesting time. Therefore, these differences might have influenced the phenolic compounds in grape skin, seed and flesh extracts compared to available literature. Overall, the wide variety of phenolic compounds could contribute to high antioxidant potential and their utilisation in food processing industries.
Contents of individual phenolic acids in Kyoho skin, seed and flesh†
| Phenolic compounds (mg kg−1) | Skin | Seed | Flesh |
|---|---|---|---|
| Gallic acid | 3.36b | 40.36c | 0.12a |
| Epicatechin | ND | 53.08 | ND |
| Catechin | 5.39a | 47.81 | ND |
| Catecchin-3-gallate | 0.78a | 54.83b | ND |
| Epigallocatechin | ND | 25.07b | 0.41a |
| Ferulic acid | ND | ND | 0.99 |
| CGentisic acid | ND | 10.63 | ND |
| Resveratrol | 10.39 | ND | ND |
| Myricetin | 11.34b | 1.08a | ND |
| Quercetin | 39.25b | 18.03a | ND |
| Rutin | 13.81c | 2.04b | 0.28a |
| Gallocatechin gallate | 4.13b | 20.17c | 1.28a |
| Protocatechuic acid | 0.41b | 2.18c | 0.10a |
ND, not detected.
†Different lower-case letters in the same row were significantly different (P < 0.05) from each other based on Duncan’s multiple range test.
Conclusions
The findings of this study showed that chemometric techniques (Wilks’s Λ = 0.02 × 10⁻⁴, P < 0.01, three DFs and 3 clusters) reported variations in antioxidant activity of Kyoho extracts as affected by solvent type. These techniques revealed the influence of solvent systems on the recovery of bioactive compounds, which could accurately select the most suitable extracting solvent. Quercetin, epicatechin and gallocatechin gallate were the major phenolic compounds in Kyoho skin, seed and flesh extracts, respectively. The current data further highlighted the importance of chemometrics in easy interpretation of similarities and differences in solvent types, which may not be possible without chemometrics. Therefore, chemometrics is the mainstay of solvent extraction studies that used to retrieve complex information that can lead to the selection of suitable extracting solvent. Thus, we recommend solvent extraction studies coupled with chemometrics to strengthen the data obtained from solvent extraction for better applicability in pharmaceutical, chemical and food processing industries.
Acknowledgments
The authors wish to acknowledge the TaiwanICDF for the fellowship to Dr. Kandi Sridhar, and Mr. Ribesh Dhungana, for technical assistance.
Conflict of interest
The authors declare no conflict of interest.
Author contributions
Kandi Sridhar: Data curation (lead); Formal analysis (lead); Investigation (lead); Methodology (lead); Software (lead); Validation (equal); Visualization (equal); Writing-original draft (lead). Albert Linton Charles: Conceptualization (lead); Formal analysis (supporting); Funding acquisition (lead); Project administration (lead); Resources (lead); Supervision (lead); Validation (equal); Visualization (equal); Writing-review & editing (lead).
References
This study focused on the phenolic profile and solvent extraction. We used this study to compare with our findings.
We used this study to compare findings from chemometric analysis.
We used this study to compare our findings.
We used this study to compare antioxidant activities of our findings.
