


Abstract
The aim was to optimise the yield of co-precipitation of whey protein isolate (WPI) and pea protein isolate (PPI) and compare co-precipitates and protein blends with respect to solubility. The yield of co-precipitates was tested with different protein ratios of WPI and PPI in combination with different temperatures and acid precipitation (pH 4.6). The highest precipitation yield was obtained at protein ratios WPI < PPI, high temperature and alkaline protein solvation. The solubility was measured by an instability index and absorption spectroscopy of re-suspended precipitated proteins at pH 3, 7 and 11.5. Co-precipitates had significantly lower solubility than protein blends. Protein ratios WPI > PPI, low precipitation temperature and high pH showed the highest solubility. Differences in protein composition between co-precipitates and protein blends were observed with SDS-PAGE and matrix-assisted laser desorption ionisation time-of-flight, and indicated different protein–protein interaction in samples, which needs further investigations.
Introduction
Increasing demand for high-quality food-grade protein, which possess both good nutritional and functional properties, is challenging. Animal proteins are considered to be high-quality protein (de Gavelle et al., 2017), but are expensive in production costs with an energy input to protein ratio 14:1 (Pimentel & Pimentel, 2003). Plant protein may be an economical option for meeting this arising protein scarcity (Sharif et al., 2018). However, a direct use of plant-derived protein in a nutritional perspective is not optimal as essential amino acids requirements are not met. Furthermore, anti-nutritional factors compromise the protein bioavailability (Gilani et al., 2005). Nonetheless, in combination with animal protein, all nutritive requirements can be met in a sustainable way (Henchion et al., 2017).
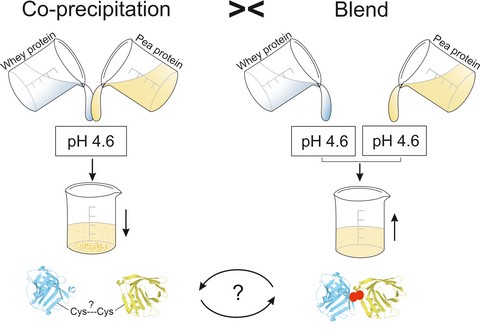
Animal and plant proteins have been combined by heat-induced co-aggregation, which shows the potential of new functional ingredients (Roesch & Corredig, 2005; Chihi et al., 2016) or co-precipitation, where interactions are induced by the combination of isoelectric focusing and heat (Thompson, 1977; Thompson, 1978; Kebary, 1993; Alu'datt et al., 2012). Co-precipitation has been performed with whey protein and several plant proteins, including rapeseed (Thompson, 1977), cottonseed (Thompson, 1978; Thompson et al., 1979) and soybean (Thompson, 1978; Kebary, 1993; Alu'datt et al., 2012).
Products of co-precipitation have shown interesting improvements of functional properties compared with the single protein; especially the solubility of plant protein is positively affected (Thompson, 1977; Kebary, 1993; Alu'datt et al., 2012). Soybean flour and cottage cheese whey have been co-precipitated by the combination of isoelectric (pH 4.7) and heat treatments (98 °C for 30 min), and the process resulted in high protein recovery (92%) and superior nutritional value compared with the extracted soybean protein (Loewnstein & Paulraj, 1971; Thompson, 1977). However, the yield of co-precipitation has not been satisfactory, especially in more recent publications, for example, Alu'datt et al. (2012) obtain a yield of maximum 35% at 98 °C. Thompson (1977) shows that isoelectric co-precipitation between whey and rapeseed concentrate improves the protein yield by 8–14% compared with the single products indicating synergistic effects. Along with different functionalities of co-precipitates compared with the whey or plant proteins alone, this suggests interactions between the proteins in the co-precipitates. Whether it is the effect of co-precipitation or the effect of simple blending of proteins is not clear. Thompson et al. (1979) report no difference of functional properties between cottonseed and cheese whey co-precipitates compared with mixtures of the two protein sources when prepared using sodium hexametaphosphate as a co-precipitating agent. Co-precipitation of cottonseed–cheese whey improves the solubility (31.9%) compared with cottonseed (28.7%), but is far from the solubility of whey alone (88.6%). Also blends of cottonseed and cheese whey show higher solubility (34.4%) than its co-precipitates. This suggests that the overall reported improvement of the co-precipitates is not a result of the co-precipitation itself, but the result of protein interactions occurring by blending of proteins (Thompson et al., 1979).
Overall, the literature of co-precipitates of mixed sources is limited, especially recent literature, and literature on the relation between co-precipitates and protein mixtures is even scarcer. In addition, pea protein has never been described in co-precipitates with whey protein, but serve as a protein-rich, anti-allergenic alternative to soybean protein in food applications (De Graaf et al., 2001). The aim of this study was to optimise the precipitation yield as well as studying the effect of the precipitation process in terms of protein nativity, protein solubility and composition. Whey protein isolate (WPI) and pea protein isolate (PPI) were isoelectrically co-precipitated. A comparison between co-precipitates of whey and pea proteins and blends of the same proteins precipitated separately in the same ratios was made to investigate the effect of co-precipitation.
Materials and methods
Materials
Pea protein isolate Pisane® F9 (~90% protein, <6% ash) was kindly donated by Procudan A/S (Kolding, Denmark), representing the manufacturer of pea protein Cosucra (Warcoing, Belgium). Whey protein isolate Lacprodan® DI-9224 (~92% protein, <0.2% fat, <0.2%) was kindly donated by Arla Foods Ingredients (Viby J, Denmark). Protein isolates were stored at 4 °C. Other chemicals were of analytical grade, and all solutions were prepared using deionised (18.2 MΩ) filtered water (0.22 μm) (Millipore SAS, Molsheim, France).
Preparation of protein dispersions for precipitation
Protein isolates were dissolved to a protein concentration of 10 g/L in deionised water based on the protein content of the two isolates declared by the manufacturer. Dissolved protein isolates had pH 6.5 and 6.0 for WPI and PPI, respectively, where the proteins are supposed to be in their native form. Solutions were stirred for 30 min and were adjusted to pH 11 with 6 m NaOH. Solutions were then stirred for 2 h to ensure complete hydration.
Co-precipitation of whey protein isolate and pea protein isolate
Co-precipitates were made from protein dispersions and mixed as follows: WPI:PPI 20:80, 50:50, 80:20 (v/v). Samples were co-precipitated by isoelectric focusing or a combination of isoelectric focusing and heat. Samples were adjusted to pH 4.6 with 3 m HCl and either left overnight at 4 °C to fix the precipitation or subsequently heat-treated. Samples (13 mL) were heat-treated in heat cabinets at 60, 80 or 98 °C for 30 min, and left at 4 °C overnight. After precipitation, samples were centrifuged at 4400 g for 30 min. The resulting pellet was freeze-dried (freezedryer CoolSafeTM, Scanvac, LaboGene A/S, Allerød, Denmark coupled to a vacuum pump, Vacuubrand MV 2NT, Wertheim, Germany) and stored at −20 °C. These samples will be referred to as co-precipitates, Co. The precipitation was performed in four replicates.
In order to elucidate any effects of the co-precipitation, WPI and PPI were precipitated separately (as controls), centrifuged and freeze-dried as described. Hereafter, precipitated WPI and PPI were mixed in the same ratios as the co-precipitates, hence, WPI:PPI 80:20, 50:50, 20:80 (w/w) in order to obtain protein blends (hereafter referred to as blends, Bl.) for comparison.
Yield of co-precipitation
The precipitation yield was evaluated as a measure of efficiency of the co-precipitation process. The yield (%) is calculated as the weight of the precipitate (g) over weight of sample (g) ×100%. The weight of the precipitate was weighed on an analytical balance (Mettler Toledo, Switzerland) after freeze-drying, and the weight of the sample was calculated based on the protein concentration and the sample volume as 10 g protein/L × 0.013 L.
The effect of alkaline dissolving of protein isolates on precipitation yield was evaluated by precipitation of dissolved WPI in water (pH 6.5), and PPI in water (pH 11). High pH was needed to dissolve PPI. Protein isolates were dissolved in water to a concentration of 10 mg protein/mL. Protein dispersions were stirred for 30 min, and pH of the PPI solution was adjusted to pH 11 with 6 m NaOH. No pH adjustment for WPI was performed. Solutions were then stirred for 2 h. WPI was precipitated alone and together with PPI in a 50:50 ratio and the mixing gave pH 10. Samples were heat-treated at either 4 or 80 °C for 30 min and left at 4 °C overnight. After precipitation, samples were handled as described in the previous section. The precipitation was performed in triplicates.
Protein structure
Changes in tertiary structure upon pH changes were measured by fluorescence spectroscopy. Tryptophan excitation was performed at 298 nm, and emission spectra were obtained from 305 to 450 nm with a resolution of 0.5 nm (Dalsgaard et al., 2007) in a 1 × 0.1 cm quartz cell using a LS 50B spectrofluorometer from Perkin-Elmer (Beaconsfield, England). WPI and PPI were dissolved in water to a concentration of 0.05 g/L, as described above, and continuously stirred during pH changes. pH was increased to pH 11 and after 5 min, emission spectra were acquired. Finally, pH was adjusted to pH 6.8 to reach neutral pH for both samples, and samples were measured at 0, 1, 2 and 24 h. Background spectrum of water was subtracted from the sample spectra. The experiment was performed in triplicates.
Instability index by LUMiFuge
Instability index was measured by a LUMiFuge (LUM GmbH, Berlin, Germany). Protein (1 g/L) was dissolved in 100 mm sodium phosphate buffer at pH 3, 7 or 11.5 and shaken for 4 h. Prior to analysis, the samples were gently mixed by turning the tube several times and 400 μL was transferred to LUMiFuge sample cells. The samples were centrifuged at 36 and 2325 g until stability was reached at room temperature. Transmission was measured at 865 nm. Instability index was calculated using the LUMiFuge software SEPView. The experiments were performed in minimum triplicates.
Solubility
The solubility of freeze-dried protein was measured as remaining protein in the supernatant after centrifugation at 2346 g in a table centrifuge (Eppendorf centrifuge 54I7R, Hamburg, Germany). Protein (1 g/L) was dissolved in 100 mm phosphate buffer at pH 3, 7 or 11.5 and shaken for 4 h. Protein content in the supernatant was determined by absorbance measurements on a plate reader (Syngery2, BioTek, Winooski, USA) at λ = 280 nm. Results were calculated using an external calibration curve (0.025–1 g/L) for each protein ratio (WPI:PPI 80:20, 50:50 and 20:80 (v/v)) and controls (WPI and PPI). Two dispersions were made per sample, and these were measured in duplicates.
Turbidity measurement
Solubility was also estimated by turbidity measurements. Freeze-dried co-precipitates, protein blends and controls were dispersed at a concentration of 1 g/L for 4 h in 100 mm sodium phosphate buffer at pH 3, 7 and 11.5. Turbidity of unsettled dispersions was measured spectrophotometrically as absorbance units (AU) on a plate reader (Syngery2, BioTek, Winooski, USA) at λ = 600 nm in microtiter plates with a sample volume of 200 µL. Two dispersions were made per sample, and these were measured in duplicates.
Sodium dodecyl sulphate polyacrylamide gel electrophoresis
Protein composition was visualised by sodium dodecyl sulphate polyacrylamide gel electrophoresis (SDS-PAGE), which was performed as described by Laemmli (1970) using Bio-Rad Criterion™ TGX™ 4-15% precast gels. Freeze-dried protein of co-precipitates, blends and isolates was dispersed at pH 3, 7 and 11.5 and studied with no removal of insoluble particles or removal by centrifugation at 2346 g. The samples were mixed 1:1 with sample buffer (20 mm Tris, 2% SDS, 20% glycerol, bromophenol blue), reduced with 1/10 vol. 0.2 m dithioerythritol (DTE), and heated at 95 °C for 2 min. Samples were loaded onto the gel with no adjustment in relation to protein content, as gels should reflect the changed solubility. Gels were stained with Coomassie Brilliant blue G-250. A pre-stained broad range molecular weight marker (ThermoScientific, Massachusetts, USA) was added in one lane to visualise the band position of known molecular masses.
Peptide mass fingerprinting by matrix-assisted laser desorption/ionisation time-of-flight and MS/MS
Proteins in (co-)precipitates were identified by MALDI-TOF (Bruker Daltonics, Bremen, Germany) through an in-gel digest peptide mass fingerprinting and MS/MS. Selected protein bands from a SDS-PAGE gel were destained in 50% acetonitrile (ACN) until the gel was transparent. Gel pieces were shrunken with 100% ACN before reduced by 10 mm DTE (in 0.1 m NH4HCO3) at 56 °C for 45 min. Alkylation was introduced by addition of 55 mm iodazidamid (in 0.1 m NH4HCO3) and incubated for 30 min in darkness. Solution was removed followed by addition of first 50% ACN, then 100% ACN, before addition of NH4HCO3. Gel pieces were once again shrunken by 100% ACN and dried at 56 °C before trypsin (procine, Promega, 12.5 ng/µL, 50 mm NH4HCO3) was added. The trypsin digest was incubated on ice for 45 min. Reaction was stopped with 50 mm NH4HCO3, and the digest was incubated overnight at 37 °C. Peptides were micropurified by reverse-phase chromatography using Poros® R2 material (2000 Å poly (Styrene-Divinylbenzene) particle) in a gel-loader tip. Digest (20 µL) was loaded onto the tip, and peptides were extracted on a steel MALDI target plate using α-Cyano-4-hydroxycinnamic acid as matrix. The MALDI spectrometer used reflector positive mode, and the calibration was performed on a standard pepmix (Bruker Daltonics, Bremen, Germany): Angiotensin II (1046.5418 Da), Angiotensin (1296.6848 Da), Substance P (1347.7354 Da), Bombesin (1619.8223 Da), ACTH clip 1-17 (2093.0862 Da), ACTH clip 18-39 (2465.1983 Da), Somatostatin (3147.4710 Da).
Statistical analysis
Results were presented as means of experimental replicates with standard deviations (SD). The statistical analysis of variance was performed by one- or two-way ANOVA analysis with significance level of 95% (P < 0.05) using the statistical freeware program R (version 3.4.0) (R Development Core Team, 2016). Normality of data was checked with QQ-plots. No outliers were removed. The model of analysis for yield of co-precipitation was as follows:
where Y is the yield, a is the main effect of temperature i (4, 60, 80, 98 °C), b is the main effect of protein ratio j (WPI, Co: WPI:PPI 80:20, 50:50, 20:80, Bl: WPI:PPI 80:20, 50:50, 20:80, PPI), cij is the interaction between ai and bj, and εijl is the residual error (1,...,4). For comparison studies, a was the main effect of temperature i (4, 80 °C) or pH (3, 7, 11.5), b remained the main effect of protein ratio j (WPI, Co: WPI:PPI 80:20, 50:50, 20:80, Bl: WPI:PPI 80:20, 50:50, 20:80, PPI) and ε was a result of replicates (1,...,x). If interactions were non-significant, the full model was reduced and cij was excluded. Then, the main effects were tested for significance. For multiple significant differences tests, a Duncan’s Multiple Range test (R package agricolae, version 1.2-4) was used with significance level of 95% (P < 0.05).
Results
Optimisation of co-precipitation yield
Both the ratio between WPI and PPI (100:0, 80:20, 50:50, 20:80, 0:100) and the temperature (4, 60, 80, 98 °C) affected the yield of the co-precipitates. Overall, both factors were significant as well as their interaction (P < 0.05) (Fig. 1). The temperature did not significantly affect the precipitation yield of PPI alone whereas the protein yield of WPI precipitation was highly affected by increasing temperature. The protein yield of co-precipitates increased linearly with increasing PPI content and the overall yield was also affected significantly when the temperature was increased from 4 to 80 °C (4 °C = 60 °C < 80 °C = 98 °C). Hence, 4 and 80 °C were chosen for further studies.
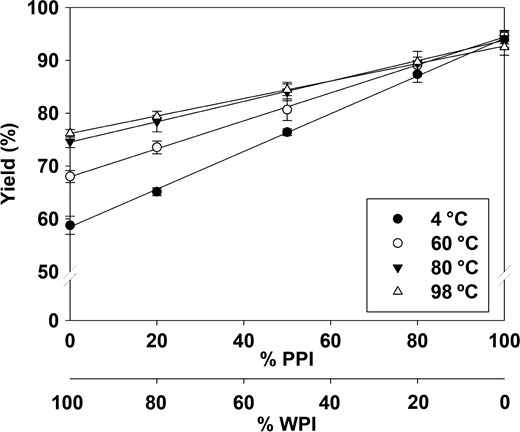
Effect of temperature (4 °C, 60 °C, 80 °C, 98 °C) and protein ratio (WPI:PPI 100:0, 80:20, 50:50, 20:80, 0:100 (v/v)) on the precipitation yield (%). Both factors and the interaction hereof affected the yield significantly. R2> 0.99 for all temperatures. Data points represent means and vertical bars represent ± SD, n = 4.
The effect of alkaline protein isolate solvation on the precipitation yield was studied in a pre-experiment for co-precipitate WPI:PPI 50:50 (v/v), where WPI was dissolved at pH 11 and 6.5 (native pH). PPI was always dissolved at alkaline conditions due to low solubility. Alkaline pre-treatment gave a higher precipitation yield for WPI and co-precipitate WPI:PPI 50:50 (v/v). The effect was most pronounced at 4 °C (Fig. 2), where the alkaline pre-treatment of WPI increased the yield significantly (390%) compared with precipitation with no pre-treatment. Combined with heat-treatment (80 °C), the alkaline pH of WPI increased the yield 27%. Furthermore, the precipitation yield of WPI:PPI 50:50 (v/v) increased with 17% with alkaline pre-treatment prior to precipitation at 4 °C and 4% at 80 °C, respectively. Again, the PPI precipitated with high yields independent of temperature.
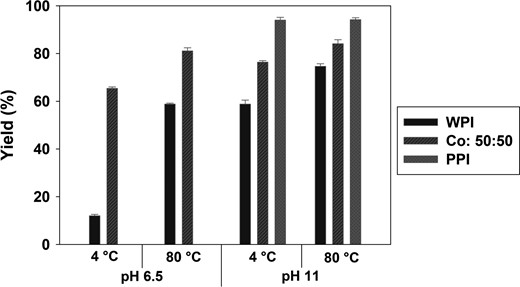
Comparison of precipitation yield (%) between precipitation with PPI dissolved in water at pH 11, and WPI dissolved in water at either pH 6.5 (no pH adjustment) or pH 11. Bars represent means of triplicates ± SD.
Structural changes were followed by fluorescence spectroscopy (Fig. 3). When increasing the pH from 6.5 to 11, the emission intensity clearly decreased at the maximum wavelength for WPI (from 681 to 412 AU) and a red shift (from 337 to 345 nm) in the emission maximum wavelength of the peak was observed (Fig. 3a). Subsequently adjusting to pH 6.8 (t = 0 h) resulted in a blue shift with a slight increase in intensity. After 2 h, the emission maximum wavelength reached the initial one and no significant changes were observed hereafter (P < 0.05). However, the emission intensity for the WPI solution did not reach the initial one, not even after 24 h at RT. Instead, the intensity decreased over time, indicating incomplete refolding. Despite low water solubility, PPI was dispersed at low concentration and became measurable. PPI (at pH 6.6) showed an appreciable lower maximum emission intensity than WPI and an emission maximum wavelength at 340 nm, probably due to the lower solubility (Fig. 3b). After adjusting to pH 11, solubility increased and the PPI solution became more homogenous. Nonetheless, the emission intensity did not change significantly. However, by subsequent lowering to pH 6.8, the emission intensity increased significantly compared with the initial one with no pH adjustment, but was comparable to the intensity at alkaline conditions. Storage at RT did not change the emission spectra of PPI solutions any further. A blue shift was observed when increasing to pH 11, which was restored by lowering to pH 6.8 and no significant changes occurred over time for the emission maximum wavelength. Overall, the PPI seemed unaffected by the pH changes and showed high standard deviations (data not shown).
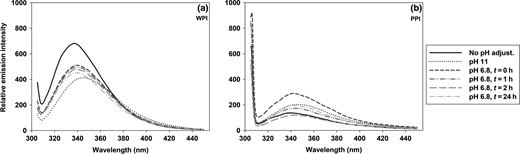
Trp measurements by fluorescence spectroscopy of WPI (a) and PPI (b) in water (c = 0.05 g/L). Exclusive Trp-excitation was performed at 298 nm. Curves are average of triplicates.
Solubility and instability index of co-precipitates and blends
Turbidity of precipitated proteins solutions was measured to indicate the solubility. The turbidity was significantly affected by two factors: pH (pH 3, 7 and 11.5) and precipitation temperature (4 and 80 °C). Highest solubility was seen with low precipitation temperature and high pH (data not shown).
The solubility of precipitated proteins was also measured at pH 3, 7 and 11.5 (Fig. 4) for samples precipitated at 4 °C. Overall, WPI displayed high solubility (100%), while PPI had the lowest (<30%). Solubility of the rest of the samples was dependent on the WPI:PPI ratio, where samples with high WPI content were more soluble than samples with increasing PPI. At pH 11.5, differences between co-precipitates and blends were observed for all WPI:PPI ratios; Co > Bl for 80:20 and 50:50, while Bl > Co for 20:80. At pH 7, Co > Bl for 80:20, Co = Bl for 50:50 and Bl > Co for 20:80. At pH 3, only 50:50 samples were significantly different with Bl > Co.

Relative solubility of re-suspended precipitates after centrifugation at 2,346 g, measured by UV at 280 nm. Protein was dissolved at pH 3, pH 7 or pH 11.5 (100 mM sodium phosphate buffer, c = 1 g/L). Bars represent means of duplicates ± SD. Co: Co-precipitates. Bl: Protein blends. * indicates significant differences between co-precipitate and blend at the same WPI:PPI ratio.
The instability index was also measured as an indication of how well the protein stayed in solution (Fig. 5). WPI:PPI ratio, pH and centrifugation speed were all significantly different as well as the pairwise interactions. The overall main effect of pH showed lowest instability index at high pH (0.46, 0.35 and 0.24 for pH 3, 7 and 11.5, respectively). The main effect of centrifugation speed showed significant difference (P < 0.05) between 36 g and 2325 g, where higher centrifugation speed caused higher instability indexes and lowers the amount of protein in solution. WPI remained stable throughout the full pH and centrifugation speed ranges with instability indexes ≥ 0.043, and was the only sample always significantly different from the rest where PPI was included.
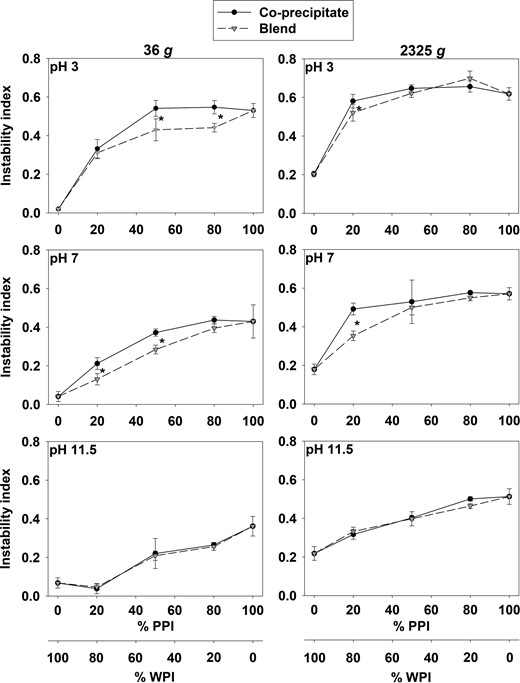
Instability index measured by LUMiFuge (c = 1 g/L, 100 mM sodium phosphate buffer, pH 3, pH 7 and pH 11.5) of co-precipitates (WPI:PPI 80:20, 50:50, 20:80 (v/v)), blends (WPI:PPI 80:20, 50:50, 20:80 (w/w)), WPI and PPI. Points represent replicate means with vertical bars as ± SD. ● Co-precipitates.  Blends. Precipitated isolates are a part of both curves at the endpoints at 0% PPI (100% WPI) and 100% PPI. * indicates significant differences at P < 0.05
At pH 3, samples with WPI:PPI 50:50 and 20:80 (w/w) showed significant differences in the instability index between co-precipitates and blends. At pH 7, differences between co-precipitates and blends were seen for samples with more whey protein (WPI:PPI 80:20 and 50:50 (w/w)). No difference between co-precipitates and blends was observed at pH 11.5. At 2325 g, samples dissolved at pH 3 and 7 showed an increase reaching a plateau, while samples at pH 11.5 showed a linear tendency. Only the WPI:PPI 80:20 (w/w) ratio showed significant differences between co-precipitate and blend at pH 3 and 7, while no differences were seen at pH 11.5. Overall, the blends always showed significant higher stability than co-precipitates.
Protein composition
The protein composition of dispersed co-precipitates, blends and isolates at pH 3, 7 and 11.5 was studied by SDS-PAGE (Fig. 6). Differences in protein composition were observed between co-precipitates and blends. With no centrifugation (Fig. 6a), the 20:80 samples showed differences in the intensity of the β-lactoglobulin (β-Lg) band across all pH values. For the pea proteins, bands included the two globulins, legumin and vicilin, and albumin as confirmed by MALDI-ToF–ToF. The overall lower intensity for the pea protein bands was only seen for 80:20 and 50:50 samples. Fewer differences were observed between co-precipitates and blends for the pea protein than whey proteins, except for 80:20 samples at pH 3 and 7. Co:20:80 (v/v) at pH 7 had a band at around 100 kDa, which was also seen in the PPI sample at pH 11.5 but not in the other samples. In fact, these two lanes repeatedly showed similar pattern. At pH 3, β-Lg was seen as a dimer at 36 kDa, which was confirmed by MALDI-ToF–ToF. A vicilin fraction was identified at the same migration length in PPI as the β-Lg in WPI. The pH effect for the dispersed samples was not visible, as insoluble particles were forced to solubility by means of the SDS-PAGE protocol. However, β-Lg seemed to migrate further in the gel at pH 3, and the β-Lg dimer was present in the lanes containing WPI, which was confirmed by MALDI-ToF–ToF. Convicilin and vicilin at 70 kDa and 50 kDa, respectively, showed higher intensity for co-precipitates at 80:20 and 50:50 samples than blends. Vicilin was seen as multiple bands caused by potential cleavage at two sites: α:β, β:γ sites accounting for smaller fragments at 33 kDa (αβ), 30 kDa (βγ), 19 kDa (α), 13.5 kDa (β), 16 and 12.5 kDa (γ) (Gatehouse et al., 1982; O'Kane et al., 2004). At pH 7, major differences were observed between the 80:20 co-precipitate and the blend, where pea proteins are present to a larger extent in the former and barely visible in the latter. Also the 20:80 samples differentiate from the co-precipitate to the protein blend where the former show a band at around 100 kDa, which was not present in the PPI lane (lane 8 at pH 7), but present in the PPI at high pH. Furthermore, the pH 7 lane for the 20:80 co-precipitate samples appeared more dark, which had been repeated several times. No obvious differences in protein composition were seen for the 50:50 samples at pH 7, as no major differences were seen between samples at pH 11.5.
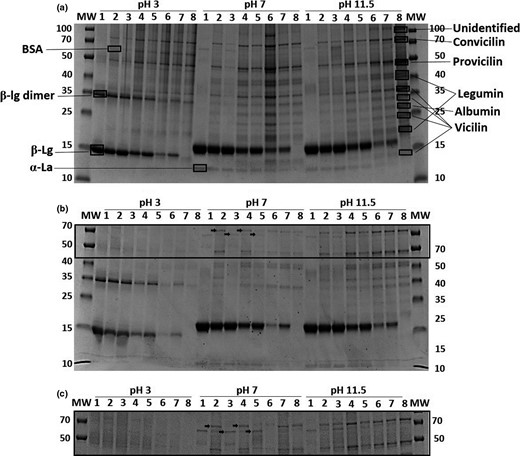
SDS-PAGE gel (any kD) of protein precipitates dissolved (c = 1 mg/mL) at pH 3, 7 or 11.5 and applied directly (a) or centrifuged at 2,346 g for 15 min. (b). Differences are indicated with arrows, and an enlargement of the interesting area is presented (c). Molecular weight markers (MW) are located in the first and last lane with protein masses in kDa to the left or the right of the gel, respectively. #1: WPI. #2: Co-precipitate WPI:PPI 80:20 (w/w). #3: Blend WPI:PPI 80:20 (v/v). #4: Co-precipitate WPI:PPI 50:50 (w/w). #5: Blend WPI:PPI 50:50 (v/v). #6: Co-precipitate WPI:PPI 20:80 (w/w). #7: Blend WPI:PPI 20:80 (v/v). #8: PPI. The proteins were identified by MALDI-Tof–Tof.
The protein composition of dissolved protein shows that proteins were lost by centrifugation (Fig. 6b), especially pea protein bands lost intensity and some even vanish. The pH difference was clear for the pea proteins, especially samples at pH 3 showed almost no soluble pea protein. The protein blends showed more whey protein than co-precipitates for 50:50 and 20:80 samples, and BSA was only seen in the WPI lanes. At pH 7, differences were observed between samples with protein ratios 80:20 and 50:50 (Fig. 6c) showing more pea proteins in the co-precipitates than in the blends. Convicilin (70 kDa) was present in the co-precipitates for 80:20 and 50:50, but not in the protein blends. On the other hand, blends contain BSA (67 kDa) that was not present in the co-precipitates. For the samples 20:80, convicilin was present. At pH 11.5, the same patterns were seen: more whey proteins in the protein blends and more pea protein in the co-precipitates.
Discussion
Fortunately, the overall pI of WPI and PPI is comparable (Swaisgood, 2008; Barac et al., 2015b), facilitating high protein yield in the present study ranging from >60% for WPI:PPI 80:20 to >80% for WPI:PPI 20:80. Other studies combining whey and rapeseed report yields of < 54% at 95 °C (Thompson, 1977), or whey and soy proteins; <35% at 98 °C (Alu'datt et al., 2012). The difference in used plant protein might be one reason for the higher yield in our study, but the fact that other studies used extracted proteins from flour, supposedly in a more native form than processed isolates (Lusas & Riaz, 1995) might also play a significant role. The fluorescence spectroscopy indicating an unfolded state of PPI used in our studies supported the latter suggestion.
Alkaline protein solvation prior to acid precipitation was done according to Alu'datt et al. (2012), who used soy protein instead of pea. This alkaline pre-treatment kept the PPI in dispersion but induced unfolding of WPI that facilitated the co-precipitation without heat-treatment, although the yield increased when combined with heat treatment. Dissolving WPI at neutral pH affected the yield of the co-precipitate WPI:PPI 50:50 (v/v) less than the precipitation of WPI alone. Because pH increased to 10 upon mixing WPI with the alkaline PPI solution, whey protein loses tertiary structure (Vivian & Callis, 2001). The native structure of WPI was not restored after re-adjusting to neutral pH. Unfolding of β-Lg can be nearly reversible (Bhattacharjee & Das, 2000), whereas α-lactalbumin (α-La) reaches a molten globular state upon decreasing pH and does not refold (Arai & Kuwajima, 2000). So even less in quantity, α-La and its interaction with β-Lg may have a significant role in our system. The loss of emission intensity could be caused by aggregation or precipitation of the proteins, the latter causing loss of protein. However, precipitation was not observed, but aggregation might explain the lower emission intensity seen for PPI but more surface exposed Trp-residues causing solvent relaxation and red shift (Lakowicz, 2006) is more likely to be the cause.
With isoelectric co-precipitation, repulsion is reduced facilitating hydrophobic protein–protein interactions. In addition, whey proteins have a more hydrophobic nature than for example casein (Papiz et al., 1986; Farrell Jr. et al., 2004), thus inducing interactions between PPI and WPI. Plant proteins in general exhibit more hydrophobic surfaces than animal proteins, making the primary expected interaction of the hydrophobic nature. This was supported by emission spectra of PPI with lower intensity and longer wavelength compared with WPI indicated more exposed Trp-residues. However, the lack of response to pH changes indicated a high degree of unfolding, which may compromise the solubility. Furthermore, the results of PPI showed large standard deviations and no trend in the intensities, making the results less reliable.
Alu'datt et al. (2012) and Thompson (1977) have shown that the precipitation yield increases linearly with increasing precipitation temperature when combining whey with soybean or rapeseed protein, respectively. The same temperature dependency was not seen in this study, probably due to processed and unfolded pea proteins. As a general tendency, the precipitation yield increased from 4 to 80 °C, after which the precipitation was temperature independent. Thompson (1977) finds a higher yield for the co-precipitates of whey and rapeseed protein than for the initial proteins, which Alu'datt et al. (2012) also report for whey–soy co-precipitates. This was partly seen for the present results as addition of pea protein increased the yield compared with WPI. Interactions between whey and pea protein in the co-precipitates were expected to cause synergistic or antagonistic effects, but the observed yield linearity indicated additive effects. Hence, no indication of possible protein–protein interactions between whey and pea proteins could be deduced from these results. Contradictive, the solubility showed differences between blends and co-precipitates indicating interactions, which will be discussed below.
In this study, the solubility of the precipitated products decreased with increasing precipitation temperature, perhaps caused by denaturation of the proteins by heat-induced breakage of hydrogen bonds. Although high temperatures gave a higher yield, reduced solubility affects the later applicable value of functional properties to foods (Buxbaum, 2011). This was studied by Thompson (1977), who show that the heat-induced denaturation of protein causes loss of foaming and emulsifying properties for co-precipitates of whey and rapeseed. The authors suggest to exclude the heating step despite higher yield. In addition, higher temperature treatment might induce unwanted oxidation of the proteins (Zhang et al., 2017). However, studies of co-aggregation have shown heat-induced interactions of whey and soy proteins (Roesch & Corredig, 2005) and whey and pea proteins (Chihi et al., 2016). Loss of tertiary structure exposes sulphhydryl groups prone for disulphide bond formation, which is valid for both whey and pea proteins. α-La contains eight Cys residues all bound in disulphide bridges (Vanaman et al., 1970), while β-Lg contains two disulphide bonds and one free Cys residue, which allows β-Lg to exist in dimers (McKenzie et al., 1972; Hoffmann & van Mil, 1997). In addition, pea legumin exists as an acidic and a basic chain linked by a disulphide bond. Furthermore, the acidic chain contains one disulphide bond and one free thiol group. Chihi et al. (2016) show that the heat-induced expose of the thiol groups is responsible for the covalent interactions in co-aggregates in the form of disulphide bridge exchanges between β-Lg monomers and/or legumin subunits, dissociated by heat. These considerations underline the possibility of S-S reactions between proteins in the co-precipitates and/or protein blends. On the contrary, the isoelectric precipitation reduced the electrostatic repulsion, which allowed a rapid protein aggregation via non-covalent interactions prior to the heat-induced denaturation of the proteins. Clearly, more studies are needed to resolve the specific interaction mechanism in co-precipitates and protein blends of precipitated origin.
Several researchers have reported improved solubility of co-precipitates (Thompson, 1977; Thompson et al., 1979; Alu'datt et al., 2012). The lowest solubility of the co-precipitates and blends in our study was observed at pH 3 probably due to its closeness to pI (pH 4.6) of both isolates. However, some solubility issues were also observed at pH 7. High pH gave high solubility, which is also reported by Jackman & Yada (1989), who studied blends of whey and pea proteins. The low solubility at acidic to neutral pH might cause application problem for the co-precipitation product as most foods have pH values around or below pH 6 (MacLeod et al., 1995). Whey protein displays high solubility over the entire pH range (Morr, 1979; Guimarães & Gasparetto, 2005), comparable with this study whereas the solubility of pea protein is highly depend on the origin of the pea protein and range from high to low (Barac et al., 2010; Barac et al., 2015a). In order to circumvent issues with anti-nutritional factors, legume proteins have often been heated or otherwise processed, and chemical solvents for extraction and/or spray drying temperature have been reported to affect plant protein solubility (Knuckles & Kohler, 1982; Hojilla-Evangelista et al., 2017). Furthermore, Habiba (2002) shows that heat reduces the solubility of pea proteins, which corresponds with the decreased solubility of the co-precipitates with increasing pea protein content reported in this study.
Most research on co-precipitates has been focusing on reporting the improvement of the co-precipitated products in relation to the initial protein isolates or protein extracts. Therefore, previously it has not been possible to elucidate whether improved functionalities of the co-precipitates arise from the effect of co-precipitation or the blending of the two protein products. Thompson et al. (1979) provide a small comparison between co-precipitates of whey and cottonseed protein with one blend of the two for chemical composition and functionality studies, where the latter shows no advantage of co-precipitation. However, this study used sodium hexametaphosphate as a co-precipitation agent and precipitation at pH 2.5, in order to avoid heat-induced denaturation of proteins (Thompson et al., 1979), which weakens the basis for comparison. In addition, the only major study of co-precipitation from Alu'datt et al. (2012) only reports the effects of the starting material of the precipitation of whey and soybean proteins.
The present study shows different results for co-precipitates and protein blends regarding solubility. Co-precipitation improved the solubility compared with the plant protein alone. However, the simple blending of the whey and pea protein showed overall better results than the co-precipitates. Heat-induced interactions between whey and pea proteins have been shown in aggregates (Chihi et al., 2016). However, the difference reported here between co-precipitates and protein blends is speculated to arise by means of the co-precipitation. The combination of isoelectric and heat treatment might cause different protein–protein interactions, but further studies are needed on this subject. Although results from SDS-PAGE found no major differences in protein composition between co-precipitates and blends, minor composition differences were observed, which correlate with results from instability measurements. This suggests different underlying mechanisms of protein–protein interactions of the two samples.
In the perspective of meeting the arising protein scarcity, these results show that replacing 20% of animal protein with plant protein in a co-precipitation approach keeps the protein solubility at acceptable level, which is important for food applications where protein contributes to food functional properties, that is gelling, foaming and emulsifying. Furthermore, a relative ratio of 20% WPI increased the solubility of plant protein significantly and showed synergistic effects. Although co-precipitation improved the solubility compared with the plant protein alone, the simple blending of the animal and plant protein showed even higher solubility than the co-precipitates. This difference is speculated to arise by means of the co-precipitation causing different protein–protein interactions, but further studies are needed on this subject. The use of either co-precipitated or blended proteins of animal and plant origin as ingredient for the food industry relies on its solubility at the specific conditions of pH, ionic strength and processing. Here, our present study showed the blending of the studied whey and pea proteins to be a more likely way to increase the usage of plant protein than through co-precipitation. However, it is essential for the food industry that these results are related to specific food processing conditions and the protein properties are analysed in the light hereof. As the market for processed foods is foreseen to grow hand-in-hand with the increased need for food-grade protein, the food industry needs further knowledge on processing’s impact on the properties of any replacing protein in food applications.
Conclusion
WPI and PPI were co-precipitated at pH 4.6 with high protein yields. The yield was significantly affected by temperature, pH and WPI:PPI ratio. The solubility of the co-precipitates and the blends was significantly affected by high precipitation temperature. High pH facilitated high solubility of the proteins. Differences in solubility were seen between co-precipitates and protein blends indicating different protein–protein interactions, but further studies are needed to resolve the specific interaction mechanisms.
Acknowledgments
The authors thank Arla Foods Amba, Arla Foods Ingredients and Aarhus University for financial support of the present work. Ethics approval was not required for this research. There was no conflict of interest to declare.
Data availability statement
Research data are not shared.
References
Author notes
The peer review history for this article is available at https://publons.com/publon/10.1111/ijfs.14553
