


Abstract
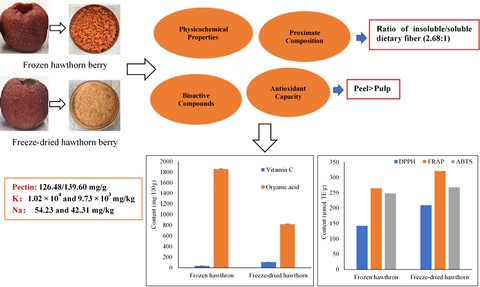
Hawthorn berry (Crataegus pinnatifida), approved as ‘medicine food homology’ fruit by China’s National Health Commission, has been associated with positive effects on human health. In-depth study of nutritional composition and antioxidant capacity can provide basic information on food value of Chinese organic frozen (OFHB)/freeze-dried (OFDHB) hawthorn berries. Higher levels of dietary fibre, pectin, ascorbic acid, mineral and antioxidant capacity were found compared with some common fruits and other species hawthorn. Both OFHB and OFDHB samples have much higher content of potassium (1.02 × 10⁴ and 9.73 × 10³ mg kg−1) than sodium (54.23 and 42.31 mg kg−1). OFDHB had a more desirable ratio (2.68:1) of insoluble/soluble dietary fibre which is suitable for use as a food ingredient. Antioxidant capacity varied considerably depending on the part (peel > pulp) and reaching up to 577.5 µmol Trolox equivalent g−1. OFHB and OFDHB are excellent natural nutrient-dense and antioxidant sources for dietary supplements and functional foods development.
Introduction
With the development of the economy and the improvement of living standards, the incidence rate of chronic diseases is increasing rapidly. It is reported that about half of all American adults (117 million individuals) have one or more preventable, chronic diseases, including cardiovascular diseases, obesity, hypertension, type 2 diabetes and diet-related cancers (Ward et al., 2014). Dietary Guidelines Advisory Committee (DGAC) found remarkable consistency in the findings and implications across its conclusion statements for the questions examining dietary patterns and various health outcomes. The Dietary Guidelines for Americans (2015–2020; DGAC, 2015) advised individuals to increase their intake of nutrient-dense foods, such as fruits and vegetables, that are naturally rich in vitamins, minerals, dietary fibre, and other substances which showed positive and significant associations with the antioxidant capacity of dietary (Puchau et al., 2010). Meeting the needs for these nutrients, it is important to discover excellent natural nutrient-dense sources for dietary supplements and ingredients in functional foods which can be used widely as alternative medicines for the inhibition and prevention of diseases.
Comparing with taking medicines which could bring inevitable side effects, avoiding disease through diet is an effective way to stay healthy for people. ‘Medicine food homology (MFH)’ is a famous saying from the field of traditional Chinese medicine which imply that these materials have been used for both nutritive and medicinal purposes (Hou & Jiang, 2013). There has been an increasing interest for MFH fruits, such as jujube (Ziziphus jujuba Mill.), goji berry (Lycium chinense) and hawthorn berry (Crataegus pinnatifida) which are not only in high concentration of nutrients and bioactive compounds, but relatively low in calories and high in dietary fibre, which has been shown to aid in healthy weight maintenance, and associated with a reduced risk of multiple chronic diseases (Fulton et al., 2016). In China, the fruit of hawthorn berry (C. pinnatifida) is approved as MGH fruit by China’s National Health Commission, which is used for developing some traditional and popular Chinese snacks, such as hawthorn flakes and Tang Hulu. More importantly, it is commonly applied by Chinese medicine for preventing and treating cardiovascular diseases, stimulating digestion and improving blood (Chang et al., 2002). However, very limited studies have been conducted on nutritional composition and potential health benefits of hawthorn berry which is cultivated in China to accurately reflect its nutrient values.
The present study was focused on evaluating physicochemical characteristics, proximate compositions, dietary fibre (DF), pectin, mineral, α-tocopherol, β-carotene, ascorbic acid, individual soluble sugar/organic acid, total phenolics (TPC)/flavonoids (TFC)/procyanidins (TPAC) content, antioxidant capacity (radical scavenging capacity/DPPH, ferric reducing antioxidant power/FRAP and total antioxidant capacity assay/ABTS) of Chinese organic hawthorn berry to discover excellent natural nutrient-dense and antioxidant sources.
Materials and methods
Chemicals
Ultra-pure grade water was obtained by Thermo Scientific Barnstead E-pure water purification system (Model 7119, Marietta, OH, USA). l(+)-Ascorbic acid, glucose, fructose, sucrose, d-galacturonic acid and other common chemical reagents were purchased from Fisher Scientific (Hampton, NH, USA). Folin–Ciocalteu reagent, gallic acid, rutin, catechin, α-tocopherol, β-carotene, oxalic acid, malic acid, tartaric acid, citric acid, fumaric acid, 2,2-diphenyl-1-picrylhydrazyl (DPPH), 6-hydroxy-2,5,7,8-tetramethylchroman-2-carboxylic acid (Trolox), 2,4,6-tri (2-pyridyl)-1,3,5-triazine (TPTZ) and 2,2′-azinobis (3-ethylbenzothiazoline-6-sulphonic acid) diammonium salt (ABTS) were purchased from Sigma-Aldrich (St. Louis, MO, USA).
Plant material
Organic fresh hawthorn berry, a local cultivar of Crataegus pinnatifida var. major, called ‘Shanzha’ was harvested in Chengde, Hebei Province, China (118°48′E, 40°60′N). All trees were managed adhered to the standards set by the U.S. Department of Agriculture (USDA) National Organic Program (NOP) without any use of genetic engineering (GMOs), ionising radiation, sewage sludge, and synthetic pesticides and fertilisers. Fresh samples obtained were manually pitted and washed, then quick-frozen and lyophilised with commercial processes to obtain Chinese organic frozen (OFHB) and freeze-dried (OFDHB) hawthorn berries, respectively, as shown in Figure S1a, b. All samples were stored in −80 °C, and OFHB sample was thawed at 4 °C overnight before analyses.
For the analysis of TPC, TFC, TPAC and antioxidant capacity, OFHB or OFDHB sample was macerated with 30 mL of 80% (v/v) methanol. The mixture was processed with ultrasonic processing for 30 min and centrifuged at 4500 g/4 °C for 10 min to get the supernatants. The residues were extracted and re-centrifuged twice under the same conditions, and then, the supernatants were collected and diluted to 100 mL.
Determination of total soluble solids content (TSSC), pH and titratable acid (TA)
pH was measured directly by a pH meter (Thermo Orion 2 Star pH Benchtop, USA). TSSC (°Brix) was measured using a portable refractometer (Reichert Brix30, Buffalo, NY, USA). TA was titrated with 0.1 mol/L NaOH until the pH 8.1 was reached (8.1 ± 0.2), and the results were expressed as g citric acid per 100 g of the sample (AOAC, 2000).
Determination of proximate composition, dietary fibre, minerals and pectin
The proximate composition, total (TDF)/soluble (SDF)/insoluble (ISDF) dietary fibre were determined by AOAC method (AOAC, 2000). Total carbohydrates and total energy were calculated according to the method of Sereno et al. (2018). The compositions of minerals were determined by quadrupole inductively coupled plasma-mass spectrometry (ICP-MS) 7500cs (Agilent Corp., Santa Clara, CA, USA) using the method of Malinouski et al., (2014). Total (TP) and water-soluble (WSP) pectin were analysed by m-hydroxydiphenyl method (Yu et al., 1996).
HPLC analysis of soluble sugar, α-tocopherol, β-carotene, ascorbic acid and organic acid
Soluble sugars were identified and quantified by a Dionex ICS-3000 HPLC system (Sunnyvale, CA, USA) equipped with a Thermo Fisher CarboPac PA20 column (3 × 150 mm) and CarboPac PA20 guard column (3 × 30 mm) at 30 °C. A 10 µL sample of the solution was injected and operated at a flow rate of 0.4 mL min−1. The mobile phase was 100% water (A) and 200 mmol L−1 sodium hydroxide in water (B) with the following gradient profile: initial conditions at 2.5% B held for 10 min, followed by linear gradient to 100% B at 15 min, and held at 100% B for 5 min (Ellingson et al., 2016).
α-Tocopherol/β-carotene (Gao et al., 2012), ascorbic acid (Gundogdu et al., 2014) and organic acids (Liu et al., 2013) were detected by an Agilent 1260 infinity HPLC-DAD system with a Waters Spherisorb ODS2 C18 column (4.6 mm × 250 mm, 5 μm, Milford, MA, USA) at 40/25/30/25 °C and 296/450/254/210 nm, respectively, with the injection of 20 µL and a flow rate of 1 mL min−1. The mobile phase of α-tocopherol/β-carotene, ascorbic acid and organic acid was methanol/acetonitrile/tetrahydrofuran (73:20:7, v/v/v), ultra-pure grade water (pH 2.6, adjusted with 1 mol L−1 metaphosphoric acid) and 0.01 mol L−1 of KH2PO4 (pH 2.6), respectively.
Determination of TPC, TFC and TPAC
Total phenolics content and TFC were measured according to the method of Wen et al. (2015). For TPC, 0.5 mL of extract was mixed with 2.5 mL of Folin–Ciocalteau reagent and 1.5 mL of 7.5% (w/v) Na2CO3. The mixture was measured at 765 nm after incubation for 1 h in the dark at room temperature. For TFC, 4 mL of extract was mixed with 0.4 mL of 5% (w/v) NaNO2, left to stand for 6 min at room temperature and then mixed with 0.4 mL of 10% (w/v) Al (NO3)3. After another 6 min of incubation, 2 mL of 4% (w/v) NaOH were added and the absorbance was measured at 510 nm. For TPAC (González-Rodrı́guez et al., 2002), 0.5 mL of extract was added to 3 mL of 4% (w/v) vanillin in methanol and 1.5 mL of concentrated hydrochloric acid. The absorbance was read at 500 nm after incubation at 30 °C for 30 min. The results of TPC, TFC and TPAC were expressed as mg gallic acid (GAE), rutin (RE) and catechin (CE) g−1, respectively.
Determination of antioxidant capacity
For DPPH (Wang et al., 2018), a 500 µL sample of extract solution was mixed with 4 mL of 0.13 mol L−1 DPPH solution and the absorbance was measured at 517 nm after 30 min incubation in the dark at room temperature. For FRAP (Lu et al., 2011), 100 µL of the extract were mixed with 4 mL of freshly prepared FRAP reagent. After 30 min incubation at 37 °C, the absorbance was read at 593 nm. For ABTS (Lu et al., 2011), 2.45 mmol L−1 of K2S2O8 was mixed with 7 mmol L−1 of ABTS solution and the mixture was left in the dark for 16 h to get ABTS radical cation (ABTS·+). The ABTS·+ solution was diluted with ethanol to an absorbance of 0.7 ± 0.02 at 734 nm. To 3.9 mL of diluted ABTS+ solution, 100 µL of extract was added and mixed thoroughly. The mixture was allowed to stand at room temperature for 6 min, and the absorbance was recorded at 734 nm immediately. The results of DPPH, ABTS and FRAP were expressed as µmol Trolox equivalents (TE) g−1.
Data analysis
All experiments were carried out in triplicate. Results were expressed as the arithmetic average ± the standard deviation and calculated based on dry weight (DW). Significant difference in the results was analysed using the paired-sample test and one-way analysis of variance (Anova) at a threshold of 0.05 by SPSS 20.0 software (IBM Corp., Armonk, NY, USA).
Results and discussions
TSSC, pH and TA
Results of TSSC, pH and TA of OFHB, OFDHB and other fruits were presented in Table 1. OFHB (2.83%/1.20%) and OFDHB (2.98%/1.04%) samples had a similar pH/TA with blackberry (2.99%/1.51%) and raspberry (2.86%/1.88%), while higher pH/lower TA were observed in strawberry (3.73%/0.86%), blueberry (3.64%/0.58%) and cherry (4.08%/0.55%). Lower TSSC was found in OFHB (6.66 °Brix) and OFDHB (6.39 °Brix) compared with all above-mentioned berries (10.17–18.67 °Brix). In addition, the TSSC/TA ratio of OFHB (5.57) and OFDHB (6.17) indicates excellent properties for industrialisation and good consumer acceptance (Garcia-Amezquita et al., 2018), which was similar to blackberry (6.71) and raspberry (5.50), while significantly lower than strawberry (12.27) and blueberry (28.61). The relationship between TSSC and TA is an important physicochemical standard for determining the taste and acceptance of fruits, as an indicator of the balance between the sweet and acid taste (Sereno et al., 2018). Therefore, OFHB and OFDHB have a similar acidic flavour with blackberry and raspberry.
Total soluble solids content (TSSC), pH, titratable acid (TA) and the ratio of TSSC/TA of Chinese organic frozen and freeze-dried hawthorn berries and other fruits
| OFHB | OFDHB | Blackberry† | Red raspberry† | Strawberry† | Blueberry† | Cherry† | |
|---|---|---|---|---|---|---|---|
| pH | 2.83 ± 0.02a | 2.98 ± 0.03b | 2.99 ± 0.04 | 2.86 ± 0.04 | 3.73 ± 0.01 | 3.64 ± 0.05 | 4.08 ± 0.01 |
| TSSC/°Brix | 6.66 ± 0.12a | 6.39 ± 0.01a | 10.17 ± 0.29 | 10.33 ± 0.58 | 10.50 ± 0.50 | 14.67 ± 0.58 | 18.67 ± 0.58 |
| TA/% | 1.20 ± 0.005a | 1.04 ± 0.04b | 1.51 ± 0.04 | 1.88 ± 0.09 | 0.86 ± 0.10 | 0.58 ± 0.07 | 0.55 ± 0.07 |
| TSSC/TA | 5.57 ± 0.10a | 6.17 ± 0.24a | 6.71 ± 0.18 | 5.50 ± 0.55 | 12.27 ± 1.39 | 28.61 ± 6.27 | 34.07 ± 3.85 |
OFDHB, organic freeze-dried hawthorn berry; OFHB, organic frozen hawthorn berry.
All values are expressed as means ± standard deviation. TA was expressed as g citric acid per 100 g of the sample. Results of OFHB and OFDHB with the same superscript are statistically not significant (P > 0.05) while those with different superscript are statistically significant (P < 0.05).
†Literature data for blackberry, red raspberry, strawberry, blueberry and cherry: (De Souza et al., 2014).
Proximate composition
The proximate composition of OFHB, OFDHB and other fruits is presented in Table 2. The moisture content of OFHB was 77.48%. About 90.38% of moisture content was lost after freeze-drying, and the final moisture of OFDHB significantly decreased to 7.45% (P < 0.05). As expected, protein and fat contents were relatively low in OFHB (3.14% and 1.30%) and OFDHB (2.95% and 1.61%). However, this observation compared favourably with the reported protein value (2.48%) in Turkey hawthorn (Crataegus spp.; Özcan et al., 2005). The content of ash in OFHB (2.38%) and OFDHB (2.41%) was in agreement with 1.94–5.09% in other fruits (Table 2). The energy (kcal kg−1) was found to be 870.46 in OFHB which increased significantly (P < 0.05) to 3.69 × 10³ in OFDHB as most moisture was removed. The calorific value (kcal per 100 g) of OFHB was higher to that of blueberry (57), raspberry (52), blackberry (43) and strawberry (32) as shown in the National Nutrient Database for Standard Reference (SR; USDA, 2018), while lower than 1168–1536 kJ per 100 g of other fruits as shown in Table 2. The incidence of obesity in the world has risen continuously over the last several decades. A low-calorie diet was effective in reducing body weight, body mass index and fat mass, and improving cardiovascular risk profile (Sofi et al., 2018), and the Dietary Guidelines for Americans (2015–2020) encouraged individuals to increase their intake of fruits and vegetables to help control total caloric intake and manage body weight.
Proximate composition of Chinese organic frozen and freeze-dried hawthorn berries and other fruits
| Moisture/% | Ash/% | Protein/% | Fat/% | Total carbohydrates/% | Energy† (kcal kg−1) | |
|---|---|---|---|---|---|---|
| OFHB | 77.48 ± 0.33a | 2.38 ± 0.26a | 3.14 ± 0.15a | 1.30 ± 0.08a | 15.70 ± 0.44a | 870.46 ± 7.99a |
| OFDHB | 7.45 ± 0.82b | 2.41 ± 0.07a | 2.95 ± 0.06a | 1.61 ± 0.03b | 85.58 ± 0.87b | 3.69 × 10³ ± 32.25b |
| Banana‡ | 75.32 ± 0.34 | 3.87 ± 0.03 | 7.37 ± 3.26 | 0.27 ± 0.05 | – | 1446 ± 59 |
| Mango‡ | 83.90 ± 0.30 | 1.94 ± 0.10 | 2.82 ± 0.23 | 0.29 ± 0.09 | – | 1535 ± 6 |
| Lemon‡ | 87.69 ± 0.23 | 5.09 ± 0.05 | 6.45 ± 0.72 | 0.62 ± 0.23 | – | 1168 ± 16 |
| Orange‡ | 79.95 ± 0.98 | 3.13 ± 0.10 | 5.34 ± 0.25 | 0.27 ± 0.07 | – | 1266 ± 5 |
| Watermelon‡ | 91.36 ± 0.41 | 3.48 ± 0.01 | 7.30 ± 0.59 | 2.12 ± 0.27 | – | 1512 ± 15 |
OFDHB, organic freeze-dried hawthorn berry; OFHB, organic frozen hawthorn berry.
All values are expressed as means ± standard deviation. Results of OFHB and OFDHB with the same superscript are statistically not significant (P > 0.05) while those with different superscript are statistically significant (P < 0.05).
†The energy of banana, mango, lemon, orange and watermelon was expressed as kJ per 100 g (1 kcal = 4.184 kJ).
‡Literature data for banana, mango, lemon, orange and watermelon: (Garcia-Amezquita et al., 2018).
Dietary fibre
Both American Dietetic Association (ADA) and Dietary Guidelines for Americans (2015–2020) recommended the public should consume adequate amounts of DF from a variety of plant foods, including grains, vegetables and fruits for an active and healthy life. The contents observed for TDF of OFHB (41.06%) and OFDHB (49.48%) were comparably higher than pulp of banana (10.05%), mango (6.71%), lemon (25.9%), orange (21.53%) and watermelon (8.83%; Garcia-Amezquita et al., 2018). Recommended Dietary Allowances (RDA) of DF established by the US Food and Nutrition Board of the Institute of Medicine (IOM) for children 1–3/4–8 years, males 9–13/14–50 years and females 9–18/19–50 years was 19/25, 31/38 and 26/25 g/day, respectively. OFDHB of the average weight of 60/80 g can meet the RDA for males/females aged from 19–50 year, and 100 g of OFHB can provide more than 80% of RDA for these age groups. From a functional perspective, DF has been recognised for supporting laxation, attenuating blood glucose responses and assisting with cholesterol-lowering (Fuller et al., 2016). In addition, DF can also help to reduce the energy density of foods owing to its bulking effects, and promoting satiety, increasing dietary fibre consumption may decrease energy absorption by way of diluting a diet energy availability while maintaining other important nutrients (Lattimer & Haub, 2010).
Dietary fibre is often classified as SDF and ISDF; SDF has been linked to the reduction of cholesterol in the blood and the decrease in the intestinal absorption of glucose, whereas ISDF has been associated with water absorption and intestinal regulation (Bae & Lee, 2014). To author’s best knowledge, this is the first time to determine the content of ISDF and SDF in organic hawthorn berry. The amount of ISDF (32.97% and 36.05%) was found to be significantly (P < 0.05) higher than SDF (8.08% and 13.44%) in both OFHB and OFDHB sample (Table 3). It is generally accepted that DF sources suitable for use as a food ingredient should have an ISDF/SDF ratio close to 2:1 (Schneeman, 1987). DF from cereals is more frequently used than those from fruits; however, DF of fruit has better quality due to higher TDF and SFD content, water and oil holding capacity and colonic fermentability, as well as lower caloric value (Figuerola et al., 2005). As shown in Table 3, TDF of blueberry (68.76–69.41%), cranberry (71.70–74.80%), grape (47.88–48.41%), and pomaces of apple (58.31–78.2%), grapefruit (44.2–62.6%), lemon (60.1–68.3%) and orange (64.3%) were higher than that of OFHB and OFDHB samples, while most of those DF sources had a ISDF/SDF ratio over 5.0:1 except apple pomaces (3.63:10–4.5:1). In our study, the ISDF/SDF ratios of OFHB and OFDHB were 4.08:1 and 2.68:1, respectively, which were more reasonable than other fruits. It was obvious that OFDHB had a much closer ratio of ISDF/SDF to 2:1 than other fruits. This change may be attributed to the altered porous matrix structure of DF formed by polysaccharide chains which may increase the solubility of DF (Figuerola et al., 2005).
Content of dietary fibre in Chinese organic frozen and freeze-dried hawthorn berries and other fruits
| SDF/% | ISDF/% | TDF/% | IDF/SDF | |
|---|---|---|---|---|
| OFHB | 8.08 ± 1.92a | 32.97 ± 1.09a | 41.06 ± 1.02a | 4.08:1a |
| OFDHB | 13.44 ± 3.16a | 36.05 ± 6.76a | 49.48 ± 4.58a | 2.68:1a |
| Blueberry† | 2.80 ± 0.15 | 65.95 ± 0.60 | 68.76 ± 0.75 | 23.55:1 |
| 3.01 ± 0.12 | 66.40 ± 0.33 | 69.41 ± 0.46 | 22.06:1 | |
| Cranberry† | 4.28 ± 0.18 | 67.41 ± 0.35 | 71.70 ± 0.53 | 15.75:1 |
| 4.47 ± 0.27 | 70.33 ± 0.46 | 74.80 ± 0.73 | 15.73 | |
| Concord grape† | 2.02 ± 0.02 | 45.87 ± 0.79 | 47.88 ± 0.81 | 22.71:1 |
| 2.04 ± 0.04 | 46.37 ± 0.24 | 48.41 ± 0.28 | 22.73:1 | |
| Apple pomaces•,‡ | 10.21 ± 0.11 | 52.13 ± 0.63 | 62.34 ± 0.74 | 5.11:1 |
| 12.59 ± 0.49 | 45.72 ± 0.82 | 58.31 ± 1.31 | 3.63:1 | |
| 14.33 ± 0.61 | 63.9 ± 0.16 | 78.2 ± 0.60 | 4.5:1 | |
| 4.14 ± 0.21 | 56.5 ± 0.20 | 60.7 ± 0.23 | 12.9:1 | |
| Grapefruit pomaces‡ | 4.57 ± 0.35 | 56.0 ± 0.17 | 62.6 ± 0.30 | 12.7:1 |
| 6.43 ± 0.45 | 37.8 ± 0.21 | 44.2 ± 0.35 | 5.9:1 | |
| Lemon pomaces‡ | 9.20 ± 0.23 | 50.9 ± 0.20 | 60.1 ± 0.22 | 5.5:1 |
| 6.25 ± 0.16 | 62.0 ± 0.16 | 68.3 ± 0.16 | 9.9:1 | |
| Orange pomaces‡ | 10.28 ± 0.30 | 54.0 ± 0.23 | 64.3 ± 0.3 | 5.3:1 |
ISDF, insoluble dietary fibre; OFDHB, organic freeze-dried hawthorn berry; OFHB, organic frozen hawthorn berry; SDF, soluble dietary fibre; TDF, total dietary fibre.
All values are expressed as means ± standard deviation. Results of OFHB and OFDHB with the same superscript are statistically not significant (P > 0.05) while those with different superscript are statistically significant (P < 0.05).
†Literature data for blueberry, cranberry, concord grape and apple pomaces: (Masli et al., 2018).
‡Literature data for pomaces of apple, banana, grapefruit, lemon and orange: (Figuerola et al., 2005).
OFHB and OFDHB presented higher concentrations of TDF and reasonable ratio of ISDF/SDF which could be a good source for developing daily fibre functional food and may well be recommended for treatment and prevention of constipation, control of serum cholesterol level, maintaining healthy weight and avoiding obesity, reducing the risk of diabetes, intestinal cancer and stimulation of beneficial microorganisms (Bae & Lee, 2014).
Pectin
Recently, more and more attention has been paid to the biological activity of pectin from hawthorn berry was able to up-regulate the gene and protein expressions of peroxisome proliferator-activated receptor α which indicated that continuous hawthorn berry pectin ingestion may be used as dietary therapy to prevent obesity and cardiovascular diseases, and improve cholesterol metabolism (Li et al., 2010; Zhu et al., 2013). The content of TP and WSP was 126.48 and 56.50 mg g−1, respectively (Table 5). A slight increase was observed in the OFDHB sample of TP (139.60 mg g−1) and WSP (77.09 mg g−1), while no significant difference was found between the two samples (P > 0.05). WSP content accounted for more than 40% of TP content in both samples. The value was an agreement with 36.14–56.52% of citrus peel (Wang et al., 2008). TP content of OFHB and OFDHB was also higher compared with the pomace of apple (11.7%), cherry (1.51%), chokeberry (7.85%), black currant (2.73%), pear (13.4%) and carrot (3.88%; Nawirska & Kwaśniewska, 2005).
Minerals
Minerals play an important role in the prevention of various diseases, such as bone demineralisation, arterial hypertension and cardiovascular disorders (Amos Fawole & Linus Opara, 2012). Nine mineral elements were quantified in both samples (Table 4). The maximum content of mineral in OFHB (1.02 × 10⁴ mg kg−1) and OFDHB (9.73 × 10³ mg kg−1) was K, which was in agreement with the results of some berry fruits (De Souza et al., 2014), followed by Mg (825.70 and 700.22 mg kg−1) and P (769.81 and 643.84 mg kg−1). The concentration of Na obtained in this study for OFHB and OFDHB samples was 54.23 and 42.31 mg kg−1, respectively. These low values for Na has salutary health implications. Chronic Disease Risk Reduction Intakes recommend that adults over 19 years should reduce intakes if above 2300 mg day−1 as high dietary sodium intake has the coexistence of essentiality with a relationship to adverse health effects (DGAC, 2015). Foods with low Na and high K content are suggested to have a beneficial effect on blood pressure regulation and the prevention of hypertension (Skrabal et al., 1981). The contents of Ca (560.03 and 513.80 mg kg−1), Fe (26.52 and 22.02 mg kg−1), Cu (7.25 and 6.67 mg kg−1) and Zn (7.52 and 10.24 mg kg−1) in OFHB and OFDHB were remarkably higher than those in blackberry, raspberry, blueberry and strawberry (Pereira et al., 2018) as indicated in Figure S2. Se (77Se/78Se), which plays a biochemical role as a component of glutathione peroxidase was found in both of OFHB (0.08/0.14 mg kg−1) and OFDHB (0.04/0.03 mg kg−1) samples which is higher than most fruits and vegetables (<0.10 μg g−1; Pereira et al., 2018).
Concentrations of minerals in Chinese organic frozen and freeze-dried hawthorn berries
| Mineral | RDA | UL | Covering (%) of RDA | Sample (mg kg−1) | |||
|---|---|---|---|---|---|---|---|
| OFHB per 100 g | OFDHB per 100 g | DM | OFHB | OFDHB | |||
| Na | 1500 | ND | 0.36 | 0.28 | 23Na | 54.23 ± 1.76a | 42.31 ± 5.90b |
| Mg | 400–420/310–320 | 350 | 20.64–19.66/26.64–25.80 | 17.51–16.67/22.58–21.88 | 24Mg | 825.70 ± 33.08a | 700.22 ± 15.88b |
| P | 700 | 4000 | 10.80 | 9.20 | 31P | 769.81 ± 18.48a | 643.84 ± 21.77b |
| K | 3400/2600 | ND | 29.93/39.13 | 28.61/37.42 | 39K | 1.02 × 10⁴ ± 263.14a | 9.73 × 10³ ± 478.72a |
| Ca | 1000 | 2500 | 5.60 | 5.14 | 43Ca | 206.68 ± 3.57a | 190.48 ± 7.81a |
| 44Ca | 353.35 ± 2.89a | 323.32 ± 14.59b | |||||
| Fe | 8/18 | 45 | 33.15/14.73 | 27.53/12.23 | 56Fe | 13.24 ± 1.33a | 11.73 ± 0.78b |
| 57Fe | 13.28 ± 1.70a | 10.29 ± 3.41a | |||||
| Cu | 900 | 10 000 | 80.56 | 74.11 | 63Cu | 3.21 ± 0.11a | 3.55 ± 0.09b |
| 65Cu | 4.04 ± 2.23a | 3.12 ± 1.04a | |||||
| Zn | 11/8 | 40 | 6.84/9.40 | 9.31/12.80 | 64Zn | 3.80 ± 0.48a | 4.76 ± 1.59b |
| 66Zn | 3.72 ± 0.43a | 5.48 ± 0.12a | |||||
| Se | 60 | 400 | 36.67 | 11.67 | 77Se | 0.08 ± 0.03a | 0.04 ± 0.05a |
| 78Se | 0.14 ± 0.00a | 0.03 ± 0.00a | |||||
DM, detected minerals; OFDHB, organic freeze-dried hawthorn berry; OFHB, organic frozen hawthorn berry; RDA, Recommended Dietary Allowance; UL, Tolerable Upper Intake Levels.
ND, not determinable due to lack of data of adverse effects in this age group and concern with regard to lack of ability to handle excess amounts. Both RDA and UL are for males/females aged from 19 to 50 years old. The RDA and UL of Cu and Se were expressed by µg day−1, and other minerals were expressed by mg day−1. All values are expressed as means ± standard deviation. Any results with the same superscript in the same row are statistically not significant (P > 0.05) while those with different superscript are statistically significant (P < 0.05).
Though minerals are highly essential to humans, they become toxic once they get above the safe level or upper tolerable limit (UL). RDA and UL of minerals were established by IOM for as shown in Table S1. The covering (%) of the individual mineral levels found in OFHB and OFDHB for adult’s RDA aged between 19 and 50 years is shown in Table 4. Consumption of OFHB/OFDHB with an average weight of 500/600 g can meet the RDA of Mg for adults aged between 19 and 50 years. The RDA of K for males/females of this age group can be met with an average weight of 350/280 g. About 10.80%/5.60% of the RDA for P/Ca can be met by the consumption of OFHB of 100 g. However, it is up to 80.56% and 74.11% of the RDA for Cu can be met at the same weight (100 g). RDA is specified on the basis of age, gender and life stage. The RDA of Fe for males/females aged from 19 to 50 years is 8/18 mg/day and the Zn is 11/8 mg/day (Table 4). As shown in Table 4, OFHB and OFDHB supply approximately 33.15%/14.73% and 27.53%/12.23% of Fe and 6.84%/9.40% and 9.31%/12.80% of Zn for males/females aged from 19 to 50 year regarding RDA. Se presented the lowest levels compared with other micro minerals; however, its percentage corresponds to 36.67% of RDA per 100 g.
HPLC analyses of soluble sugar, α-tocopherol, β-carotene, ascorbic acid and organic acid
α-Tocopherol, β-carotene and ascorbic acid
α-Tocopherol (the most active form of vitamin E) and β-carotene (providing precursors for vitamin A synthesis) are the most common lipid-soluble antioxidants in fruits and vegetables. HPLC chromatograms of α-tocopherol and β-carotene are shown in Figure S3a–d. The levels of α-tocopherol and β-carotene were 4.57 and 5.49 mg per 100 g in OFDHB, respectively (Table 5). These values showed higher α-tocopherol content compared with freeze-dried jujube but lower β-carotene (Gao et al., 2012). However, both α-tocopherol and β-carotene were not detected in OFHB sample. This may be attributed to that α-tocopherol and β-carotene are fat-soluble vitamins; most fruits presented low levels of α-tocopherol (0.05–0.14 mg per 100 g) and β-carotene (1.3–504.0 µg per 100 g; Kim et al., 2007). For OFDHB sample, freeze-drying concentrated the content of α-tocopherol and β-carotene, while the level of OFHB sample was below the detection limit. Similar results were found in some fruits and vegetables (Monge-Rojas & Campos, 2011).
Pectin, soluble sugar, α-tocopherol, β-carotene, ascorbic acid and organic acid of frozen and freeze-dried Chinese organic hawthorn berries
| Response | Sample | |
|---|---|---|
| OFHB | OFDHB | |
| Pectin (mg g−1) | ||
| Total pectin | 126.48 ± 0.25a | 139.60 ± 0.02a |
| Water-soluble pectin | 56.50 ± 0.05a | 77.09 ± 0.05a |
| Soluble sugar (g per 100 g) | ||
| Glucose | 1.96 ± 0.13a | 5.44 ± 0.26b |
| Fructose | 7.34 ± 0.21a | 14.92 ± 0.62b |
| Sucrose | 14.67 ± 0.99a | 31.85 ± 0.23b |
| Total content | 23.98 ± 1.32a | 52.20 ± 1.10b |
| Organic acid (mg per 100 g) | ||
| Oxalic acid | 56.50 ± 1.81a | 44.68 ± 3.07a |
| Tartaric acid | 26.65 ± 0.38a | 24.15 ± 0.46b |
| Malic acid | 1.77 × 10³ ± 4.98a | 746.25 ± 3.74b |
| Citric acid | 10.30 ± 0.03a | 4.09 ± 0.04b |
| Fumaric acid | 0.47 ± 0.002a | 0.43 ± 0.009b |
| Total content | 1.86 × 10³ ± 6.24a | 819.61 ± 4.00b |
| α-Tocopherol (mg per 100 g) | ND | 4.57 ± 0.0001 |
| β-Carotene (mg per 100 g) | ND | 5.49 ± 0.0001 |
| Ascorbic acid (mg per 100 g) | 36.18 ± 0.31a | 106.21 ± 0.76b |
ND, not detected; OFDHB, organic freeze-dried hawthorn berry; OFHB, organic frozen hawthorn berry.
The content of pectin was expressed as mg galacturonic acid per g of the sample. All values are expressed as means ± standard deviation. Any results with the same superscript in the same row are statistically not significant (P > 0.05) while those with different superscript are statistically significant (P < 0.05).
Vitamin C is an essential water-soluble vitamin, with an RDA of 15, 25 and 45 mg day−1 for children 1–3, 4–8 years and adults 9–13 years, respectively, while 75/45 and 90/75 mg/day for males/females aged from 14–18 years and over 19 years. Ascorbic acid, the major naturally occurring compound with vitamin C activity, is best known for its function as an antioxidant and a cofactor for many iron and copper hydroxylases involved in key physiological processes (Ball, 2005). HPLC chromatograms of ascorbic acid are shown in Figure S3e–g. The observed value for ascorbic acid of OFDHB (106.21 mg per 100 g) was significantly higher than that of OFHB (36.18 mg per 100 g; Table 5). According to the USDA database, OFHB had a higher level than that reported for blueberry (9.7 mg per 100 g) and raspberry (26.2 mg per 100 g) while slightly lower than that for strawberry (58.8 mg per 100 g) and orange (45.0 mg per 100 g).
Soluble sugars and organic acids
The contents of soluble sugars and organic acids in OFHB and OFDHB samples are shown in Table 5. The soluble sugars identified in OFHB were glucose (1.96 g per 100 g), fructose (7.34 g per 100 g) and sucrose (14.67 g per 100 g), totalling 23.98 mg per 100 g which is in accordance with the results of 10.86–37.18 g per 100 g (Liu et al., 2009). The soluble sugars contents of glucose (5.44 mg per 100 g), fructose (14.92 mg per 100 g) and sucrose (31.85 mg per 100 g) were significantly higher in OFDHB, which was in agreement with the proximate composition data of total carbohydrate content (Table 2). Sucrose was found to be the dominant soluble sugar followed by fructose and glucose. However, fructose was the dominant soluble sugar in jujube (Gao et al., 2012) and kiwifruit (Barboni et al., 2010) followed by glucose and sucrose.
Five organic acids, namely oxalic acid, tartaric acid, malic acid, citric acid and fumaric acid, were identified in OFHB and OFDHB as shown in Figure S3i, j. There was a predominance of malic acid among the organic acids in both OFHB (1.77 × 10³ mg per 100 g) and OFDHB (746.25 mg per 100 g) followed by oxalic acid (56.50 and 44.68 mg per 100 g) and tartaric acid (26.65 and 24.15 mg per 100 g). However, citric acid and quinin acid were the dominant organic acid as reported by Liu et al. (2009) of 22 cultivars/origins of three species of hawthorn (Crataegus spp.) and kiwifruit (Barboni et al., 2010), respectively. The level of fumaric acid was significantly lower (0.47 and 0.43 mg per 100 g, respectively) which was similar to previous results (Gundogdu et al., 2014). Organic acids in both samples were present in higher content; therefore, it exhibited an acidic flavour compared with cherry (De Souza et al., 2014). However, the total concentration of organic aids in OFHB (1.86 × 10³ mg per 100 g) and OFDHB (819.61 mg per 100 g) samples was significantly lower with the results of 3120–11 760 mg per 100 g (Liu et al., 2009), which indicated OFHB and OFDHB may have a slighter acidic flavour compared with other common hawthorn berry fruits. Recent research reported that hawthorn berry is commonly consumed to stimulate digestion and promote stomach function because of the abundant organic acids which make the digestion of lipids easier (Keating et al., 2014).
TPC, TFC, TPAC and in vitro antioxidant capacity
Antioxidant capacity describes the ability of redox molecules in foods and biological systems to scavenge free radicals, which provides a broader picture of the antioxidants present in a biological sample as it considers the additive and synergistic effects of all bioactive compounds rather than the effect of single compounds, and may, therefore, be useful to study the potential health benefits of foods on oxidative stress-mediated diseases (Puchau et al., 2010).
The results of TPC, TFC and TPAC are shown in Fig. 1a–c. TPC, TFC and TPAC of OFHB and OFDHB were 66.65 and 67.19 mg GAE g−1, 63.76 and 78.81 mg RE g−1, and 32.33 and 27.76 mg CE g−1, respectively. The peel of OFHB and OFDHB had significantly higher levels of TPC (77.25 and 122.19 mg GAE g−1), TFC (79.64 and 153.74 mg RE g−1) and TPAC (40.85 and 56.24 mg CE g−1) than those of flesh (57.42 and 51.82 mg GAE g−1, 62.48 and 69.05 mg RE g−1, 32.74 and 19.39 mg CE g−1, respectively). This trend was expected since phytochemicals participate in plant defence against UV radiation and herbivores, fungi and viruses attack (Cheynier, 2012).
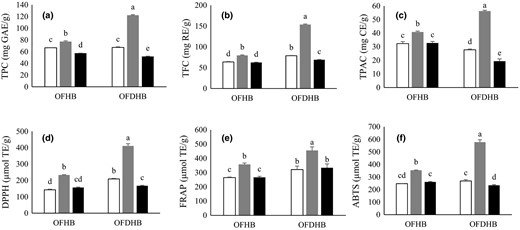
Total phenolics (TPC)/flavonoids (TFC)/procyanidins (TPAC) content (a–c) and antioxidant capacity (d–f) of Chinese organic frozen and freeze-dried hawthorn berries. Bars marked with the same superscript are statistically not significant (P > 0.05) while those with different superscript are statistically significant (P < 0.05). The results of TPC, TFC, TPAC and antioxidant capacity were expressed as mg gallic acid (GAE), rutin (RE), catechin (CE) g−1 and µmol Trolox equivalents (TE) g−1, respectively. OFHB, organic frozen hawthorn berry; OFDHB, organic freeze-dried hawthorn berry. Blank bar (whole fruit), grey bar (peel) and black bar (pulp).
The results of DPPH, FRAP and ABTS are shown in Fig. 1d–f. The antioxidant capacities of DPPH, FRAP and ABTS were 209.06, 321.48 and 268.53 µmol TE g−1 in OFDHB sample, which significantly (P < 0.05) decreased in OFHB by 31.67% (DPPH) and 17.56% (FRAP), while no significant different (P > 0.05) was found in ABTS decreased by 7.97%. Similar to TPC, TFC and TPAC, significant difference was found in DPPH (233.01 and 156.77 µmol TE g−1), FRAP (357.81 and 266.91 µmol TE g−1) and ABTS (353.48 and 260.79 µmol TE g−1) between OFHB peel and pulp. The peel of OFDHB sample had the highest antioxidant capacity followed the decreasing order of ABTS (577.5 µmol TE g−1) > FRAP (455.84 µmol TE g−1) > DPPH (410.75 µmol TE g−1) assay. Distinct distribution trend of antioxidant capacity was found in OFDHB pulp in the following order: FRAP (334.05 µmol TE g−1) > ABTS (234.01 µmol TE g−1) > DPPH (167.1 µmol TE g−1).
There is a growing interest in the natural antioxidants which have the potential for applications in the promotion of health and prevention against oxidative stress-related diseases (Dimitrios, 2006). Both OFHB and OFDHB samples had higher levels of TPC, TFC, TPAC and antioxidant capacity compared with other antioxidant-dense fruits. Marginally lower TPC (58.90 mg GAE g−1) and TPAC (29.60 mg CE g−1) for hawthorn (Crataegus monogyna; Bahorun et al., 2003), and TFC (1.13–2.36 RE g per 100 g) and FRAP antioxidant capacity (3.2–9.0 mol TE per 100 g) for jujube cultivars (Choi et al., 2011) were found compared with OFHB and OFDHB. According to the results of Wang et al. (2012), TPC of OFHB and OFDHB peel and pulp indicated higher content compared with that of blueberry peel (2509.2–6987.3 mg GAE per 100 g) and pulp (151.1–565.9 mg GAE per 100 g). The results of DPPH, FRAP and ABTS were comparably higher than 144.84, 63.68 and 194.46 μmol TE g−1 observed by Oszmiański et al. (2015) for cranberry. OFHB and OFDHB offered promising sources of natural antioxidants which have positive effect on human health.
Conclusions
Organic hawthorn berry (Crataegus pinnatifida) can meet the requirement of consumers for a natural and green healthy life for both nutritive and medicinal purposes. The results of this work indicated that both Chinese organic frozen and freeze-dried hawthorn berry could serve as good sources of nutrients and antioxidants. OFHB/OFDHB had a higher level of dietary fibre, pectin, mineral (Fe, Cu, Zn, and Se), vitamin C and antioxidant capacity than some common fruits and other species of hawthorn berries. The content of dietary fibre, minerals and vitamin C met RDA for consumers, as recommended by IOM. Both samples could have beneficial effects on blood pressure regulation and the prevention of hypertension as their much higher potassium while lower sodium content. OFDHB sample could be an excellent source for dietary fibre which has been attributed to that OFDHB sample had a more desirable ratio of insoluble/soluble dietary fibre than other fruits. As organic acids were present in a high content, both OFHB and OFDHB samples exhibited a slightly acidic flavour, and malic acid was the dominant organic acid. Antioxidant capacity of peel was significantly higher than that of pulp, and the ABTS assay of OFDHB peel reached up to 577.5 µmol Trolox equivalent g−1. Our findings clearly reveal that Chinese organic hawthorn berry is a good natural nutrient-dense and antioxidant sources for dietary supplements and an eco-environmentally high-quality raw material for the development of nutraceuticals and phytomedicines.
Acknowledgments
The authors appreciate Shenli Food Co., Ltd. in China and Mr. Long Yuan, the founder of Big Green (USA) Inc. in USA for sponsoring the project and providing the hawthorn berry samples. The authors appreciate Dr. Changmou Xu and Dr. Devin Rose for their assistance with HPLC-DAD and the guidance from the Food Processing Center laboratory and Cereal & Carbohydrate Chemistry Lab in Department of Food Science at University of Nebraska-Lincoln. Xinman Lou appreciates the China Scholarship Council (No. 201706300023).
Conflict of interest
The authors declare no conflict of interest.
Data availability statement
The data that support the findings of this study are available from the corresponding author upon reasonable request.
Ethical approval
Ethics approval was not required for this research.
