


Abstract
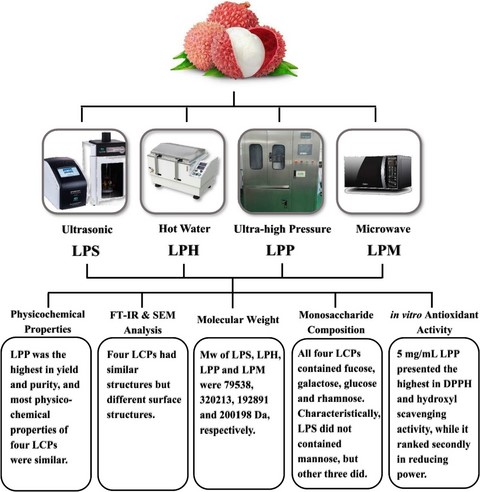
Water-soluble polysaccharides (LCPs) were extracted from litchi, wherein LPS, LPH, LPP and LPM were extracted by ultrasound, hot water, ultra-high pressure and microwave methods, respectively. The physicochemical properties, components, structures and in vitro antioxidant activities of four LCPs were investigated. LPP was the highest in yield and purity, and most physicochemical properties of four LCPs were similar. FTIR showed that LPP, LPS and LPH had ɑ-dominating configuration in pyranose rings. SEM showed that four LCPs were different, and LPH and LPP had relatively smooth and compact surfaces. The Mw of LPS, LPH, LPP and LPM were 79 538, 320 213, 192 891 and 200 198 Da, respectively. All four LCPs consisted of fucose, galactose, glucose and rhamnose. Except for LPS, the other three LCPs contained mannose. Based on the results of in vitro antioxidant activity, 5 mg mL−1 LPP presented the highest in DPPH and hydroxyl scavenging activity, while it ranked secondly in reducing power.
Introduction
Polysaccharides are ubiquitous in nature and have some biological activities such as anti-cancer, immunological activity (Jiang et al., 2018), anti-inflammatory and anti-oxidation (Cheung et al., 2014). Litchi (Litchi chinensis Sonn.) can resist oxidation, relieve fatigue and reduce visceral fat (Polyak et al., 2014). The polysaccharides from dried litchi had high anti-proliferative effects on HepG2, Hela and A549 cells in the range of 50–750 μg mL−1, and also stimulated macrophage phagocytosis, splenic lymphocyte proliferation and NK cell killing effects in the range of 50–400 μg mL−1 (Huang et al., 2014).
Litchi polysaccharides (LCPs) can be usually extracted by hot water method, which has disadvantages such as high temperatures and longer extraction times (Sun et al., 2017). Various novel techniques have been recently developed including microwave, ultrasound and ultra-high pressure (UHP), which can reduce extraction time and energy consumption as well as avoid property changes. Due to the absorption of microwave energy, the temperature and pressure inside the cell rise rapidly, causing the cell walls to swell and rupture. Thus, polysaccharides flow out and dissolve easily. Ultrasonic waves can produce mechanical vibration and cavitation to change material structure during extraction, and effective components can be released into the solvent. UHP can make plant tissues to fill the solvent and compress them quickly. In this paper, four methods of ultrasound, hot water, UHP and microwave were used to extract LCPs. Their characteristics and in vitro antioxidant activities were investigated by physiochemical property experiments, FTIR spectroscopy, SEM and HPGPC.
Materials and methods
Materials and reagents
Litchi (cultivar: Guiwei) was purchased from a local supermarket (Guangzhou, China). Fruits were selected with similar shape, weight and colour. Litchi pulps were used for extraction after removing the shells and cores. Absolute ethanol, phenol, hydrochloric acid, sulphuric acid and ascorbic acid were purchased from Guangzhou Chemical Reagent Factory (Guangzhou, China). All chemicals and reagents were of analytical grade.
Material pre-treatment
The dried litchi pulp was soaked in 95% (v/v) ethanol at a liquid–solid ratio of 1:1 (mL g−1) for 12 h, and the ethanol was removed with medium-speed filter paper twice. The soaked pulps were extracted with 80% (v/v) ethanol in a Soxhlet Apparatus for 6 h, during which time the ethanol was replaced every 3 h. Then, the samples were dried at 60 °C for 24 h. Subsequently, the solids were ground (FW 80 grinder, Tianjin Taisite Instrument Co., Ltd., Tianjin, China) and sifted through a mesh (0.71 mm, Jintan Fuhua Instrument Co., Ltd., Changzhou, China). The obtained powder was stored at 4 °C.
Ultrasonic extraction
The dried litchi powder was mixed with distilled water at a liquid–solid ratio of 12:1 (mL g−1) (Wu et al., 2007). The mixture was treated at ultrasonic intensity of 72 W for 32 min (JY98-IIIN ultrasonic disrupter, Ningbo Scientz Biotechnology Co., Ltd, Ningbo, China). Then, the mixture was centrifuged (5000 g, 15 min; TDL-5-A centrifuge, Shanghai Anting Scientific Instrument Factory, Shanghai, China) and filtered (SHZ-DIII vacuum pump, Gongyi Yuhua Instrument Manufacturing Co., Ltd., Gongyi, China). The filtrate was concentrated to 1/4 of the former volume at 55 °C (Rotary evaporator RE-2000B, Shanghai Yarong Biochemical Instrument Factory, Shanghai, China). Then, the solution was collected and stored at 4 °C, which is denoted by LPS.
Hot water extraction
Hot water extraction was done following Kong’s method (Kong et al., 2010b). The dried litchi powder was mixed with distilled water at a liquid–solid ratio of 14:1 (mL g−1). The mixture was adjusted to pH 8.0 with 0.05 mol L−1 sodium hydroxide solution and incubated at 80 °C for 4 h (HH-6 digital thermostat water bath, Changzhou Aohua Instrument Co., Ltd, Changzhou, China). Subsequent procedure was performed as described in ultrasonic extraction. The LCP extracted by hot water method is denoted by LPH.
UHP extraction
UHP extraction was performed according to the method described by Gao et al. (2017). The powder was mixed with distilled water at a liquid–solid ratio of 15:1 (mL g−1) and then was sealed by a vacuum package machine (FX-DZT400 vacuum packing machine, Fengxing Packing Machine Factory, Zhongshan, China). The bags were put into the treatment vessel of UHP equipment (HP 600 MPa/5 L, Baotou Kefa High Pressure Technology Co., Ltd, Baotou, China). The pressure gradually increased until it reached 460 MPa, holding for 17 min. Subsequent procedure was performed as described in ultrasonic extraction. The LCP extracted by UHP method is denoted by LPP.
Microwave extraction
The dried litchi powder was mixed with distilled water at a liquid–solid ratio of 8:1 (mL g−1) and treated at microwave intensity of 640 W for 10 min (Midea AH032AX5 microwave oven, Guangdong Midea kitchen appliances manufacturing Co., Ltd, Foshan, China) (Dong et al., 2006). Subsequent procedure was performed as described in ultrasonic extraction. The LCP extracted by microwave method is denoted by LPM.
Polysaccharides purification
The enzyme-Sevag method was used for polysaccharides deproteinisation (Liu et al., 2013). The process of removing proteins was repeated until there was no protein precipitation in the solution of Sevag reagent (chloroform: n-butyl alcohol = 4:1, v/v) and polysaccharides. The LCP in 80% (v/v) ethanol solution was kept at 4 °C overnight. After centrifugation, the precipitate was collected and washed with 80% (v/v) ethanol and then freeze-dried (Scientz-18N Freeze Drier, Ningbo Biotechnology CO., Ltd, Ningbo China) at −48 °C to obtain crude LCPs. The yield of polysaccharides was calculated using Eq. (1).
where mp is the weight of dried crude polysaccharides and ml is the weight of litchi on dry basis.
Physicochemical properties analysis
Molish test and I2-KI reaction were used to determine the existence of polysaccharides and starches in the extracts, respectively (Chen et al., 2015). Fehling test and FeCl3 reaction were used to determine the existence of reducing sugars and polyphenols (Sun et al., 2011). The polysaccharides components were determined using ultraviolet spectrometry (Shimadzu UV-1800, Shimadzu Co., Ltd, Japan; Yu et al., 2017). In addition, the contents of polysaccharides and protein were analysed by phenol-sulphuric acid method (Baik et al., 2015) and G250 method (Zou et al., 2014), respectively.
FTIR analysis
The FTIR analysis was carried out using the KBr-disc method as described by Hong with a slight modification (Hong et al., 2016). 3 mg LCP was mixed with dried KBr powder and ground for 5 min in an agate mortar. Then, the mixture was compressed until it became transparent. The tablet was assayed with the spectrophotometer (Bruker Tensor 27, Bruker Optik, Ettlingen, Germany) at 4000–400 cm-1.
SEM analysis
LCPs were sprayed with a thin layer of gold and put into a scanning electron microscope system (SEM, ZEISSEVO18, Carl Zeiss NTS, Germany) for observing the microstructure.
Determination of molecular weight
The molecular weight of LCP was determined by high-performance gel permeation chromatography (HPGPC) with a Waters 2414 differential detector, G-5000 PWXL column (7.8 × 300 mm) and G-3000 PWXL column (7.8 × 300 mm) (Tosoh Bioscience, Stuttgart, Germany). The mobile phase was 0.02 mol L−1 monopotassium buffer solution (KH2PO4) at a flow rate of 0.6 mL min−1 (Zheng et al., 2015). The standard curve of dextran with molecular weight of 4.88 × 10³–4.86 × 10⁵ Da was obtained at 35 °C. Then, the molecular weight was calculated by GPC software (Breezel, Waters Co., Ltd, USA).
Determination of polysaccharides composition
Arabinose, rhamnose, xylose, fucose, mannose, fructose, galactose and glucose were used as monosaccharide standards and inositol hexaphosphate was used as an internal standard. 10 mg LCP was hydrolysed with 5 mL 2 mol L−1 trifluoroacetic acid (TFA) at 120 °C for 6 h. Then, the mixture was freeze-dried at −48 °C. The trimethylsilylation derivatisation of the hydrolyte was performed and the composition was identified using gas chromatography (GC 7820A, Agilent of America, America). 10 mg dry hydrolysed polysaccharide was dissolved in 1 mL pyridine. 0.4 mL hexamethyldisilazane and 0.2 mL chlorotrimethylsilane (TMCS) were added to the above solution, and the mixture was allowed to react for 30 min at room temperature. After the resulting product was centrifuged (3000 g, 15 min), the supernatant was obtained for determination. The GC conditions were as follows: hydrogen flow rate 16 mL min−1, airflow rate 150 mL min−1 and nitrogen flow rate 20 mL min−1. The temperature was raised from 130 to 180 °C at 5 °C min−1 and held for 2 min. Then, it was raised to 220 °C at the same ratio and held for 3 min. Compared with the standard peaks, the monosaccharide composition of polysaccharides was determined.
Reducing power activity assay
0.5 mL LCP (1–5 mg mL−1) was mixed with 2.5 mL phosphate buffer (0.2 mol L−1, pH 6.6) and 2.5 mL potassium ferricyanide (1%, w/v) at 50 °C for 20 min. To the mixed solution, 2.5 mL trichloroacetic acid solution (TCA, 10%, w/v), 2.5 mL distilled water and 0.5 mL ferric chloride solution (0.1%, w/v) were sequentially added after cooling to room temperature. The mixture absorbance was measured at 700 nm with a spectrophotometer (Shimadzu UV-1800, Shimadzu Co., Ltd, Japan).
DPPH scavenging activity assay
DPPH scavenging activity was determined as described by Zhang (Zhang et al., 2015). LCP (1–5 mg mL−1) was mixed with 2 mL 0.2 mmol L−1 DPPH-ethanol solutions. The mixed solution was incubated in the dark at room temperature for 30 min, and then the absorbance (A1) at 517 nm was measured rapidly. Then, the absorbance (A2) was measured by replacing the sample solution with distilled water. In addition, LCP was mixed with ethanol solution, and the absorbance (A3) was measure. DPPH scavenging activity was calculated using Eq. (2).
Hydroxyl scavenging activity assay
The determination of hydroxyl scavenging activity was based on Jeong’s method (Jeong et al., 2009). LCP (1–5 mg mL−1) was mixed with 1.0 mL 9 mmol L−1 FeSO4 solution, 1.0 mL 9 mmol L−1 salicylic acid solution and 1.0 mL 9 mmol L−1 H2O2 solutions. The mixture was then incubated at 30 °C for 30 min. The absorbance value (A4) was measured at 510 nm. In addition, the sample solution was replaced with distilled water to determine the absorbance (A5). The hydroxyl scavenging capacity was calculated using Eq. (3).
Statistical analysis
All the data are expressed as the mean of three replicates, and significant differences are determined by one-way analysis of variance at P < 0.05 using SPSS version 19.0 (SPSS Inc., Chicago, IL, USA).
Results and discussion
Yields and physicochemical properties
The yields and physicochemical properties of four LCPs are shown in Table 1. The maximum yield (12.01%) of LCP with protein was obtained by UHP extraction (LPP), followed by LPS, LPM and LPH. The yields of LPH (9.60%) and LPM (10.69%) were higher than previous results (3.30% and 6.17% respectively), while LPS (11.09%) was lower than the result (19.07%) (Li, Long & Xie, 2004; Dong et al., 2006; Wu et al., 2007).
Comparison of yields and physicochemical properties of four LCPs
| Sample | LPS | LPH | LPP | LPM |
|---|---|---|---|---|
| Yield/% | 11.09 ± 0.20b | 9.60 ± 0.19d | 12.01 ± 0.23a | 10.69 ± 0.21c |
| Polysaccharides content/% | 46.95 ± 0.47d | 71.67 ± 0.90b | 79.72 ± 0.92a | 66.71 ± 0.81c |
| Protein content/% | 5.00 ± 0.12a | 3.01 ± 0.07c | 1.05 ± 0.03d | 4.23 ± 0.11b |
| Patten | Orange flocculent | Brown flocculent | Orange flocculent | Yellow flocculent |
| Water-solubility | + | + | + | + |
| Ethanol-solubility | − | − | − | − |
| Ether-solubility | − | − | − | − |
| Acetone-solubility | − | − | − | − |
| Molisch test | + | + | + | + |
| I2-KI | − | − | − | − |
| Fehling reaction | − | − | − | − |
| FeCl3 reaction | − | − | − | − |
| UV260 nm | − | − | − | − |
| UV280 nm | + | + | + | + |
Each value is the mean ± standard deviation of three replicates. Means with different letters within a row are significantly different (p < 0.05). The symbol ‘+’ indicates positive. The symbol ‘−’ indicates negative.
There were significant differences in the colour of four LCPs: LPH was brown, indicating the presence of more pigments. LPS and LPP were orange and flocculent, while LPM was pale yellow. All four LCPs were soluble in water, but insoluble in ethanol, ether and acetone. The Molish test indicated that the four LCPs were general polysaccharides. The order of polysaccharides content was as follows: LPP > LPH > LPM > LPS, while that of protein content was completely reverse. The results of I2-KI, Fehling reaction and FeCl3 reaction were negative, indicating that the four LCPs did not contain starch, reducing sugar or polyphenol. In the ultraviolet spectrum of 200–400 nm, no peaks appeared at 260 nm, indicating that there were no nucleic acids in all four LCPs.
FTIR analysis
Infrared spectroscopy has been widely used to analyse molecular structure and chemical bond in materials, as well as to identify chemical. As shown in Fig. 1, the strong absorption peaks in the range of 3200–3600 cm−1 indicated the stretching vibration of hydroxyl group. The absorption peaks in the vicinity of 2935 cm−1 were due to the stretching vibration of -CH. The absorption peak of LPP at 2929 cm−1 was stronger than those of the others, suggesting that LPP might have more -CH group (Li et al., 2013). The absorption peaks of four LCPs in the vicinity of 1631 cm−1 indicated the presence of bound water in the polysaccharide molecules. Their absorption peaks in the range of 1000–1200 cm−1 indicated that all four LCPs were composed of pyranose rings. The absorption peaks of LPS and LPH at 867 cm-1 and LPP at 870 cm−1 were the typical ɑ-dominating configuration in pyranose rings. The absence of a significant absorption peak of LPM at 867 cm−1 indicated that the pyranose ring might be composed of other configurations, or that the amount of α-dominating configuration was small.
![Infrared spectra of four litchi polysaccharides. [Colour figure can be viewed at wileyonlinelibrary.com]](https://oup.silverchair-cdn.com/oup/backfile/Content_public/Journal/ijfst/55/3/10.1111_ijfs.14413/1/m_ijfs14413-fig-0001-m.jpeg?Expires=1750283356&Signature=qse~TXthV0TfF6YGgCKw64KWpHTiR2zbUjTFnJOxOL0Sj0vvUEZuvXAFd58l3EPaXJdxHUedMhgedGpS836JDRsGxhpxDOwbq9EF4YhCONU6tnCeRA-99nof-oRtKjio2HMcdBestTu~KhChbcA3uQai~fM1baBhN-ba4F54NbU53AbPl3vr0fwd2f5drogNYA4Y2Xffq1o1bmUiionO~7sXorZzO9V-kDagXWP3R~RZRI0TiuCh2ClsIG29PK9y11OtS63rmb10MWiMMKQJGSleZrWCGXinnAjENvyi3LeWxnOovD-wZbTBVBRSA8fmpI3JQLmfW8YPt2nkXpJJQg__&Key-Pair-Id=APKAIE5G5CRDK6RD3PGA)
Infrared spectra of four litchi polysaccharides. [Colour figure can be viewed at wileyonlinelibrary.com]
SEM analysis
SEM can observe the surface structures of LCPs. Fig. 2a showed that LPS had a rough surface with many characteristic wrinkles and cracks and was not as compact as the structures of other LCPs. This might be due to the cavitation effects of ultrasound, which changed the microstructure of polysaccharides. As shown in Fig. 2b and c, LPH and LPP had relatively smooth and compact surface structures. However, LPP had many branching structures that were not found in other LCPs. Fig. 2d showed that LPM had a relatively rough surface, and there were no wrinkles on the surface as compared to LPS.
![Scanning electron micrographs of LPS (a), LPH (b), LPP (c), LPM (d). [Colour figure can be viewed at wileyonlinelibrary.com]](https://oup.silverchair-cdn.com/oup/backfile/Content_public/Journal/ijfst/55/3/10.1111_ijfs.14413/1/m_ijfs14413-fig-0002-m.jpeg?Expires=1750283356&Signature=EP0A7kvFEt3imK3x4th-gLHKoYpP--PJb-bGUHkTuPlwJTwdkSMX1I1SCDttIQFhOoYleGR5Yck61JQ8PcS8skZzYhHUSu86R-OzjGaDwsyFLGredlHK~UaNMQmZ-s6iZgsGkiF61gQZ4z8qYv691dw7umA0XZCETiElwFYCpgO~KUzoHsmKbBSSxp~nABt17Yj9S9Ti8ffD0pRY~RIYo8gokXMNMc5FCFI7wj37SarU93ygsFlvoe68TKkpB3-Ng4Gl8pID8DD4kwKtc75qagAC571UhpCIZq3OT6tPssiIZgOE3va8PJJGEdxuyWscSelkftUYSnkQ~NKRxmUC3Q__&Key-Pair-Id=APKAIE5G5CRDK6RD3PGA)
Scanning electron micrographs of LPS (a), LPH (b), LPP (c), LPM (d). [Colour figure can be viewed at wileyonlinelibrary.com]
Molecular weight
Molecular weight of polysaccharides can severely affect the biological activities and applications of polysaccharides (Xu et al., 2018). In Table 2, the results showed that the Mw of LPS, LPH, LPP and LPM were approximately 79 538, 320 213, 192 891 and 200 198 Da. The litchi polysaccharide which was extracted at 80 °C for 4 h possessed three fractions with molecular weight of 116 440, 31 424 and 28 181 Da (Kong et al., 2010a). Mw/Mn can be used to indicate the homogeneity of molecular weight distribution. The closer the value of Mw/Mn is to 1, the more uniform the molecular distribution. The values of Mw/Mn indicated that the molecular distribution of LPS was more uniform.
Molecular weights and monosaccharide composition of four LCPs
| Samples | LPS | LPH | LPP | LPM | |
|---|---|---|---|---|---|
| Molecular weight | Mw | 79 538 | 320 213 | 192 891 | 200 198 |
| Mn | 40 609 | 93 995 | 63 394 | 80 057 | |
| Mw/Mn | 1.96 | 3.41 | 3.04 | 2.50 | |
| Monosaccharide standard (mole per cent/%) | Arabinose | ||||
| Rhamnose | 6.09 | 7.43 | 7.89 | 7.62 | |
| Xylose | |||||
| Fucose | 53.22 | 36.26 | 46.45 | 54.10 | |
| Mannose | 5.94 | 9.71 | 12.14 | ||
| Fructose | |||||
| Galactose | 27.97 | 11.68 | 19.63 | 17.43 | |
| Glucose | 12.73 | 38.69 | 16.32 | 8.71 | |
| Inose | |||||
Mw, Weight-average molecular weight; Mn, Number-average molecular weight.
Monosaccharide composition
As shown in Table 2, no arabinose, xylose, fructose or inose were found in all four LCPs. LPH was mostly composed of fucose and glucose in a molar ratio of 36.26 and 38.69. LPP, LPS and LPM were mostly composed of fucose, with molar ratio of 46.45, 53.22 and 54.10, respectively. It was worth mentioning that LPH, LPP and LPM contained a slight amount of mannose, but LPS showed no mannose. It can be inferred that ultrasound lead to degradation of water-soluble polysaccharides, mostly chemical bond breaking and atomic rearrangement (Koda, Taguchi & Futamura, 2011).
Determination of in vitro antioxidant activity
Reducing power
Reducing power is widely used to evaluate the antioxidant activity of phytochemicals (Wu et al., 2015). As shown in Fig. 3a, the reducing power of four LCPs was positively correlated with concentration. A 5 mg mL−1 of every LCPs showed the highest absorbance value in the concentration range and that of LPM was the maximum (1.55).
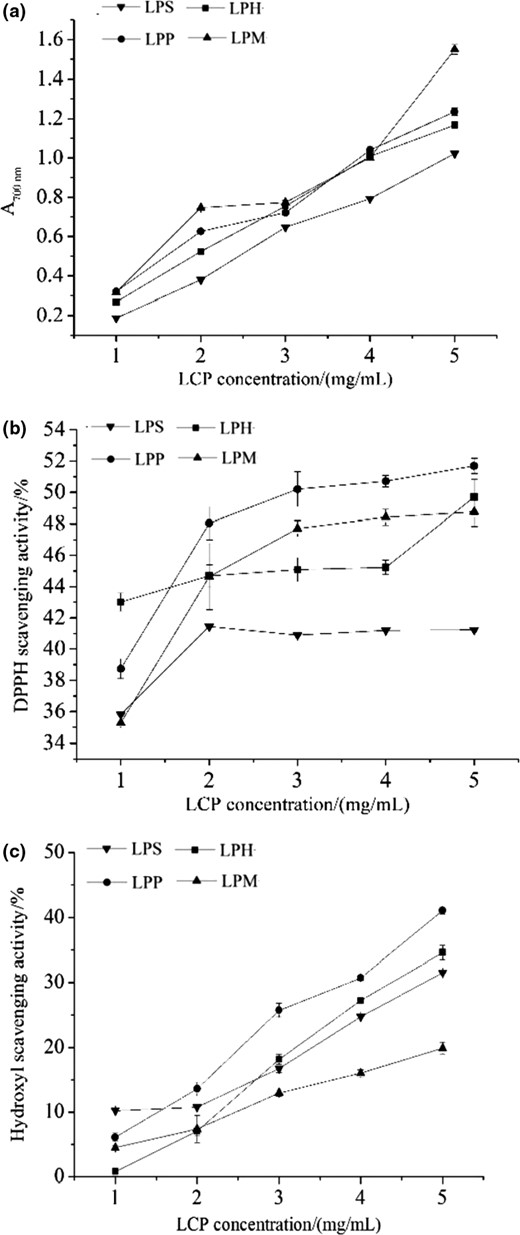
In vitro antioxidant activities of four LCPs. (a, reducing power; b, DPPH scavenging activity; c, hydroxyl scavenging activity).
DPPH scavenging activity
DPPH scavenging activity is commonly used to evaluate antioxidant activity of natural compounds because DPPH radical is a stable radical with a maximum absorption at 517 nm (Peng et al., 2019). As shown in Fig. 3b, 5 mg mL−1 LPM, LPH and LPP respectively reached their maximum absorption value, while 2 mg mL−1 LPS did it. A 5 mg mL−1 LPP showed the strongest DPPH scavenging activity of 51.69%. As the concentration increased, DPPH scavenging activity of LPP increased significantly and remained the highest in the range of 2–5 mg mL−1. It could be inferred that LCPs might contain substances which could donor hydrogen, react with free radicals and eventually terminate the further reaction of radical chain.
Hydroxyl scavenging activity
Hydroxyl can lead to tissue damage and even cell death, so hydroxyl scavenging is an effective way to protect the life system. Fig. 3c showed that the hydroxyl scavenging activity of four LCPs increased significantly with increasing concentration, indicating its concentration dependence. The upward trend of LPP was the most significant among all four LCPs. At a concentration of 5 mg mL−1, the hydroxyl scavenging activities of all four LCPs reached their highest value, while that of LPP was highest and that of LPM was the lowest.
Discussion
Four LCPs had different properties and structures through research. LPS containing the lowest content of polysaccharides may be related to degradation due to ultrasonic cavitation. The lowest Mw and SEM image also confirmed this assumption. As the yield of LPH was the lowest and its colour was the darkest, it was not suitable for development into industrial products. LPP was the highest in yield and purity with light colour and had smooth and compact surface, suggesting that UHP method was better than others. The yield and purity of LPM were at middle level, and SEM image showed that its structure was rough without wrinkles and branches. The degree of polysaccharides degradation by microwave may be between ultrasound and UHP.
The antioxidant activities of polysaccharides might be related to their protein content, glucuronic acid, molecular weight and glycoside bond (Jiménez-Escrig, Gómez-Ordóñez & Rupérez, 2015), and also to their monosaccharide composition, in which glucose, mannose and galactose play an important role (Huang et al., 2015). Based on the above results of in vitro antioxidant activity, 5 mg mL−1 LPP presented the highest in DPPH and hydroxyl scavenging activity, while it ranked secondly in reducing power. At a concentration of 5 mg mL−1, LPS presented the lowest in reducing power and DPPH scavenging activity while it ranked thirdly in hydroxyl scavenging activity. As shown in Table 2, LPP had stronger antioxidant activities due to more mannose and rhamnose. Moreover, LPS containing no mannose and low content of rhamnose (6.09%) showed lower antioxidant activities. In the previous studies of D. nobile polysaccharides, DNP4-2 that had higher content of rhamnose (12.59%) than other fractions showed strong DPPH and hydroxyl radical scavenging activities, while DNP3-1 that contained least mannose (6.55%) showed low ones (Luo et al., 2010).
Some studies inferred that molecular weight was an important factor influencing antioxidant activities. The polysaccharides from Actinidia arguta fruit that had the smallest molecular weight fraction (6.20 × 10⁴ Da) showed the highest antioxidant activity (Zhu et al., 2019). Litchi polysaccharides LP-6 (87 697 Da) extracted by hot water showed higher ORAC value than other two fractions (Huang et al., 2015). However, LPP (192 891 Da) of which the Mw was higher than that of LPS (79 538 Da), showed higher antioxidant activities. The good antioxidant activities of LPP could be possibly related to the contents of mannose and rhamnose, molecular weight and configuration. Therefore, UHP will be a promising method for extracting LCP.
Acknowledgments
This research was financially supported by the Science and Technology projects of Guangdong province (2016A020210008, 2017B020207001), the National ‘Thirteenth Five’ Key Research Project (2017YFD0400502), the 111 Project (B17018) and the National Natural Science Foundation of China (21576099).
Ethical guideline
Ethics approval was not required for this research.
Conflict of interest
There is no conflict of interest for this research.
Data Availability Statement
Research data are not shared.
